
Advertisement
Advertisement
About 70% of XRP Supply Bought Near Latest Price Top — History Indicates Dump Next
By:
Key Points:
- Over 70% of XRP's realized cap was accumulated near the recent top, echoing patterns seen before past 80–95% drawdowns.
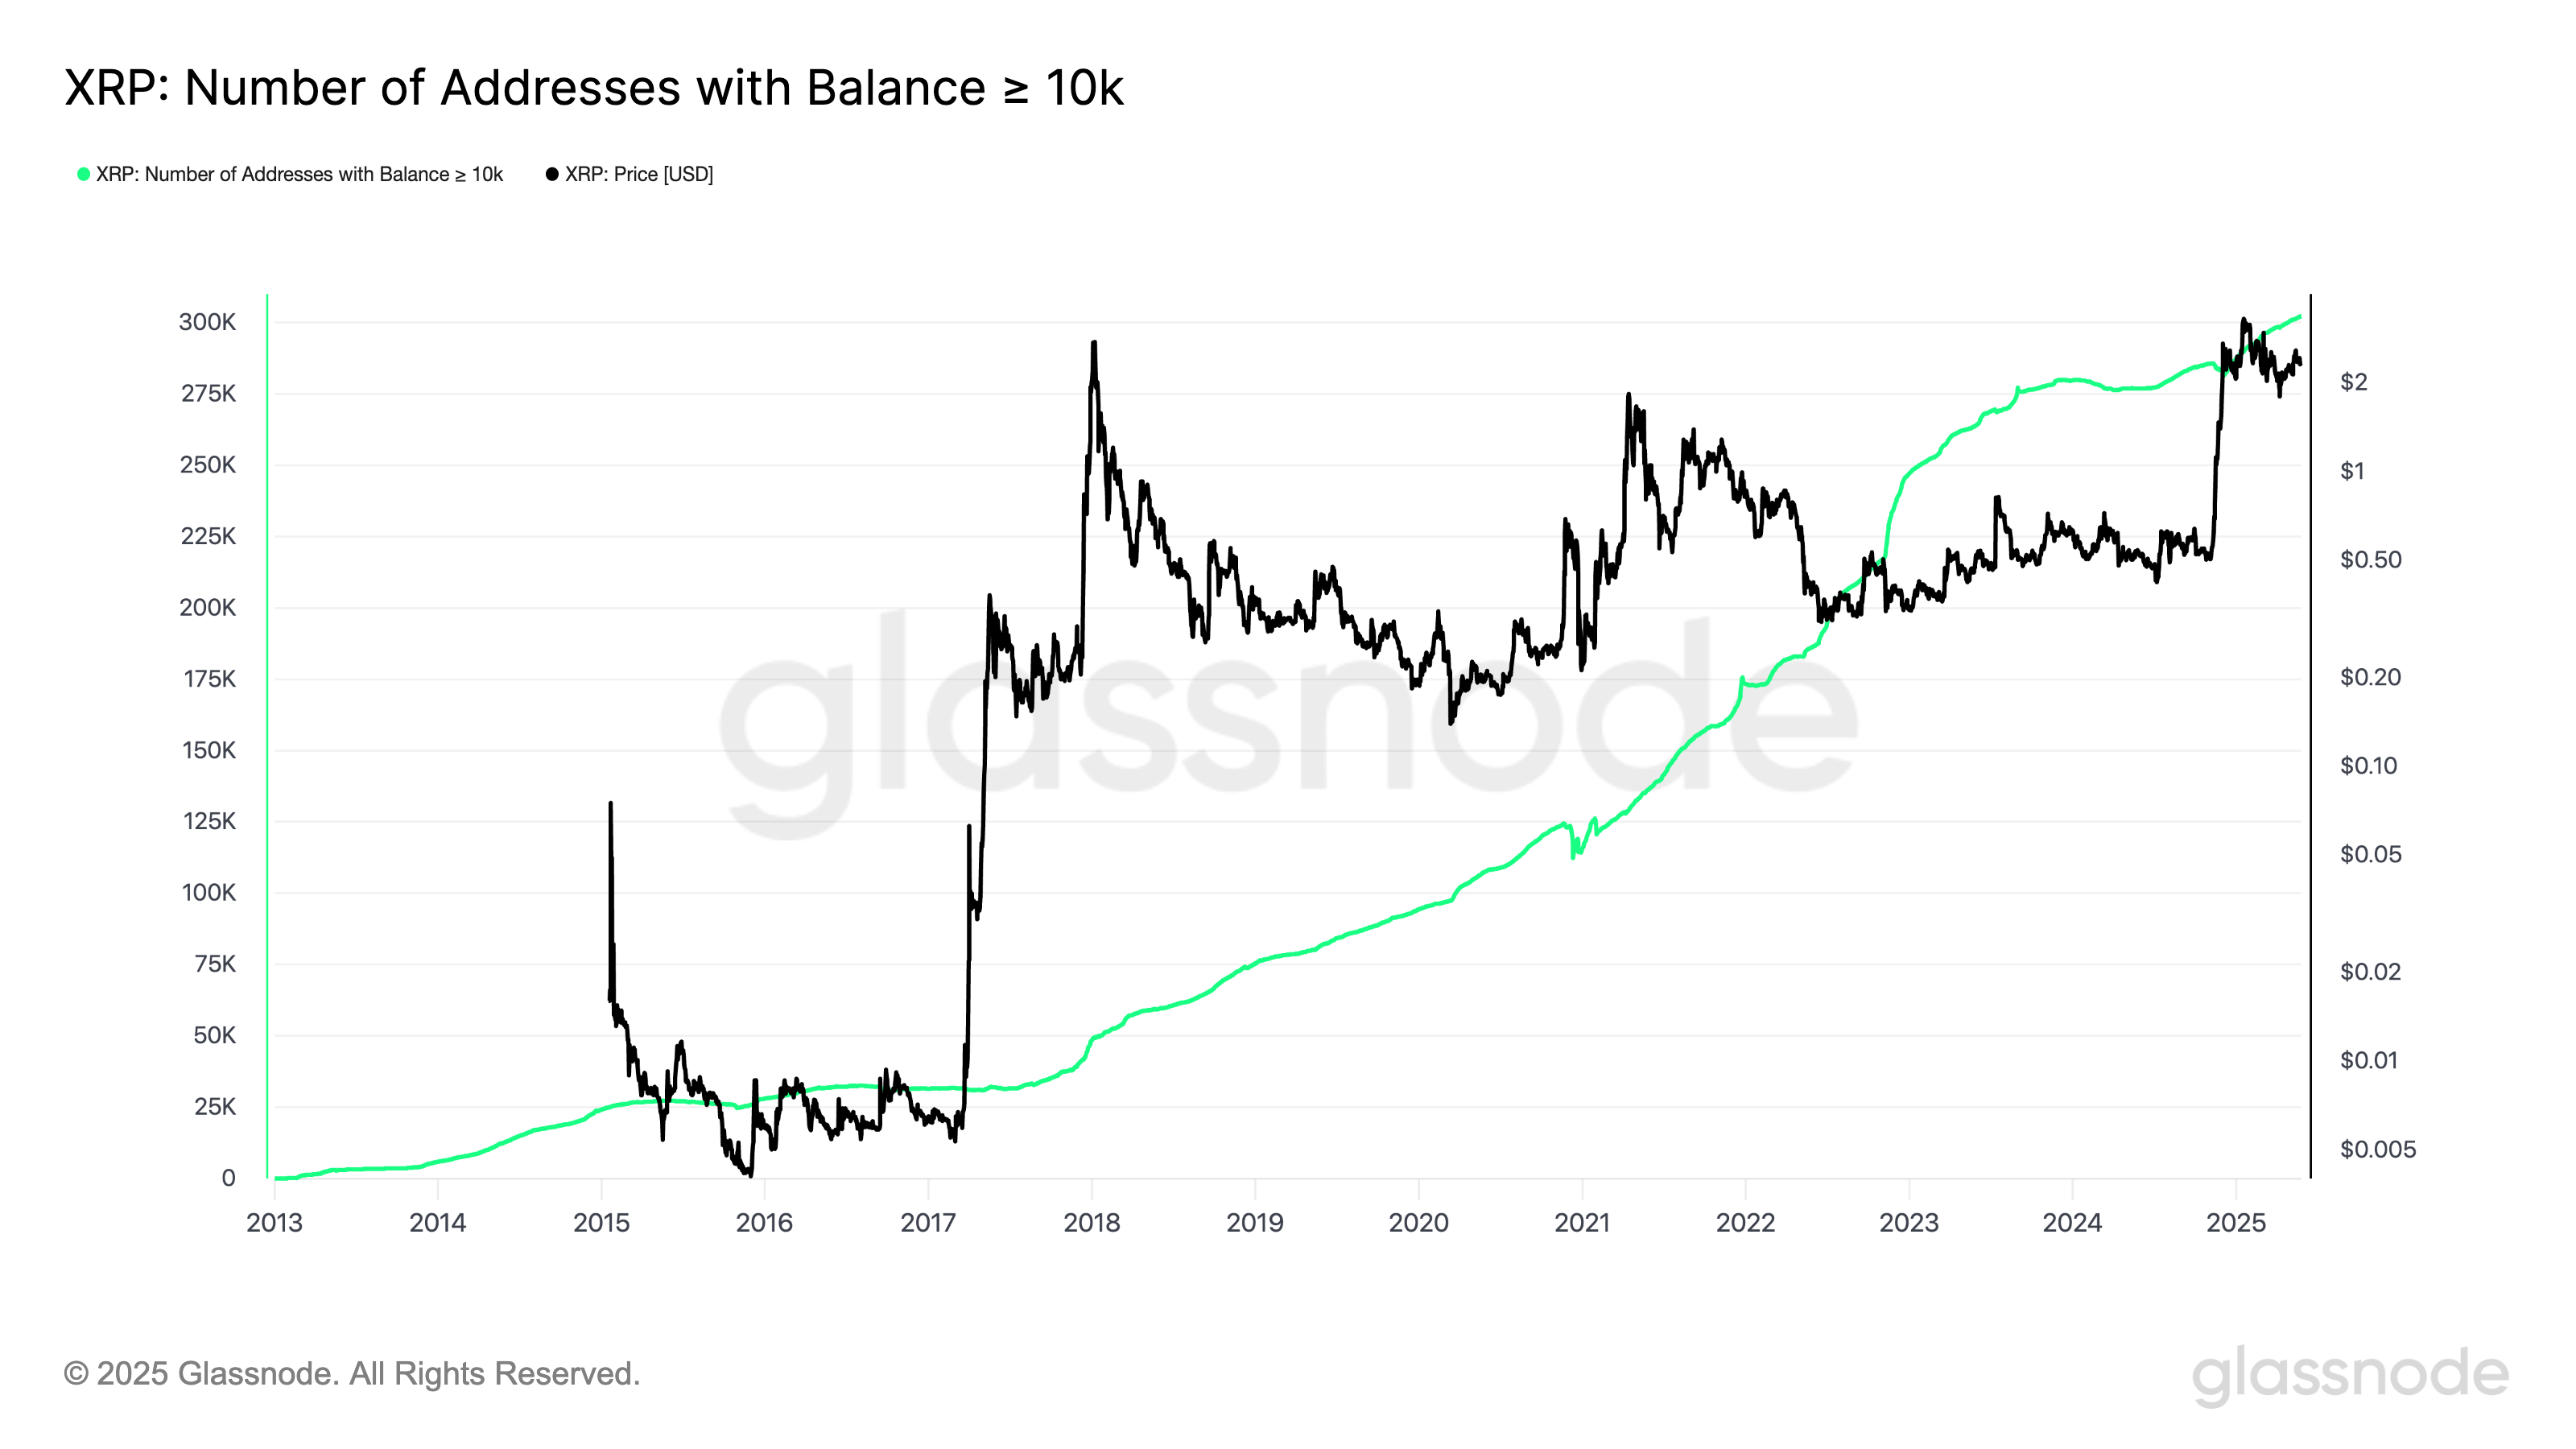
- The number of wallets holding 10,000+ XRP has surged, raising concerns of retail-driven panic selling in a downturn.
- XRP has broken down from a bear flag structure, with the next major support near the 200-3D EMA at $1.39, a 40% drop from current levels.

A significant chunk of XRP’s (XRP) circulating supply was acquired at or near its recent price peak, a setup that has historically preceded sharp sell-offs, according to onchain data.
History Indicators Massive XRP Dump Next
Per Glassnode, over 70% of XRP’s realized market capitalization — a metric that values coins based on their last traded price — was accumulated between late 2024 and early 2025, when XRP rallied to nearly $3.40.
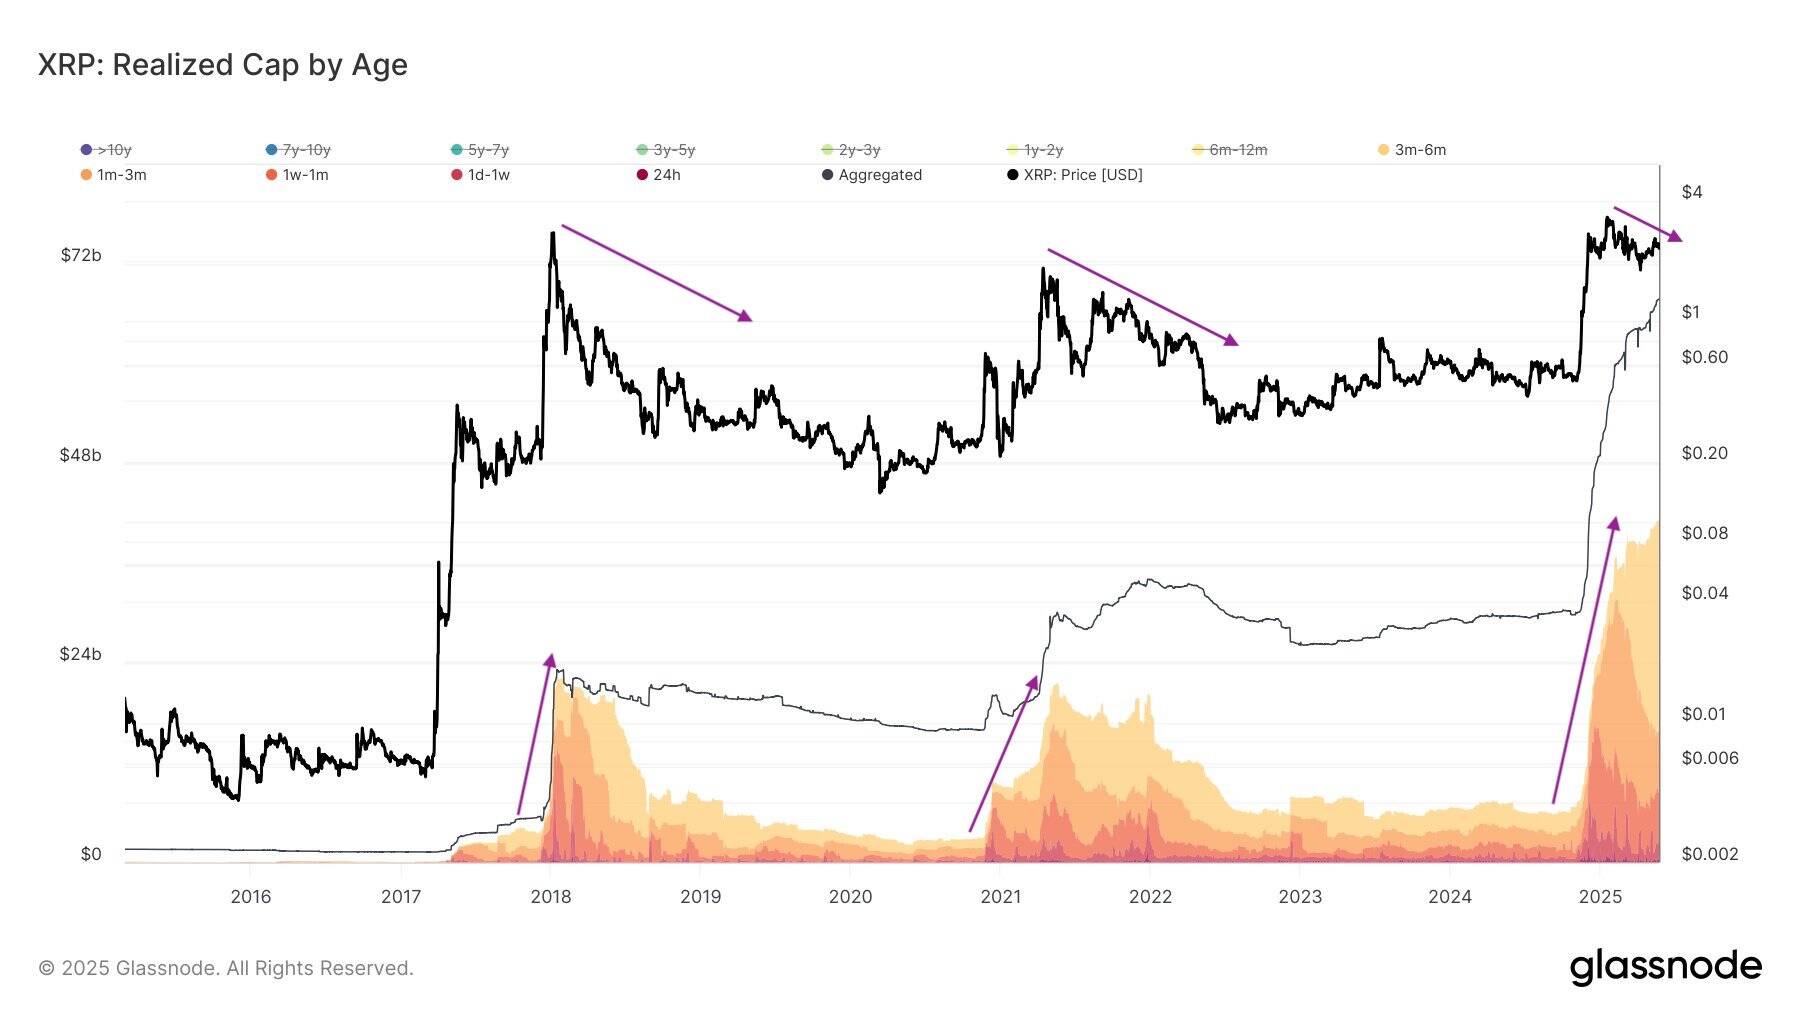
The data suggests that most current holders are short-term buyers who entered the market during or shortly after the price top.
“That means most people will sell if the price drops a lot because most people are just tourists,” one chartist noted. History shows that massive spikes in the lower age bands’ realized price have preceded sharp downturns in 2018 and 2021, wherein prices fell 80-95%.
Interestingly, the number of traders with a balance of at least 10,000 XRP (or about $22,800 at current prices) has increased substantially in the past months. That amounts to a considerable retail presence that may panic-sell its holdings on the first sign of a significant correction.
XRP Cup and Handle Breakdown Risks Deeper Drop
XRP appears to be breaking down from a bearish flag-like structure that formed after a classic cup-and-handle pattern.
The cup formed between November 2024 and February 2025, peaking near the $3.40 level. The handle, typically a consolidation before continuation, instead developed into a narrow ascending channel, or bear flag, as marked in the chart.
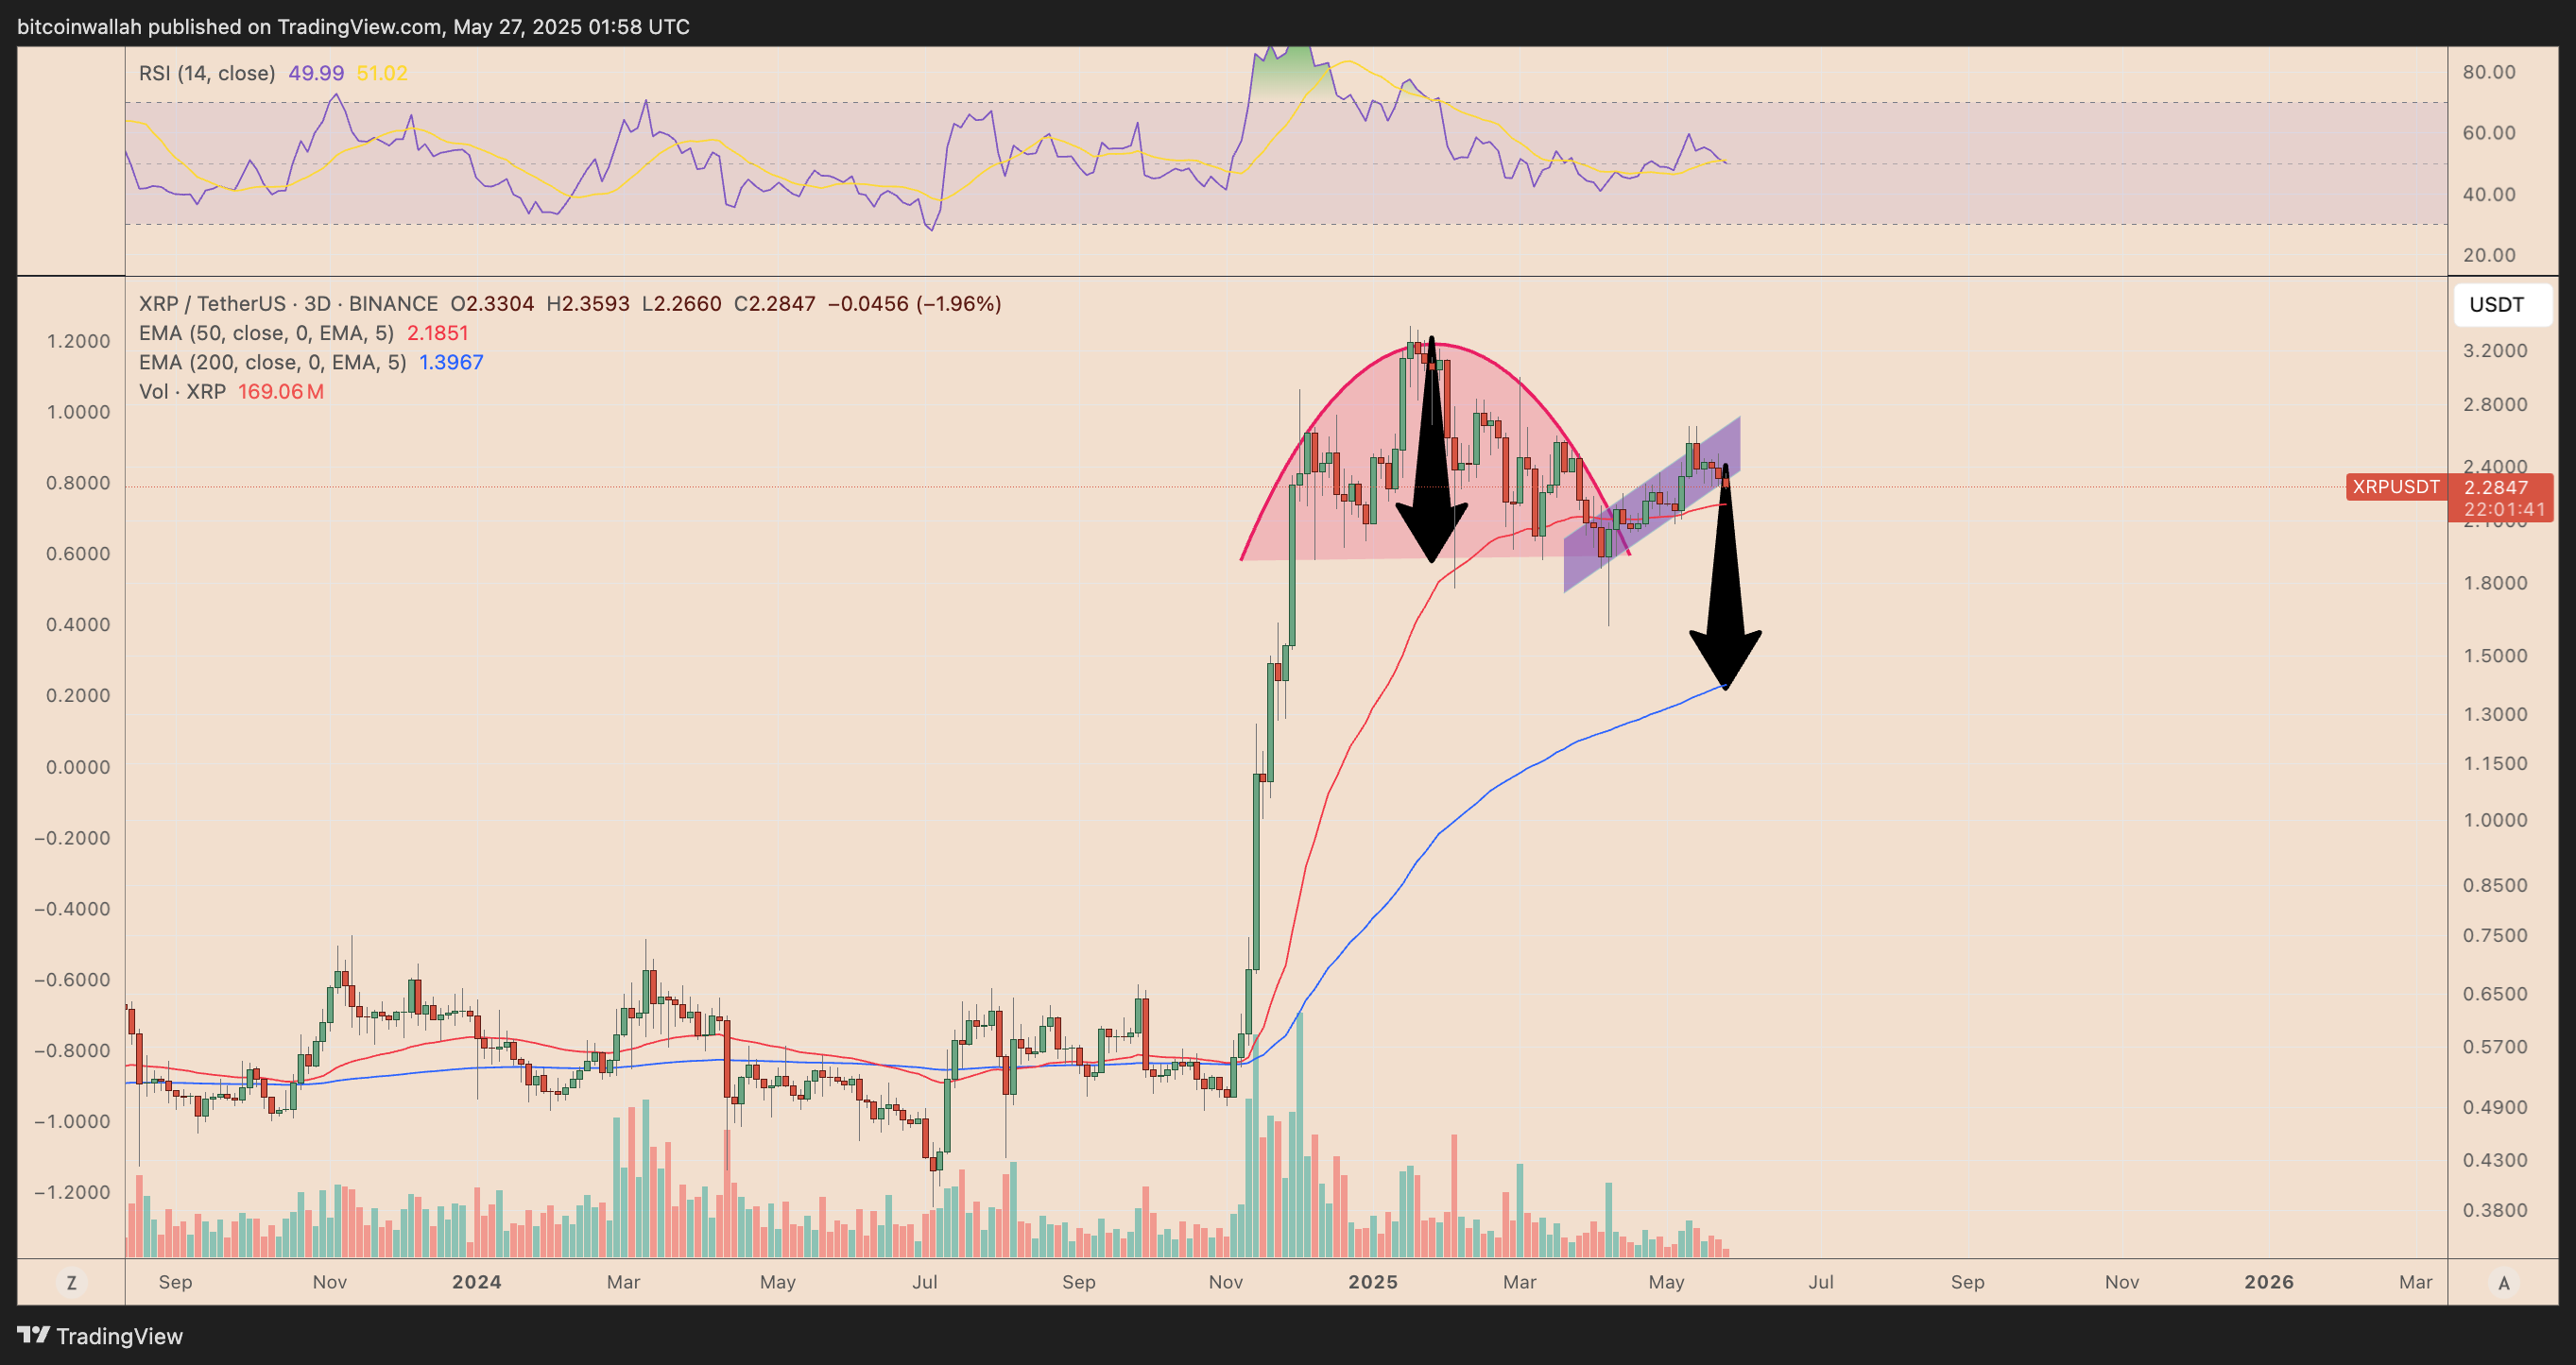
As of May 27, XRP has broken below this rising channel, confirming a bear flag breakdown. This breakdown shifts the focus to the next key support area: the 200-period exponential moving average (200-EMA; the blue wave) on the 3-day chart, currently near $1.39.
That target aligns closely with previous horizontal support levels from January and reflects a potential 38–40% decline from current price levels near $2.28. The RSI around 50 suggests that there’s still room for downside before the market becomes technically oversold.
About the Author
Bob MasonChief Crypto Boss
123456789 30 He has written extensively for a broader audience and his current focus is on developments relating to the financial markets including, but not limited to currencies, commodities, alternative asset classes, and global equities.


Advertisement