
Advertisement
Advertisement
AUD/USD, NZD/USD, and USD/JPY Analysis: US Dollar Weakness Fuels Forex Volatility
By:
Key Points:
- AUD/USD consolidates within an ascending broadening wedge pattern.
- NZD/USD consolidates within a bullish trend.
- USD/JPY failed to break above 148 and is correcting lower.

AUD/USD Under Pressure Despite Positive Domestic Data
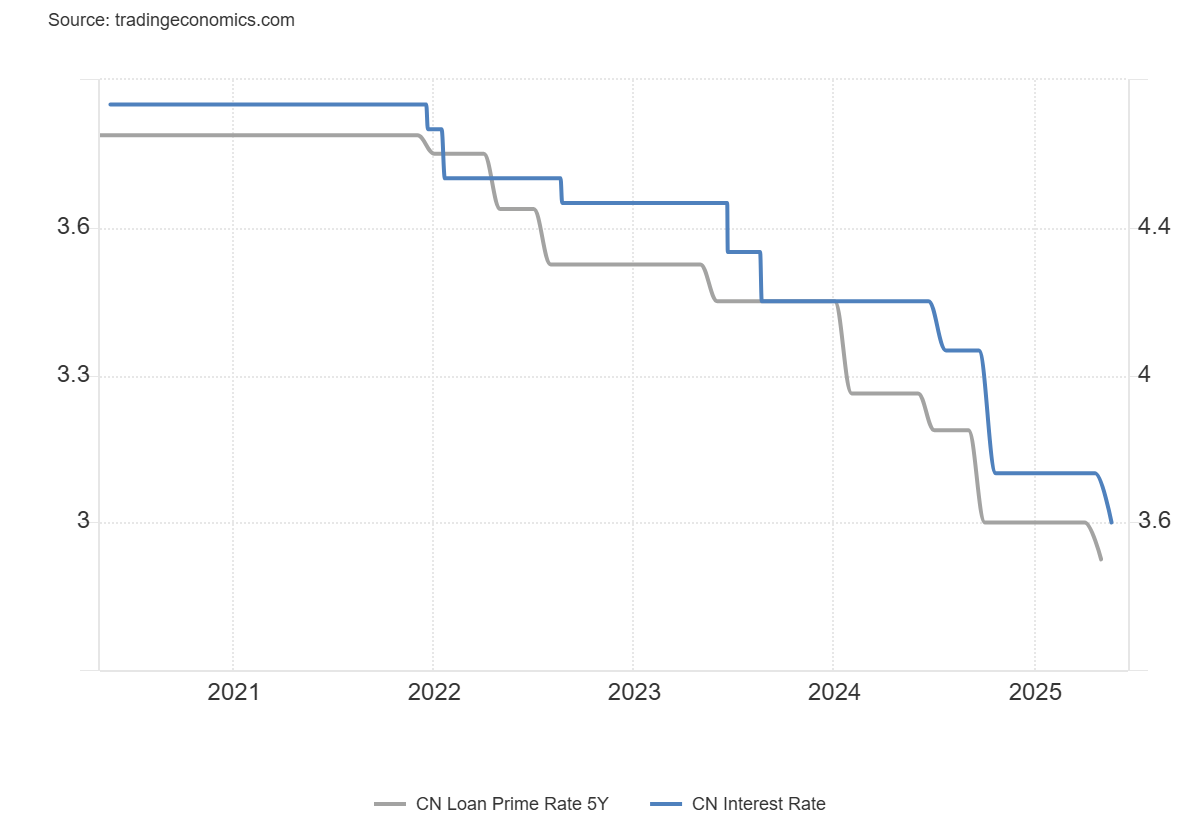
The Australian Dollar (AUD) declined against the US Dollar (USD) on early Tuesday after gaining over 0.50% in the previous session. The drop followed the People’s Bank of China’s rate cut. The chart below shows that the one-year LPR was lowered from 3.10% to 3.00%, and the five-year LPR from 3.60% to 3.50%. Given Australia’s deep trade ties with China, any monetary easing in China weakens the Aussie through reduced export demand expectations.
Moreover, political instability in Australia also weighed on the AUD. The National Party withdrew from its coalition with the Liberal Party, leaving the opposition fractured. Meanwhile, the Labor Party regained power with a broader mandate, creating uncertainty in the short term. Markets typically avoid currencies tied to political volatility.
Traders are watching the upcoming Reserve Bank of Australia (RBA) decision. Despite strong April employment data showing an 89,000 increase, the market expects a 25 basis point rate cut. Expectations for easing may further undermine the Australian Dollar, especially if the central bank shifts to a dovish tone.

US Dollar Weakness Supports AUD/USD and Caps USD/JPY Gains
The AUD/USD pair strengthened on Monday due to broad US dollar weakness. Moody’s downgraded the US credit rating from Aaa to Aa1. The agency expects US federal debt to rise to 134% of GDP by 2035, from 98% in 2023, and the budget deficit to widen to 9%. Rising debt-servicing costs and weaker tax revenues are adding long-term pressure on the US dollar.
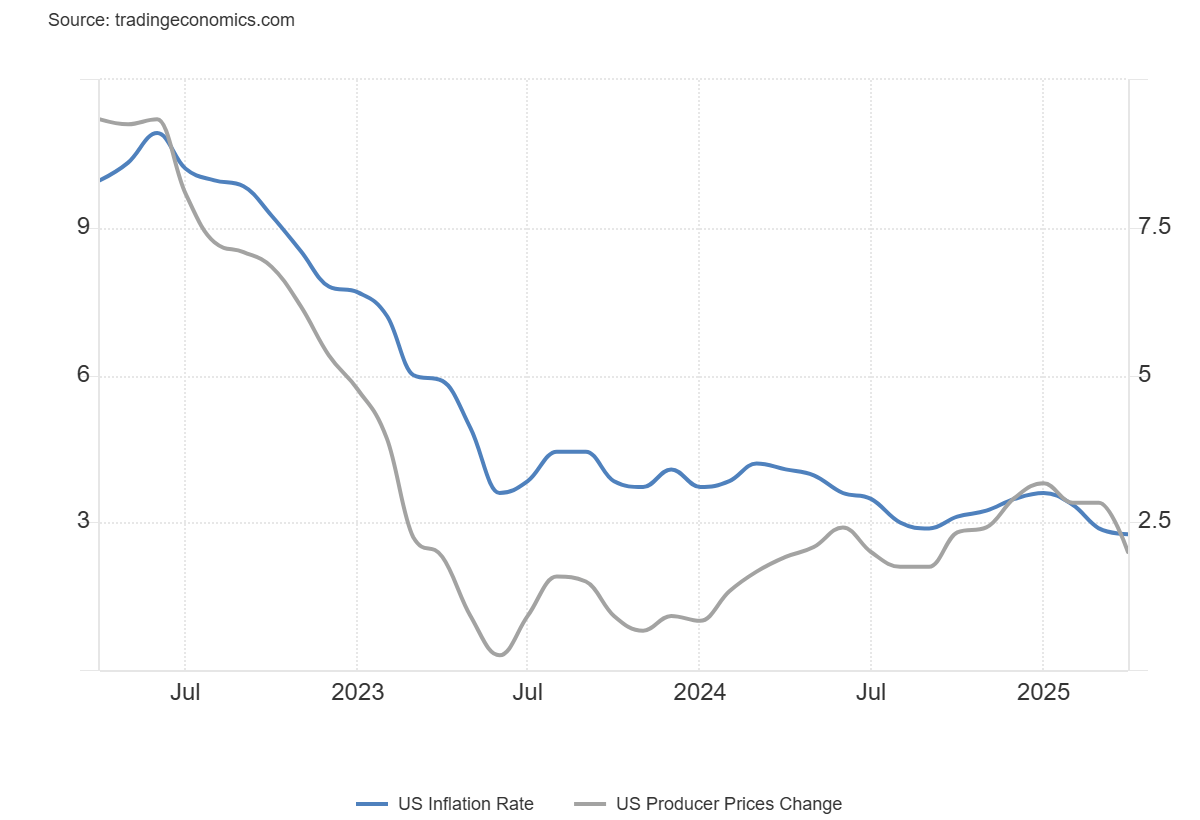
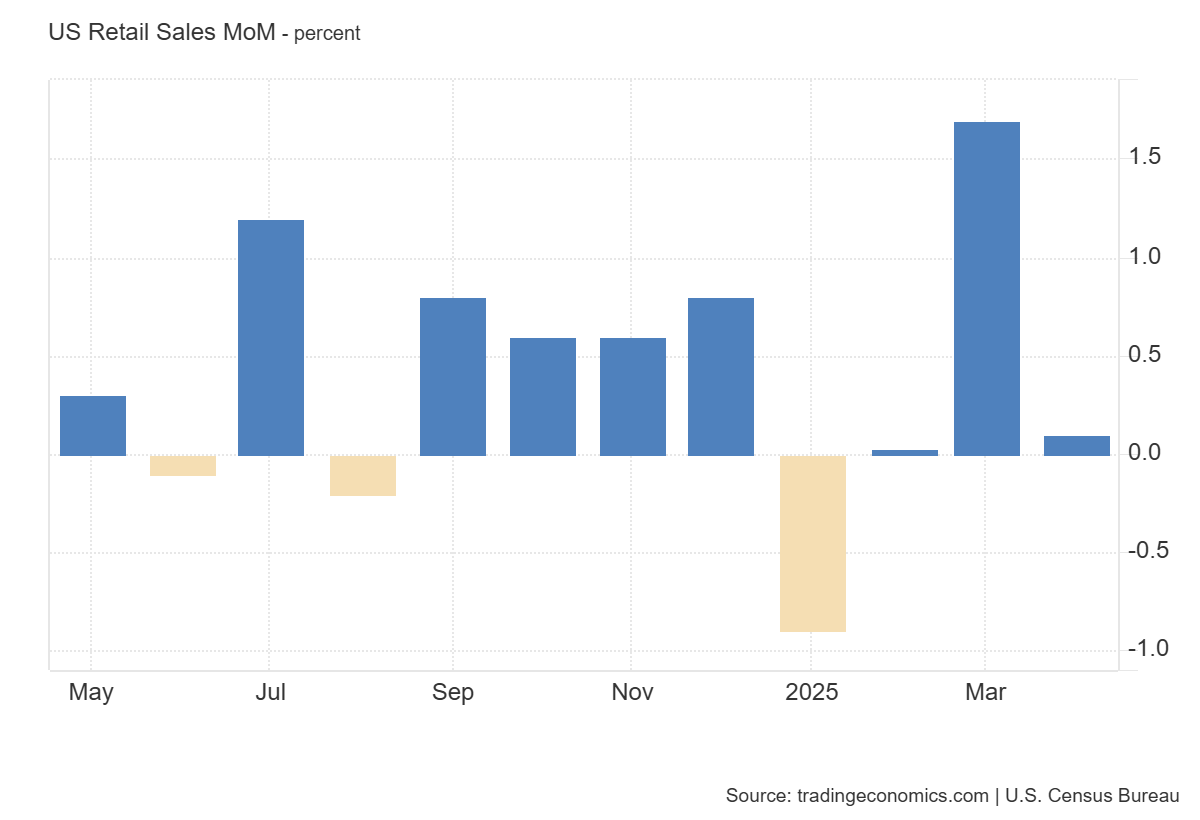
The US Dollar Index (DXY) trades near 100.40, showing strong bearish pressure. Moreover, the easing inflation in recent CPI and PPI data, along with disappointing retail sales, increases the chances of rate cuts by the Fed in 2025. This macro backdrop weakens the USD and gives room for AUD/USD to recover, despite mixed fundamentals.
However, the AUD struggles to capitalize fully, as US-China tensions continue to evolve. President Trump has vowed to impose tariffs on uncooperative trade partners. The entity list expansion targeting Chinese chipmakers adds more complexity. China’s economic data showed April retail sales rising just 5.1% year-over-year, falling short of expectations. Industrial production grew 6.1%, but this marked a slowdown from March. These mixed signals keep risk sentiment in check.
Meanwhile, USD/JPY remains capped as the weaker US dollar restricts gains. Despite higher US yields, USD/JPY failed to push decisively higher. The uncertainty over further US sanctions on China and export restrictions adds to the downside risk.
AUD/USD Technical Analysis – Ascending Broadening Wedge Pattern
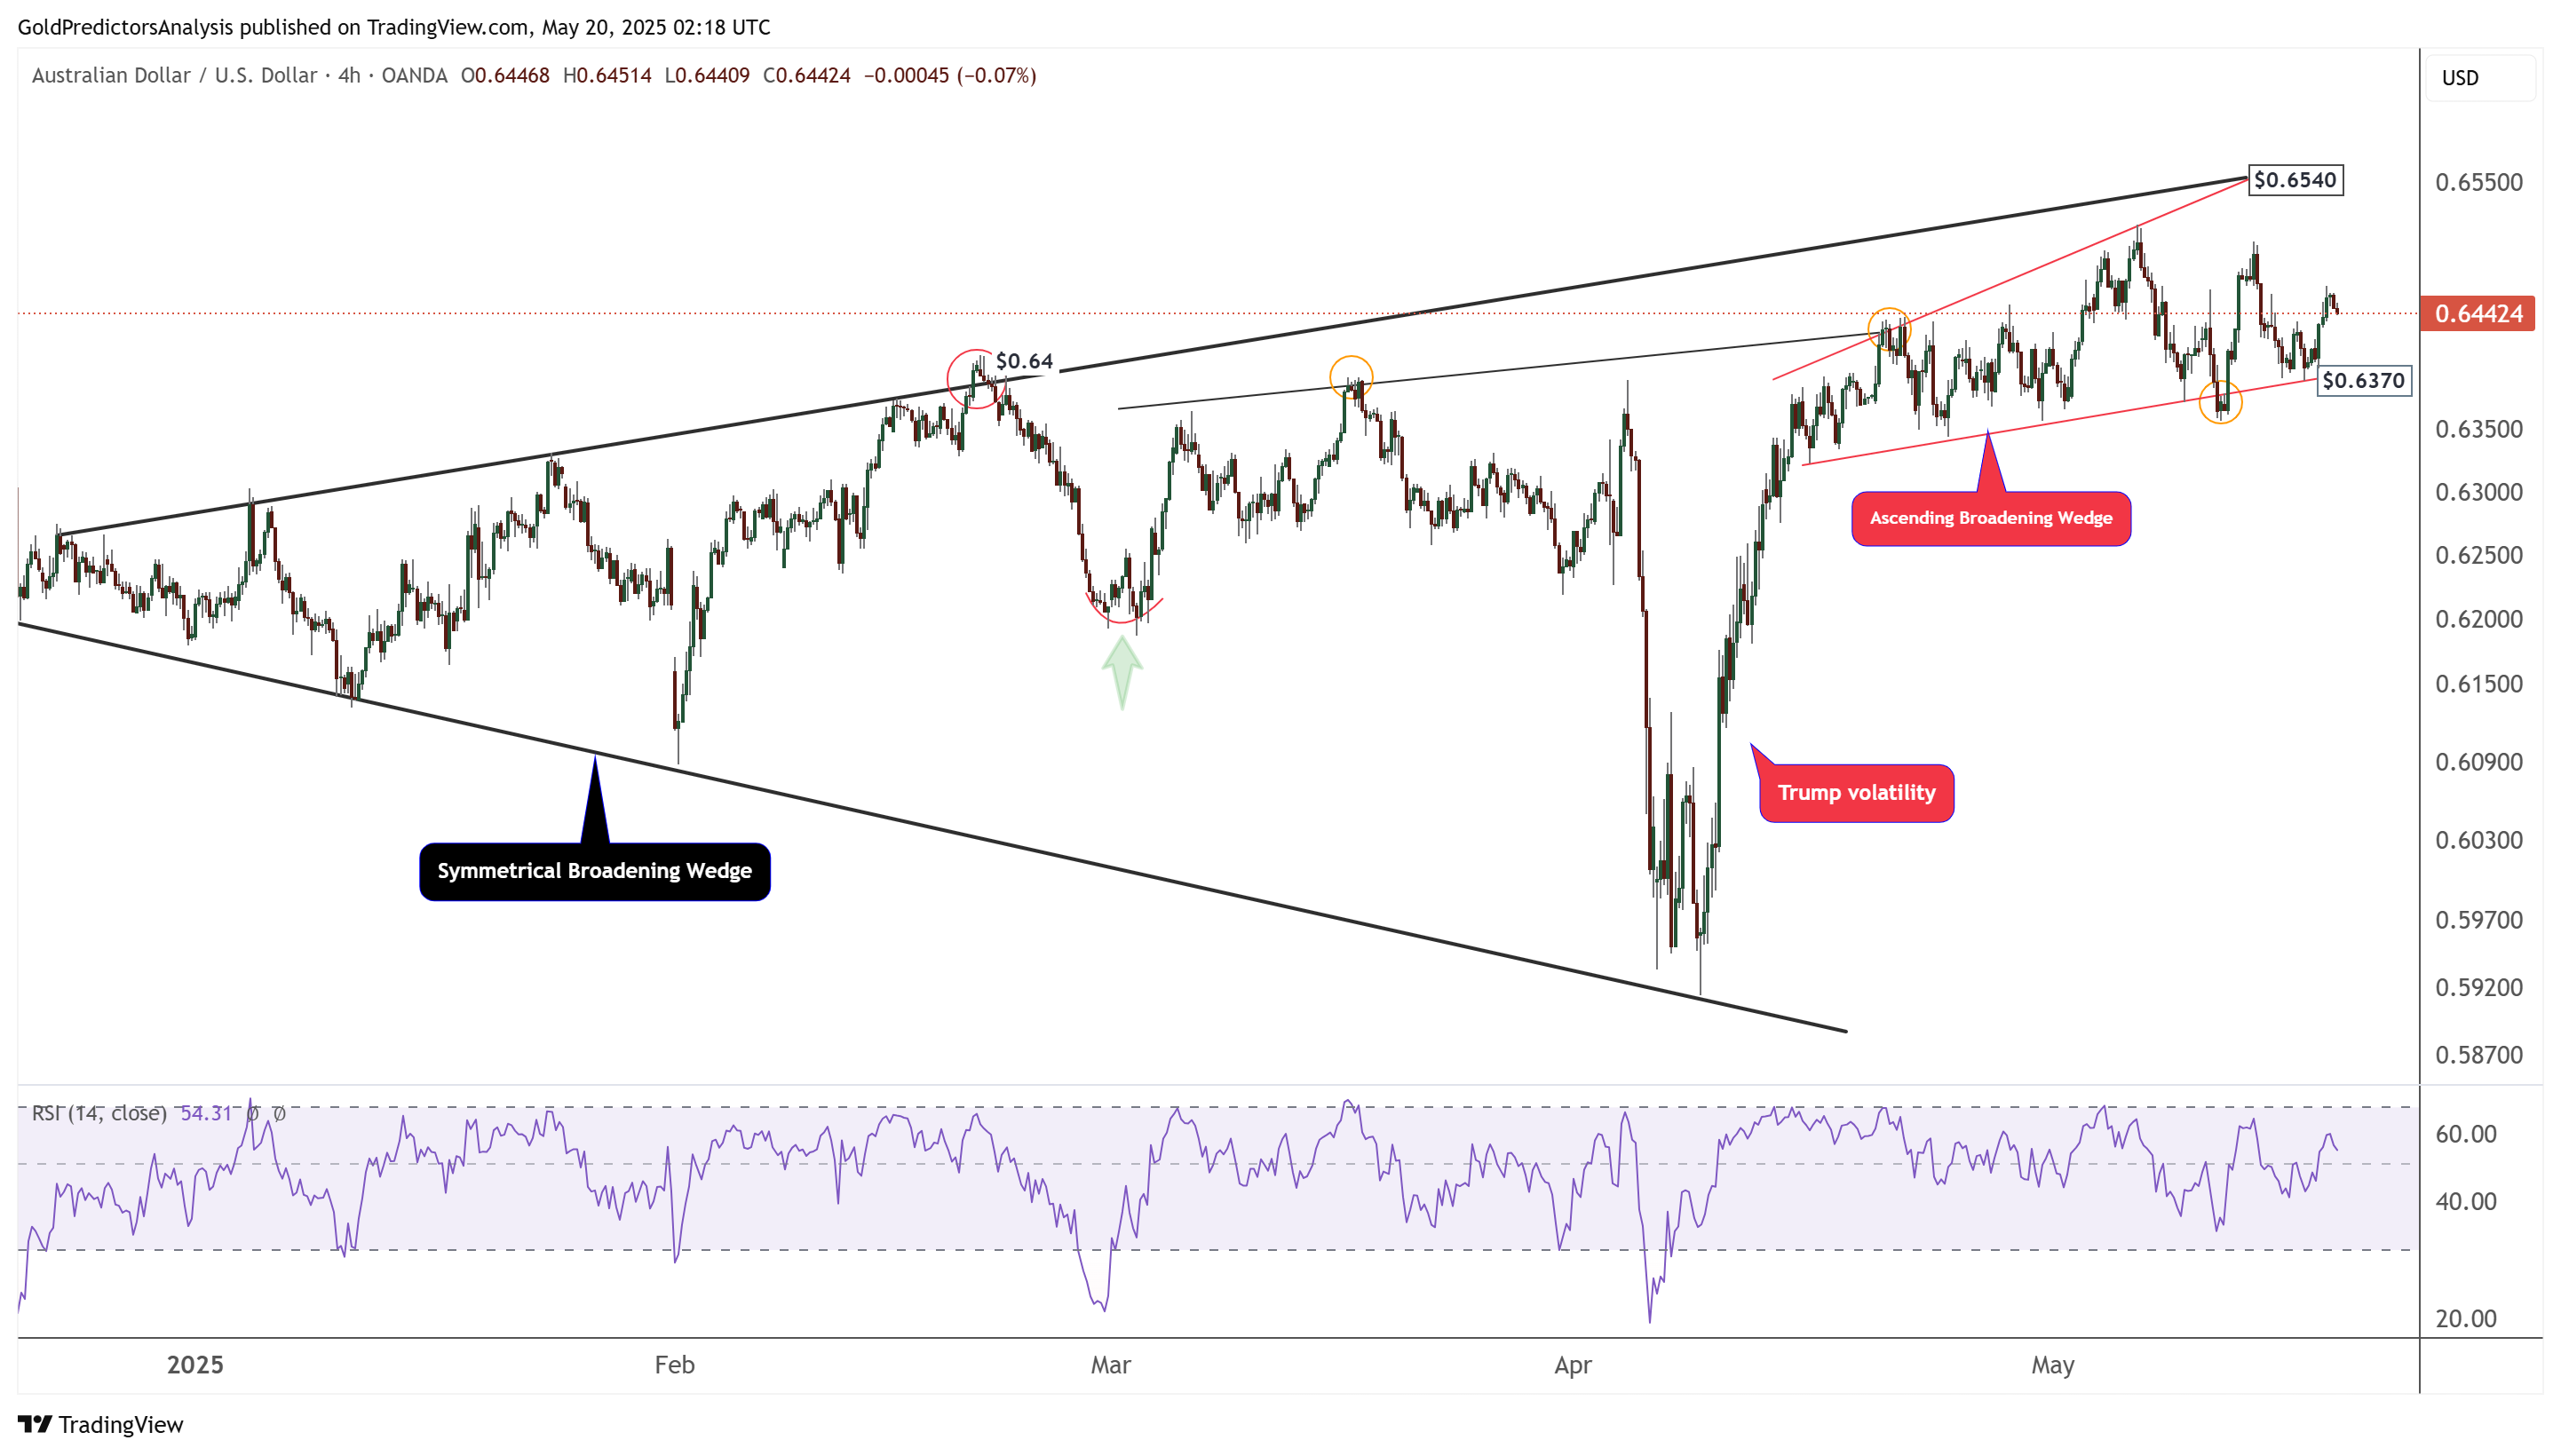
The 4-hour chart for AUD/USD shows that the price is consolidating within an ascending broadening wedge. This wedge has formed inside a larger symmetrical broadening wedge and highlights strong resistance at $0.6540. The current trading range for AUD/USD is between $0.6370 and $0.6540. A breakout above or below this range will define the next directional move in the pair.
NZD/USD Technical Analysis – Consolidation
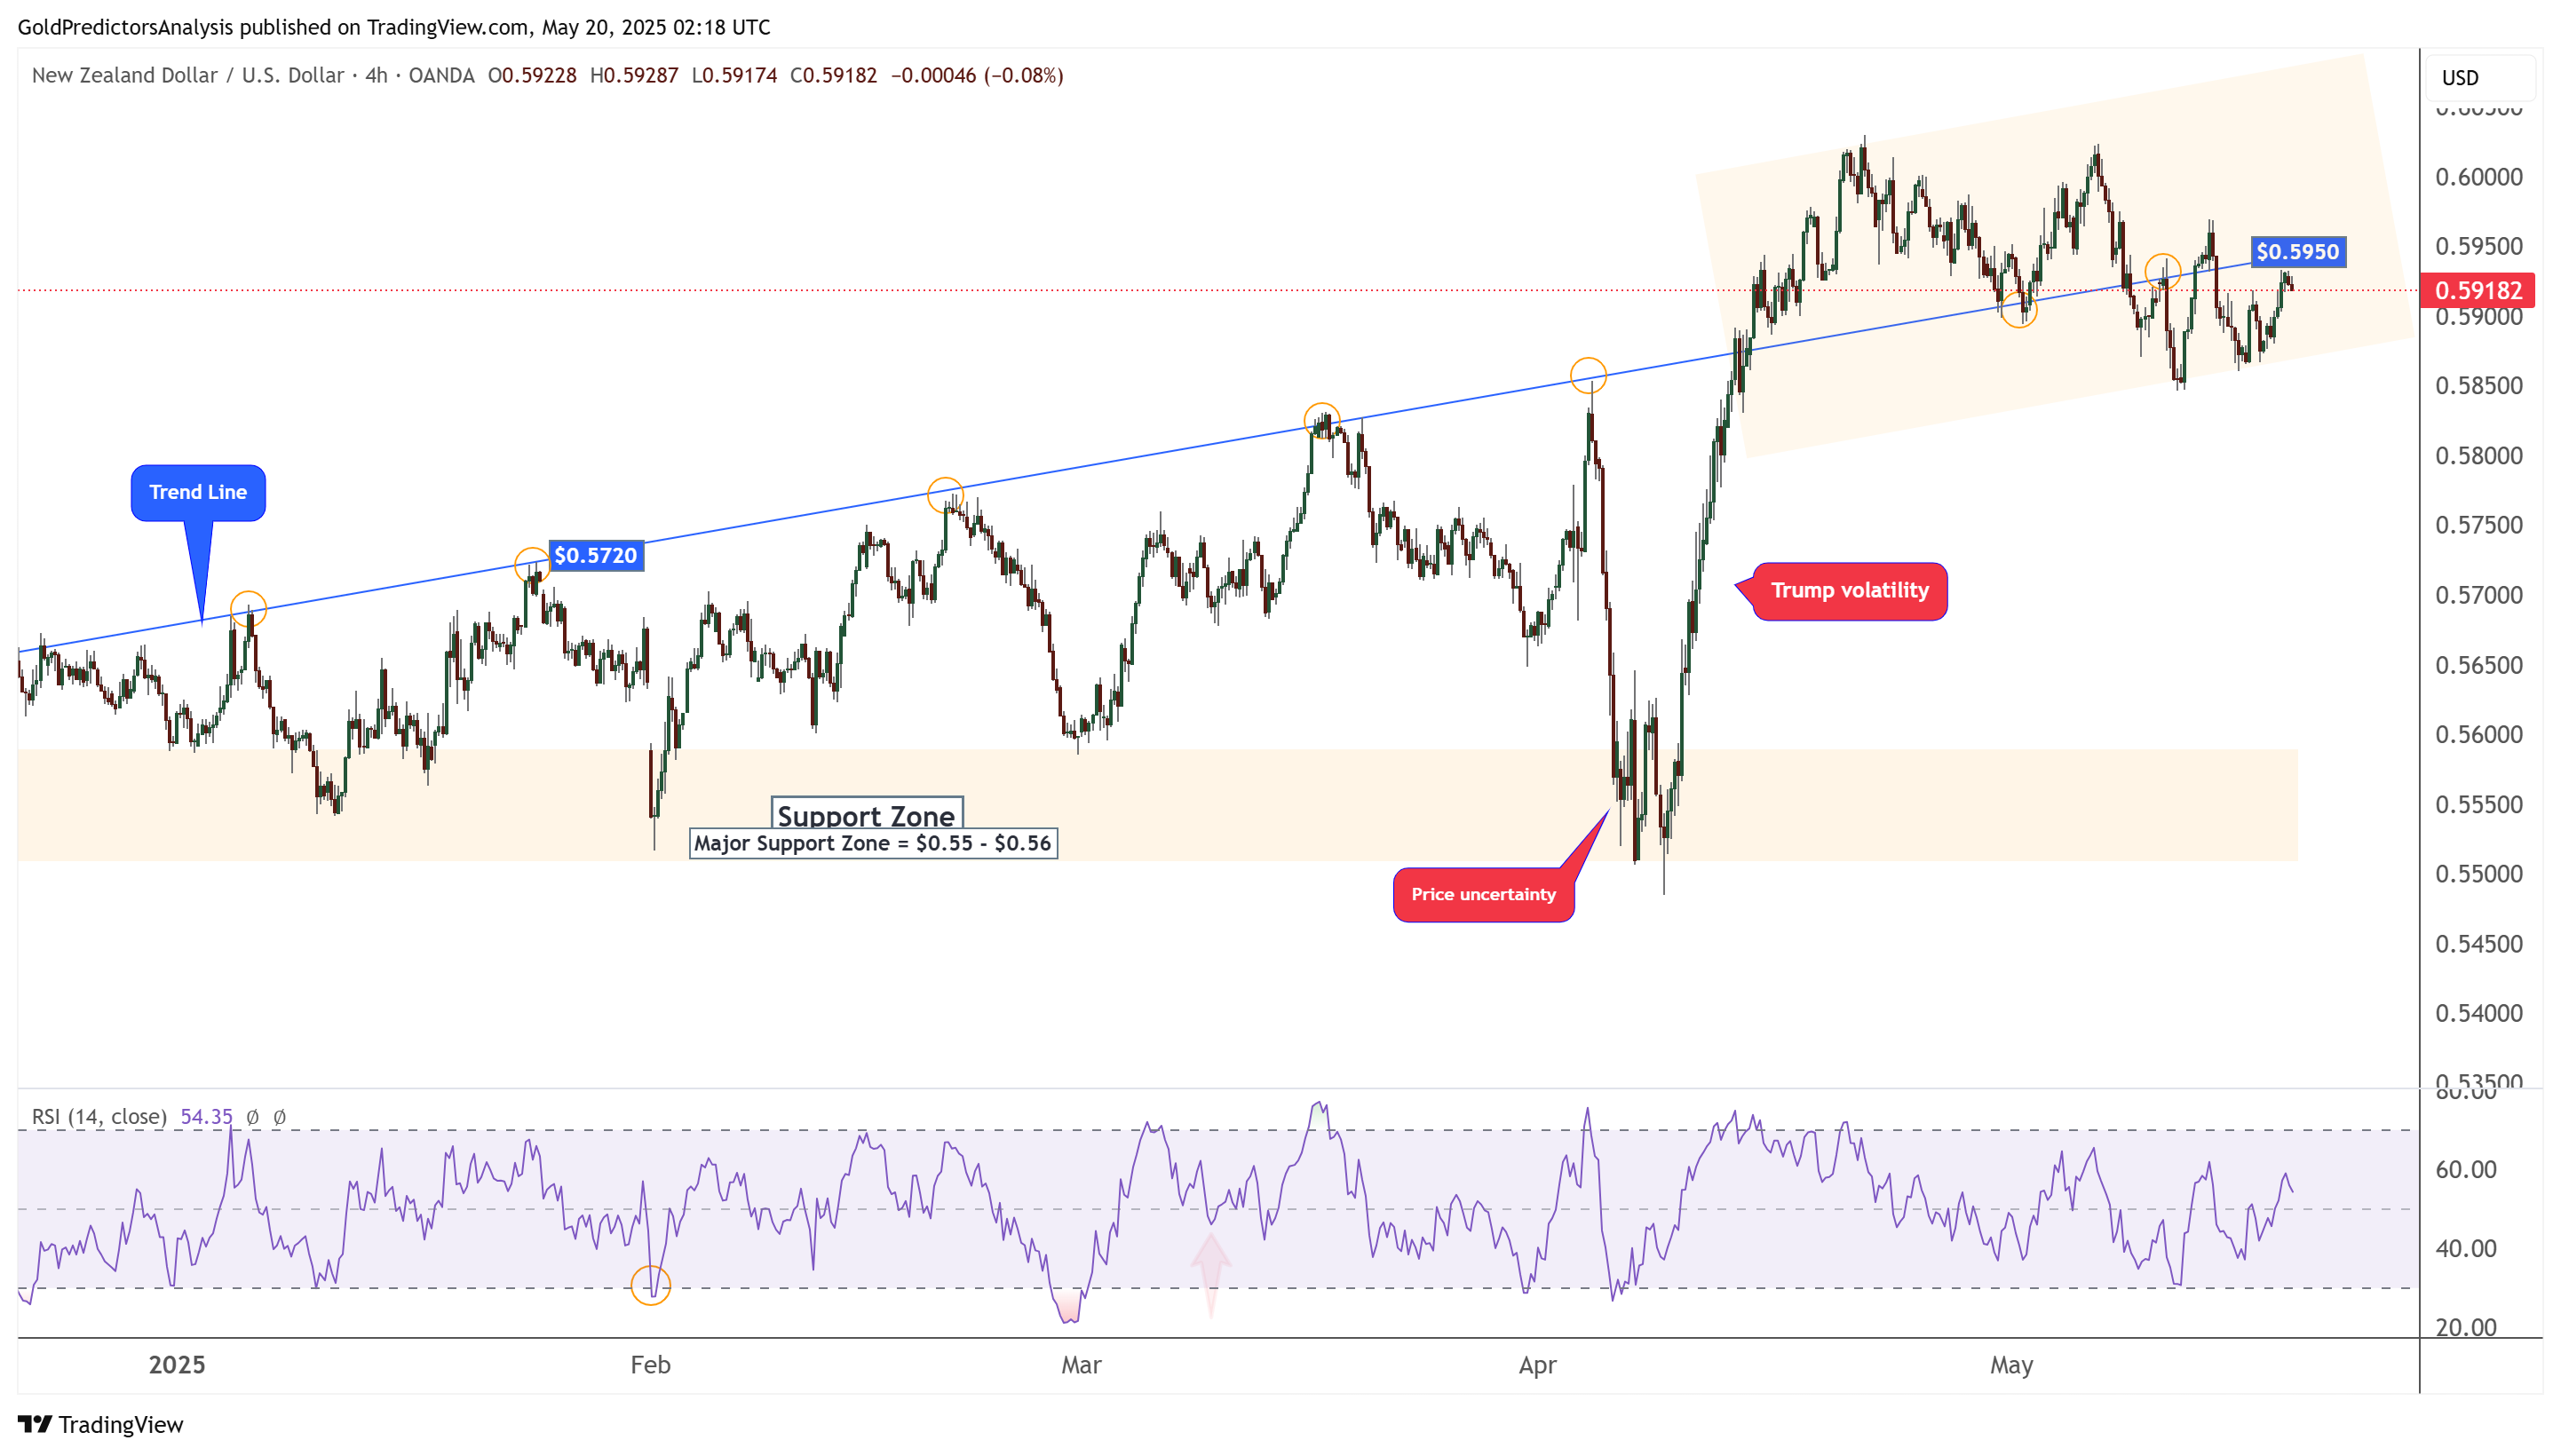
The 4-hour chart for NZD/USD also shows strong bullish momentum. The price is consolidating within a range-bound market, marked by the orange zone area. Recent consolidation is occurring around the blue trendline near the $0.5950 level. Since the price rebounded from the long-term support zone between $0.55 and $0.56, the upward momentum is likely to continue.
USD/JPY Technical Analysis – Descending Broadening Wedge
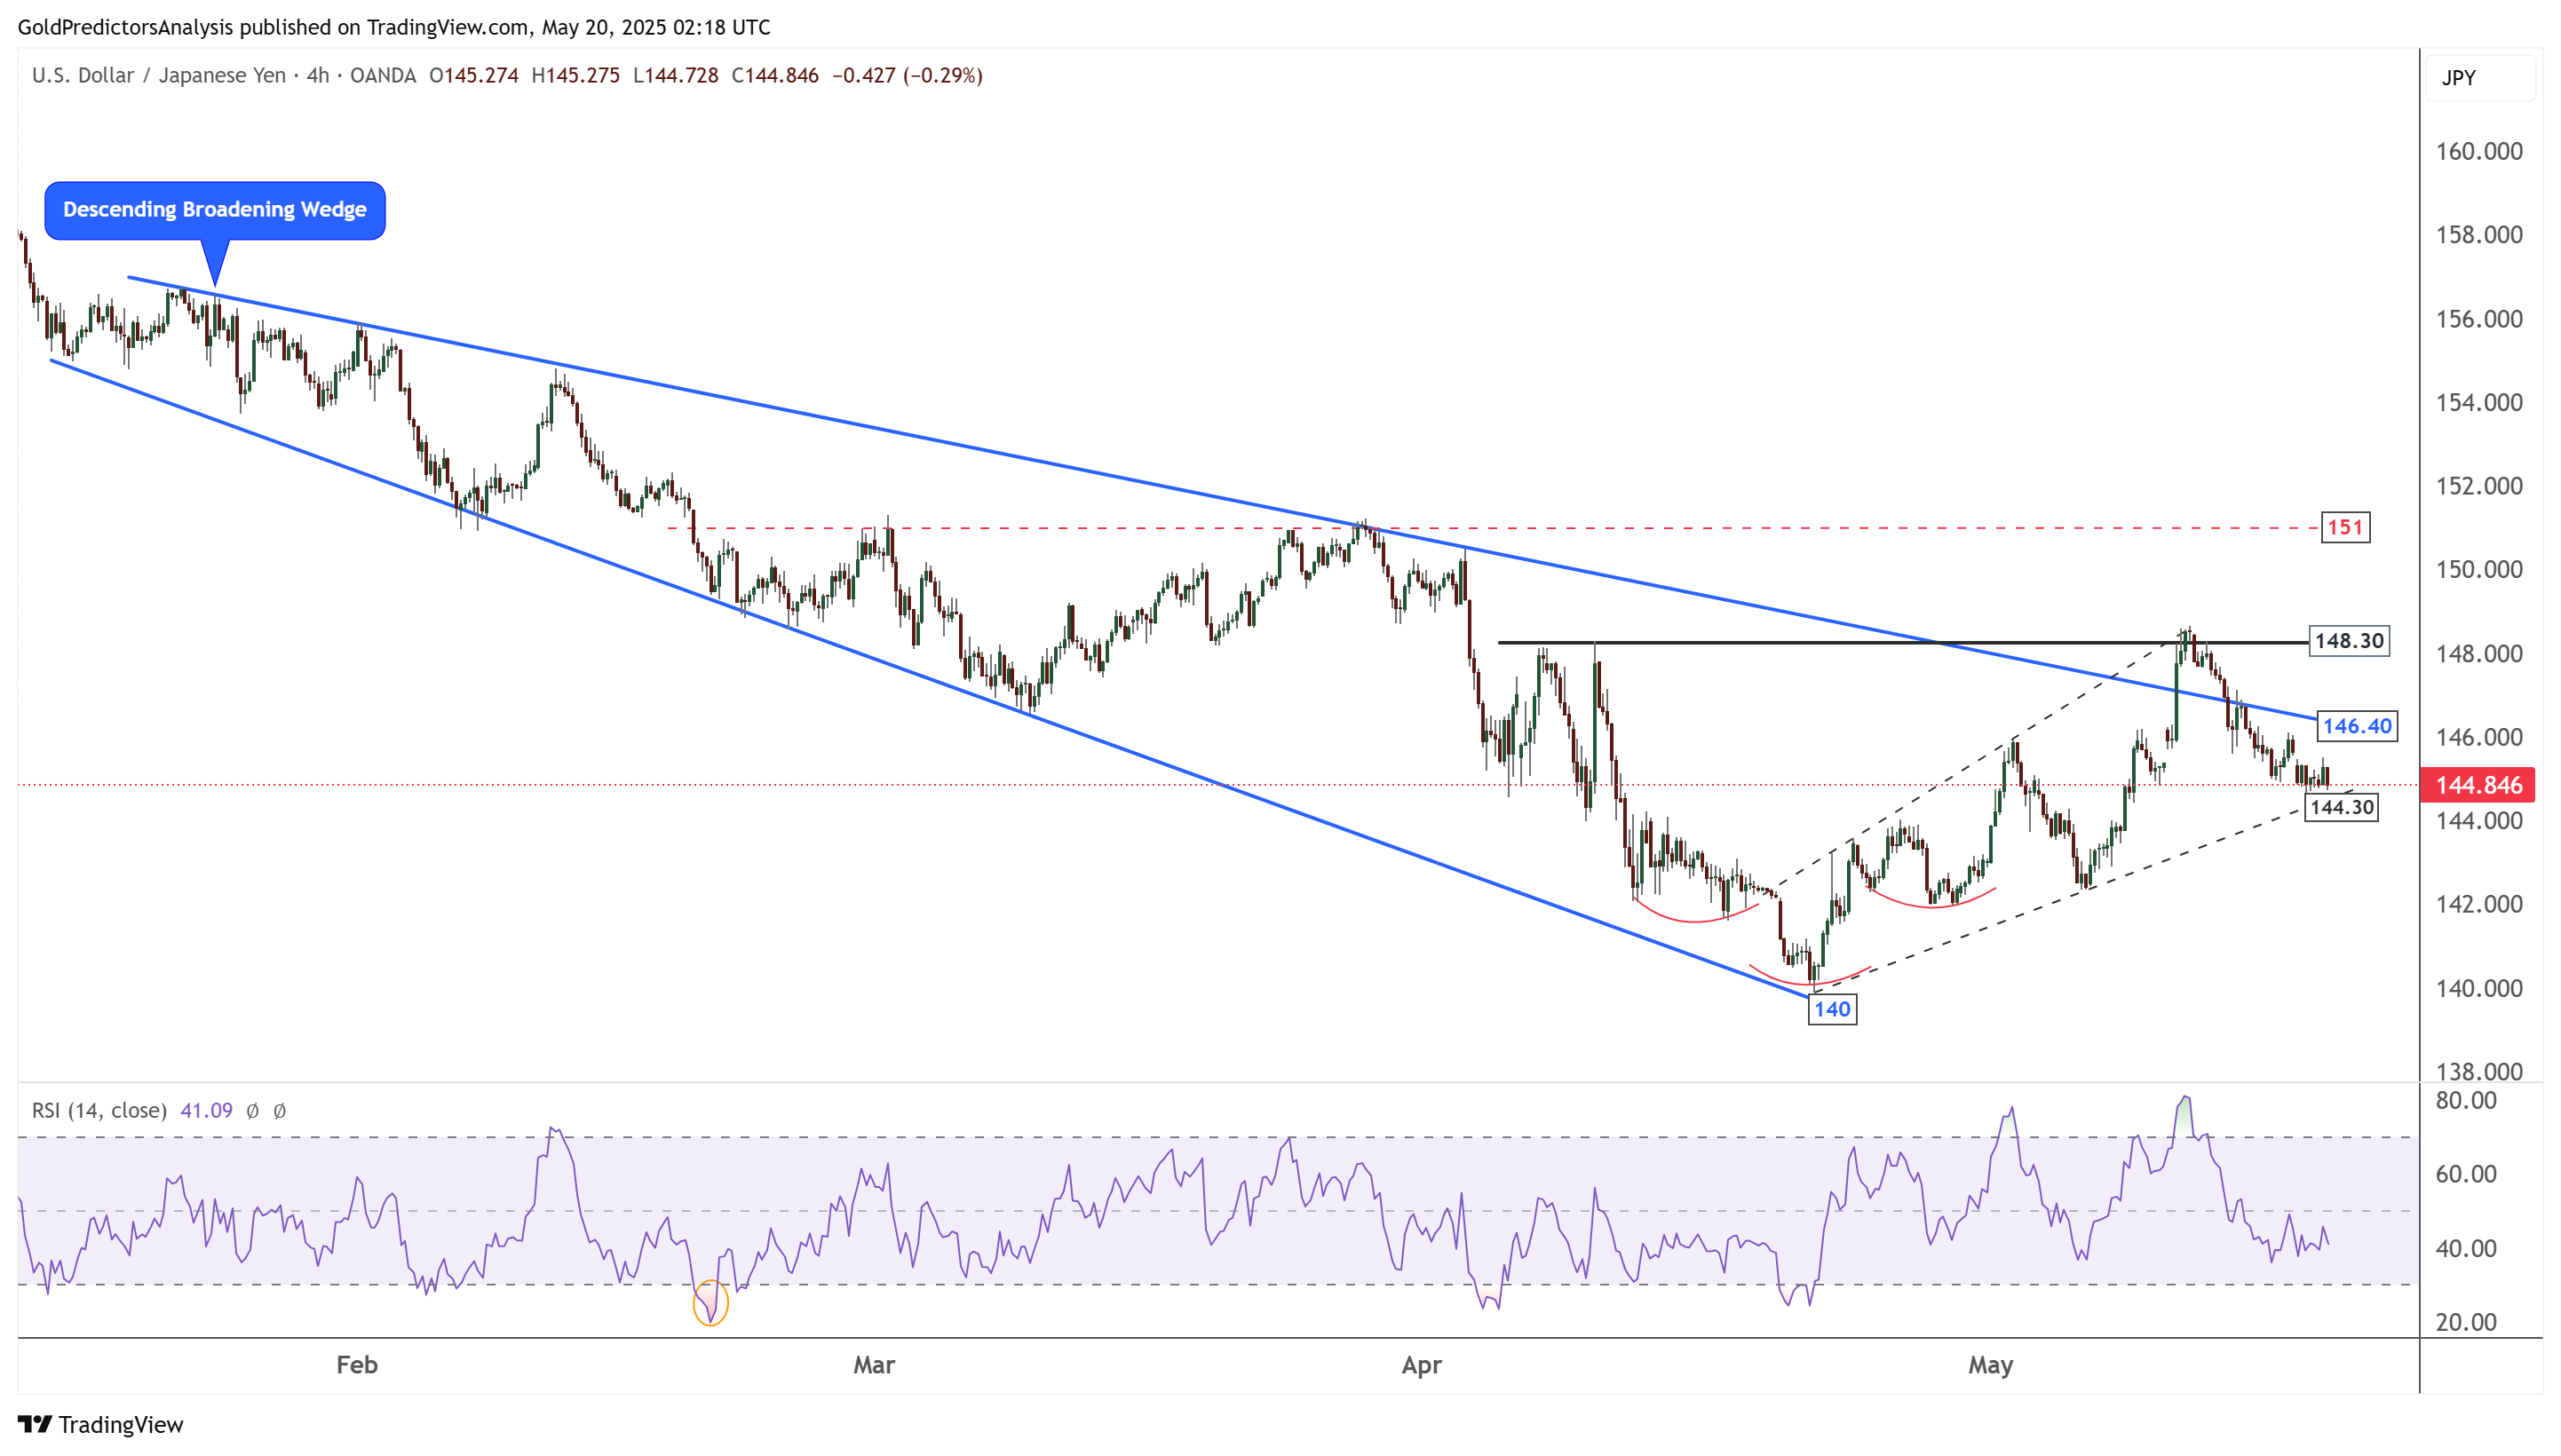
The 4-hour chart for USD/JPY shows that the price failed to break above the 148.30 level. After this failure, the pair moved into a blue descending broadening wedge pattern. Within this larger structure, an ascending broadening wedge has also formed. If the price breaks above 148.30, the next move could target the 151 level. However, ongoing weakness in the US Dollar Index keeps USD/JPY in a bearish trend. The current price action reflects persistent bearish pressure on the pair.
About the Author
Bob MasonChief Crypto Boss
123456789 30 He has written extensively for a broader audience and his current focus is on developments relating to the financial markets including, but not limited to currencies, commodities, alternative asset classes, and global equities.


Advertisement