
Advertisement
Advertisement
AUD/USD, NZD/USD, and USD/JPY: US Tariffs Shake Forex Markets
By:
Key Points:
- AUD/USD remains under bearish pressure and falls below a long-term support region.
- NZD/USD forms a symmetrical broadening wedge pattern, indicating strong volatility.
- USD/JPY trades within a descending channel and exhibits strong volatility.

The Australian Dollar (AUD) dropped sharply last week and remains in a strong bearish trend. This decline followed US President Donald Trump’s announcement of new tariffs on China, Canada, and Mexico. Since China is Australia’s largest trading partner, the US tariffs on Chinese exports have indirectly impacted the Australian economy.
US Tariffs and Their Ripple Effect on the Australian Economy
The US government plans to impose a 25% tariff on Canadian and Mexican goods and a 10% tariff on Chinese exports. China’s foreign ministry has warned that such measures could impact future cooperation on drug control efforts.
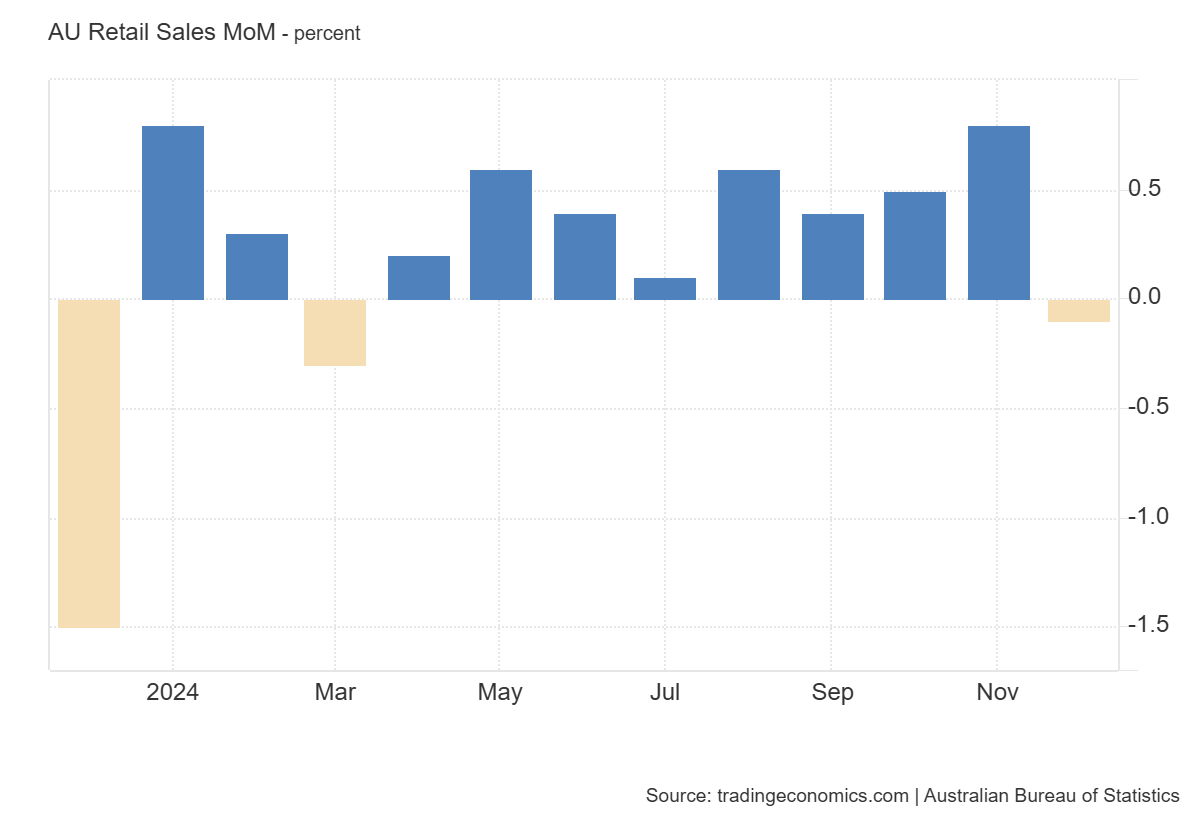
Meanwhile, economic data from Australia indicates weakening consumer demand. The chart below shows retail sales declined by 0.1% month-on-month in December 2024, marking the first drop in nine months. Although the decline was smaller than the expected 0.7% decrease, it raises concerns about household spending. Moreover, China’s Caixin Manufacturing Purchasing Managers’ Index (PMI) dropped to 50.1 in January, down from 50.5 in December. The weakening PMI suggests slower manufacturing activity, which could further impact Australia’s export-driven economy.
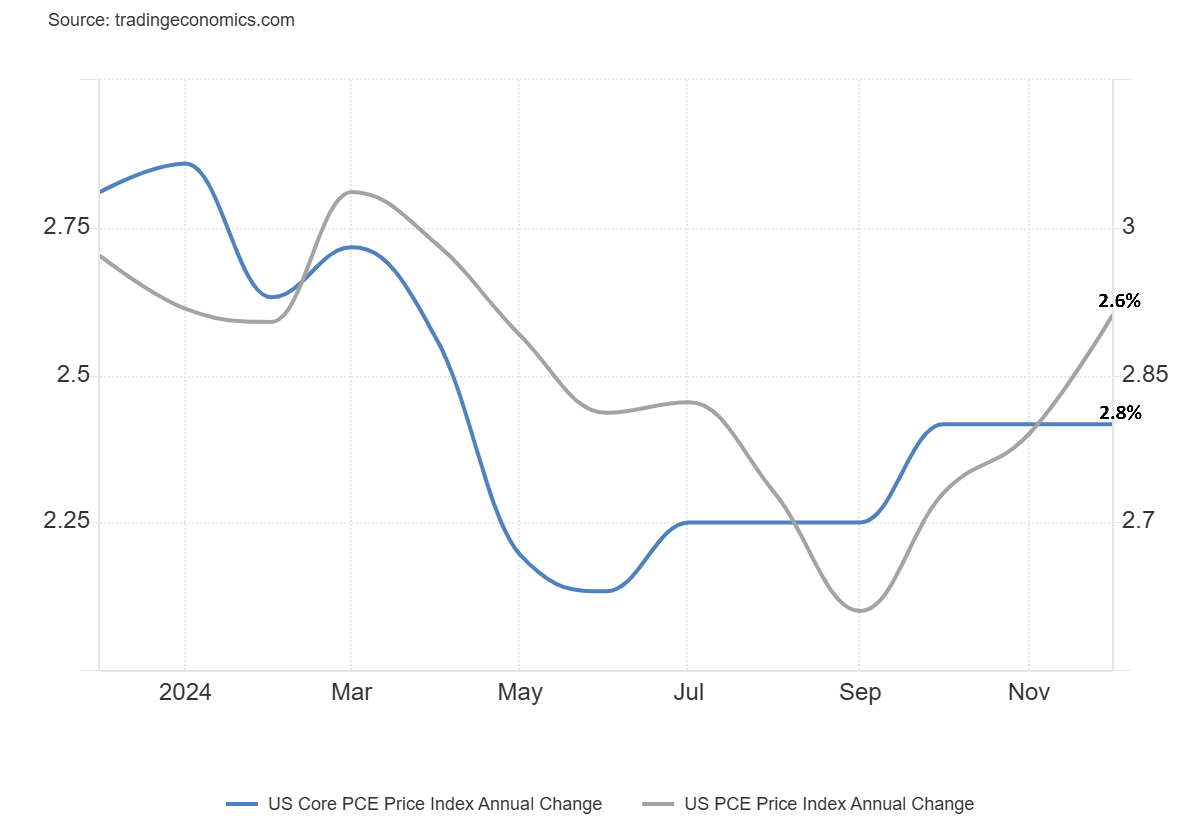
On the other hand, the US Dollar continues to show strong volatility. The US Dollar Index extended its gains on Monday, reaching 109.80, then dropping lower. The US Personal Consumption Expenditures (PCE) Price Index rose by 0.3% month-on-month in December, up from 0.1% in November. PCE inflation climbed to 2.6%, while core PCE inflation remained steady at 2.8% year-over-year, as shown in the chart below.
Similarly, US labor market data remains mixed. Initial jobless claims for the week ending January 24 came in at 207,000, better than the expected 220,000 and lower than the previous week’s 223,000. Federal Reserve Chair Jerome Powell emphasized that any policy adjustments would require “real progress on inflation or some weakness in the labor market.” The tariff imposed by President Trump could be inflationary and further strengthen the US Dollar, which may contribute to the weakening of the Australian Dollar. Additionally, President Trump has threatened to impose 100% tariffs on BRICS nations if they introduce an alternative currency to challenge the dominance of the US Dollar in global trade.
US Tariffs Drive Volatility in USD/JPY
The strong momentum in the US Dollar Index has helped the USD/JPY pair extend its gains. However, as the US dollar dropped, the pair failed in the resistance area. Meanwhile, Japan’s Finance Minister Katsunobu Kato stated that the government is closely monitoring the impact of new US tariffs on the yen. The Bank of Japan (BoJ) released its Summary of Opinions, indicating discussions on potential rate hikes. However, despite policymakers’ willingness to raise rates if economic conditions permit, the yen continues to struggle for support.
Japan’s Economy Minister Ryosei Akazawa reaffirmed the government’s commitment to achieving the Bank of Japan’s (BoJ) 2% inflation target. Officials are implementing measures to ease the burden of rising living costs. The US-Japan yield differential remains near a multi-week low, which could help limit further yen depreciation.
Additionally, risk-off sentiment may provide some support to the Japanese currency. Traders are now focused on key US economic data, including the JOLTS job openings and the Nonfarm Payrolls (NFP) report. These reports will be critical in shaping the next moves in the USD/JPY.
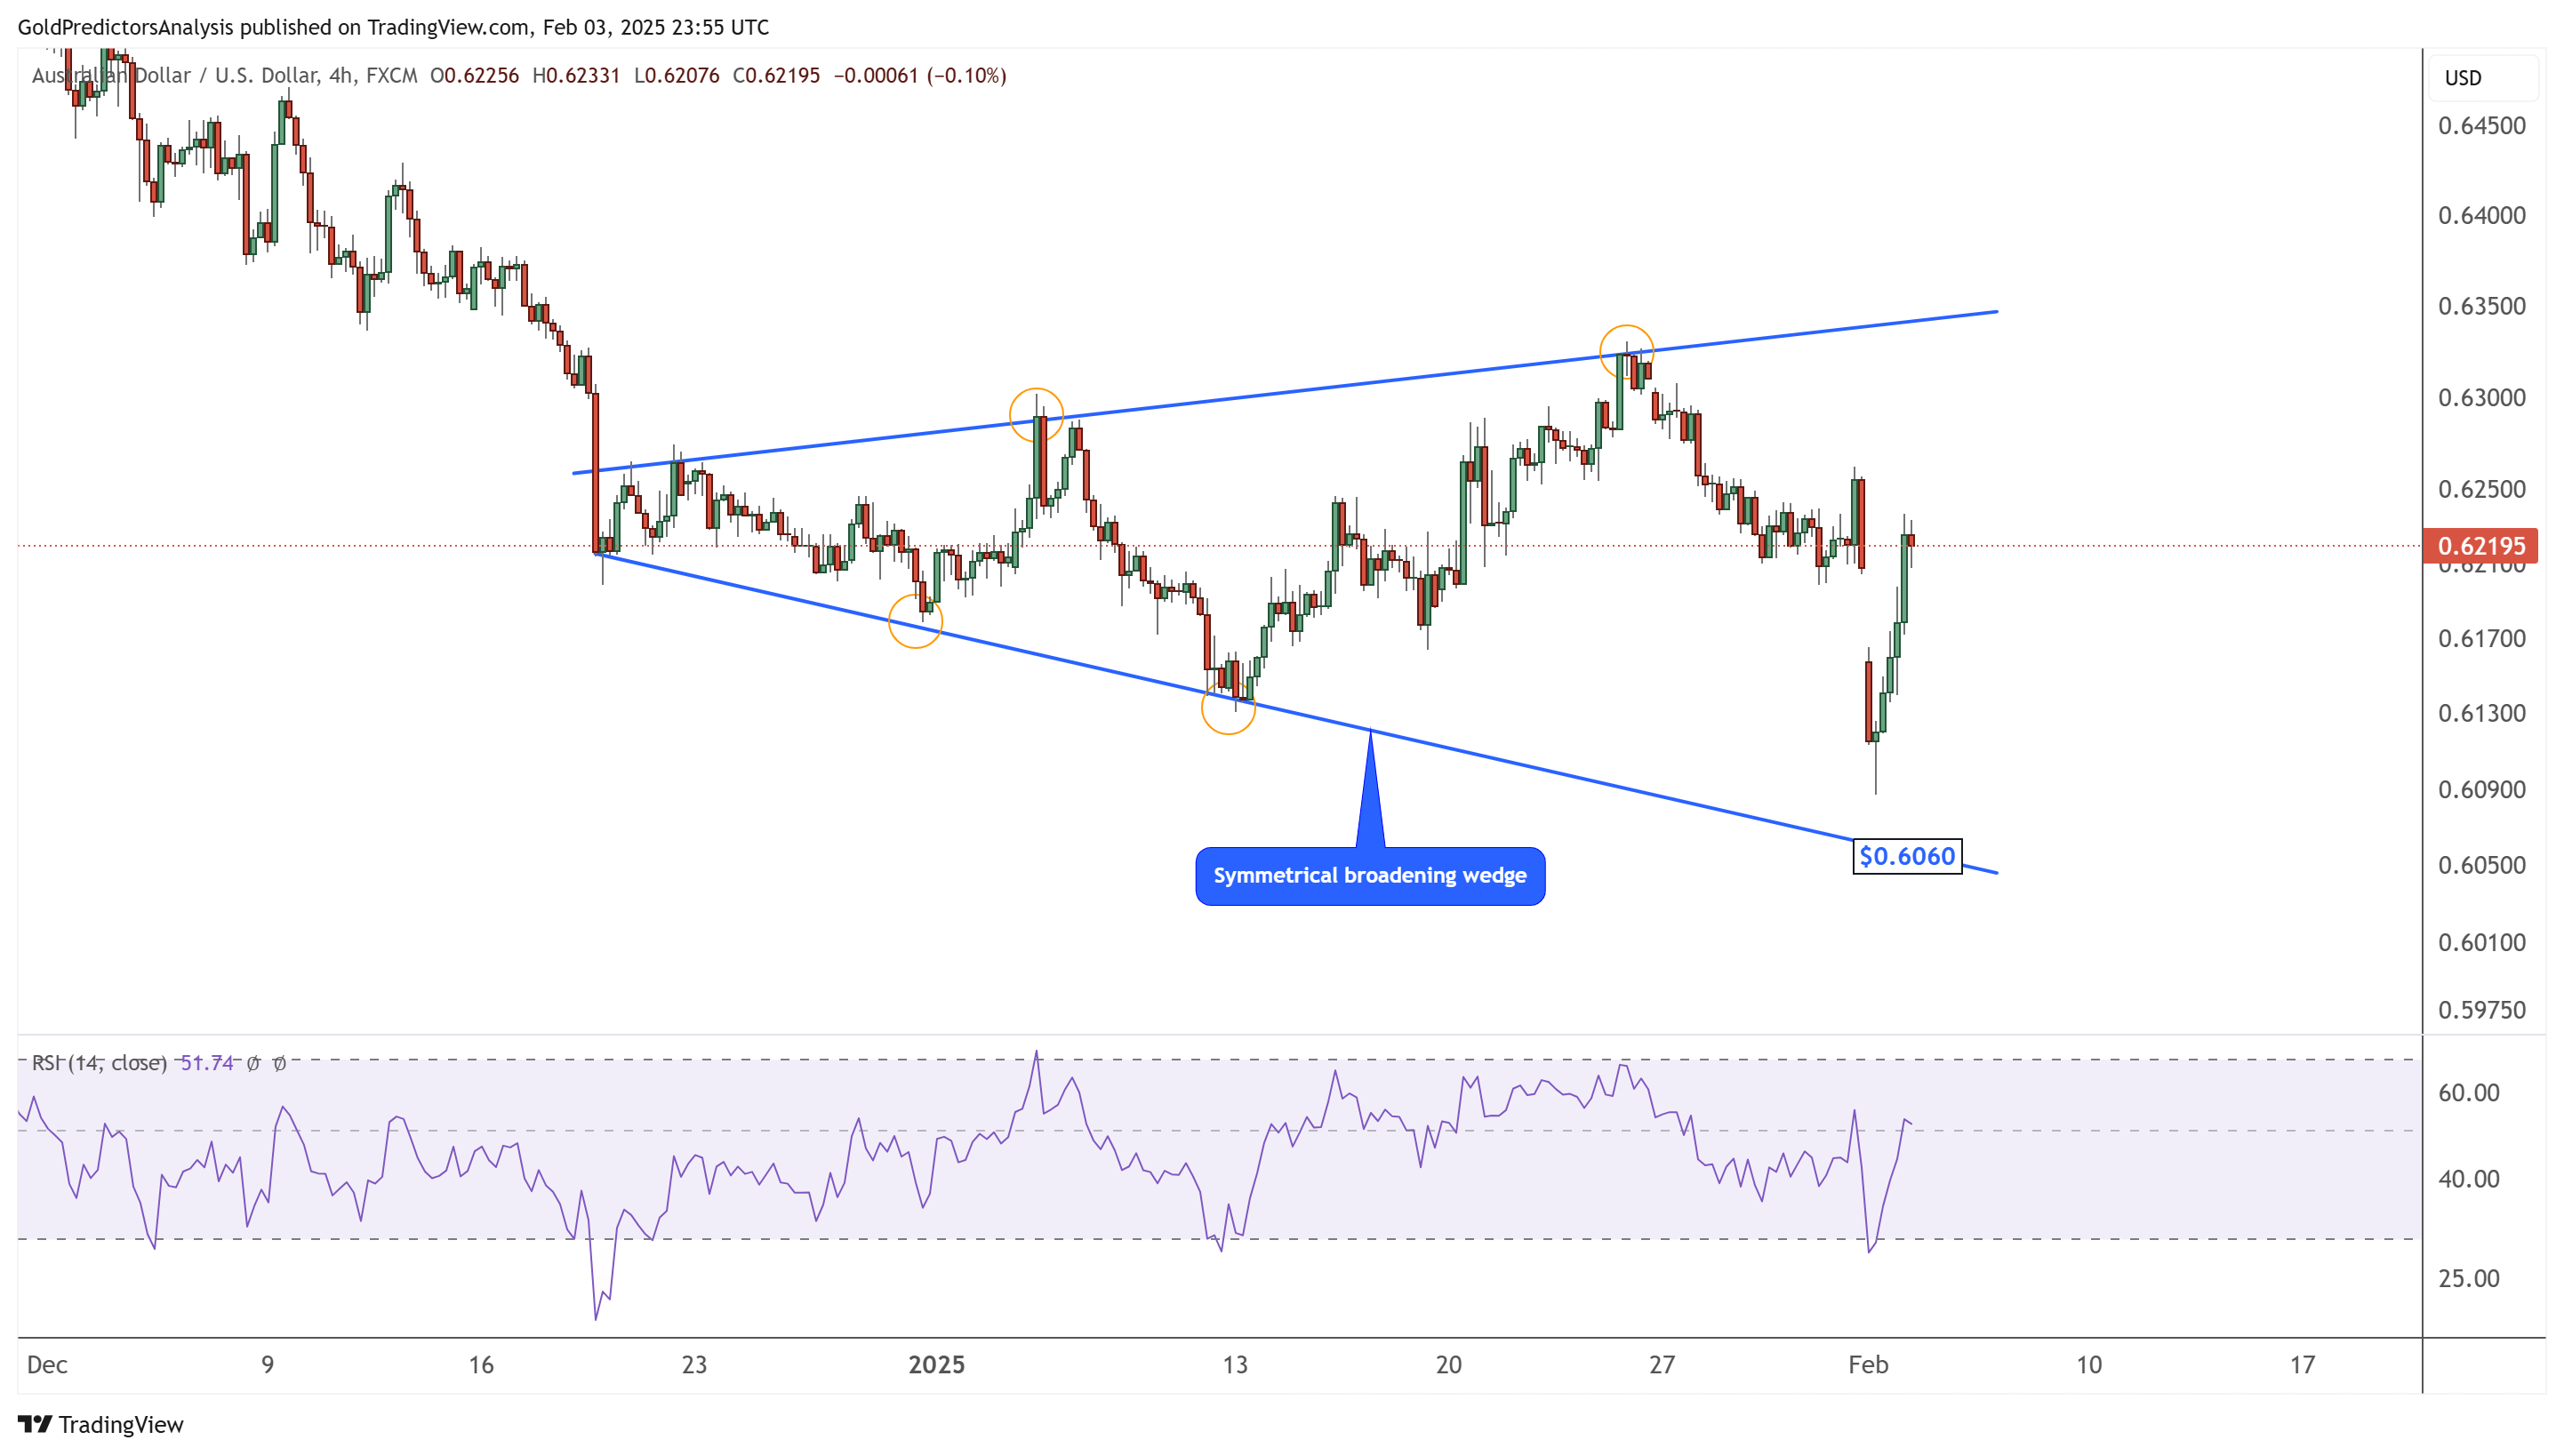
AUD/USD Analysis – Symmetrical Broadening Wedge
The 4-hour chart for AUD/USD shows that the pair is trading within a symmetrical broadening wedge, indicating strong volatility. The price hit this wedge’s $0.6330 resistance line before reversing lower. At the lower boundary of the wedge, a strong support level lies around $0.6060, which is considered a long-term support zone. The tariffs imposed on China have weakened the currency pair, adding further pressure and indicating a high likelihood of continued bearish momentum.
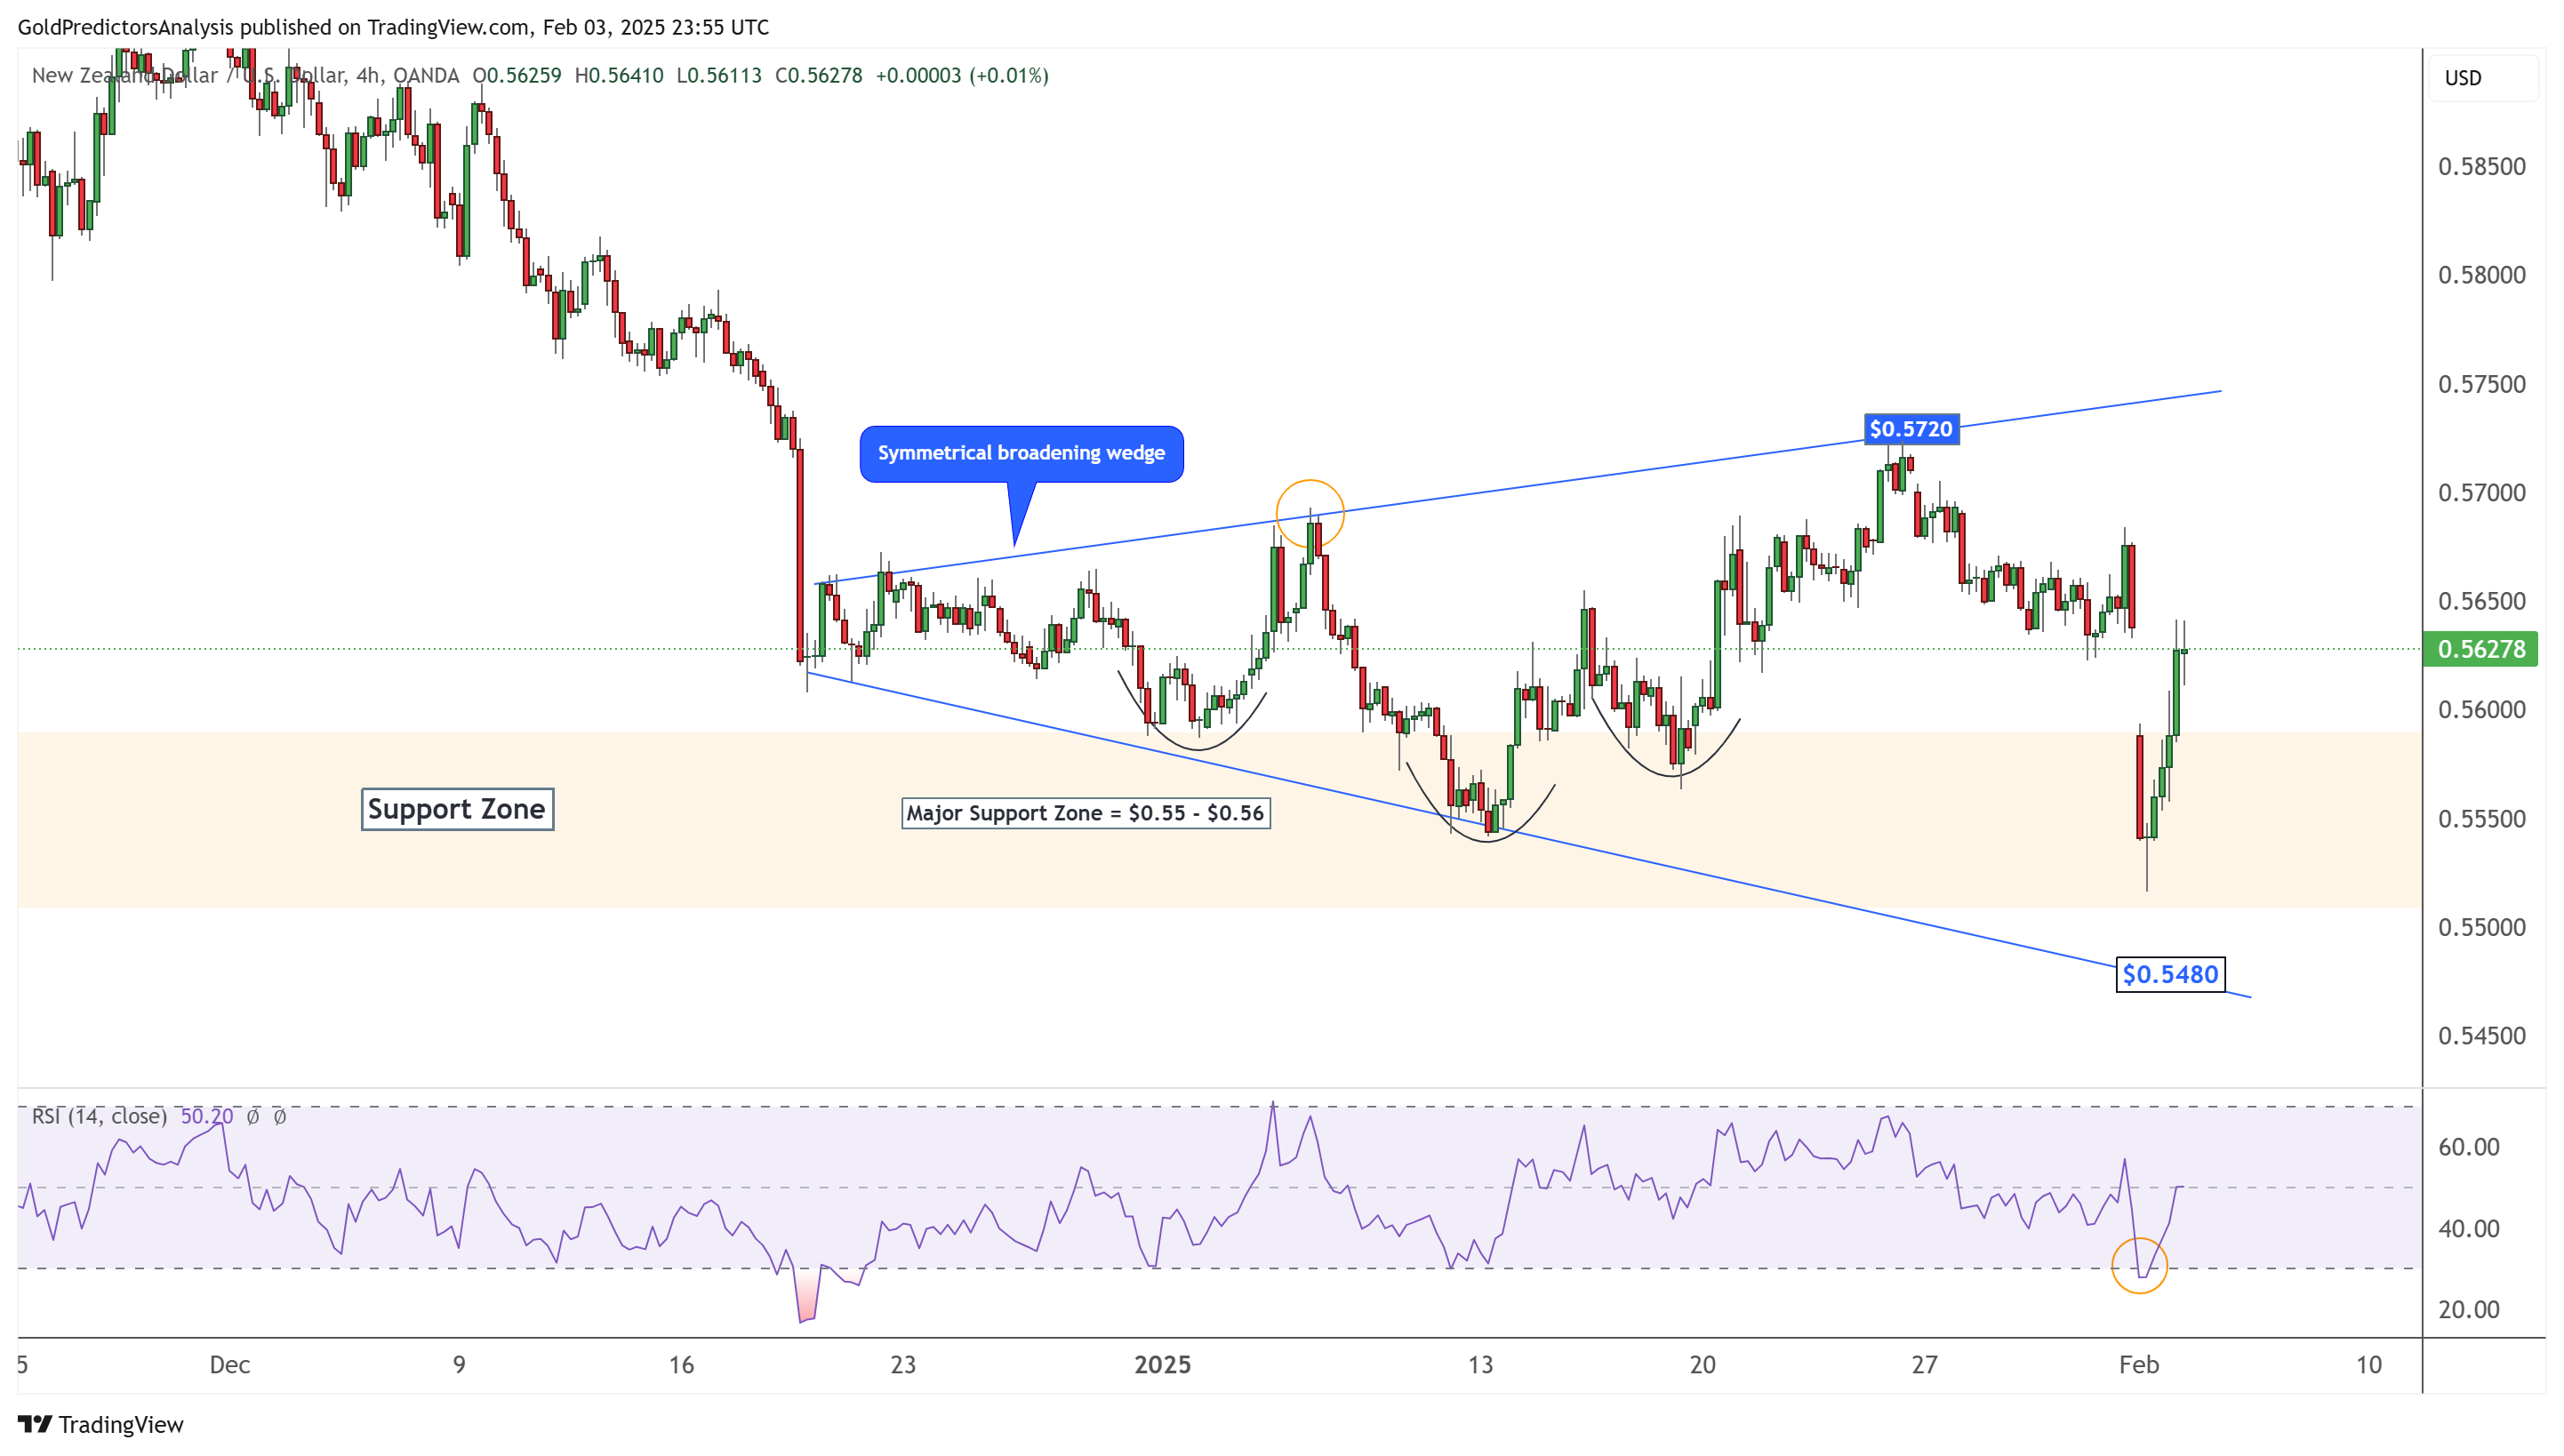
NZD/USD Analysis – Symmetrical Broadening Wedge
The 4-hour chart for NZD/USD shows that the pair is experiencing strong volatility within a symmetrical broadening wedge, with boundaries at $0.5720 and $0.5480. However, the $0.55 to $0.56 range, highlighted by the orange zone in the chart below, remains a long-term support zone. The pair will likely remain volatile due to ongoing tariff tensions.
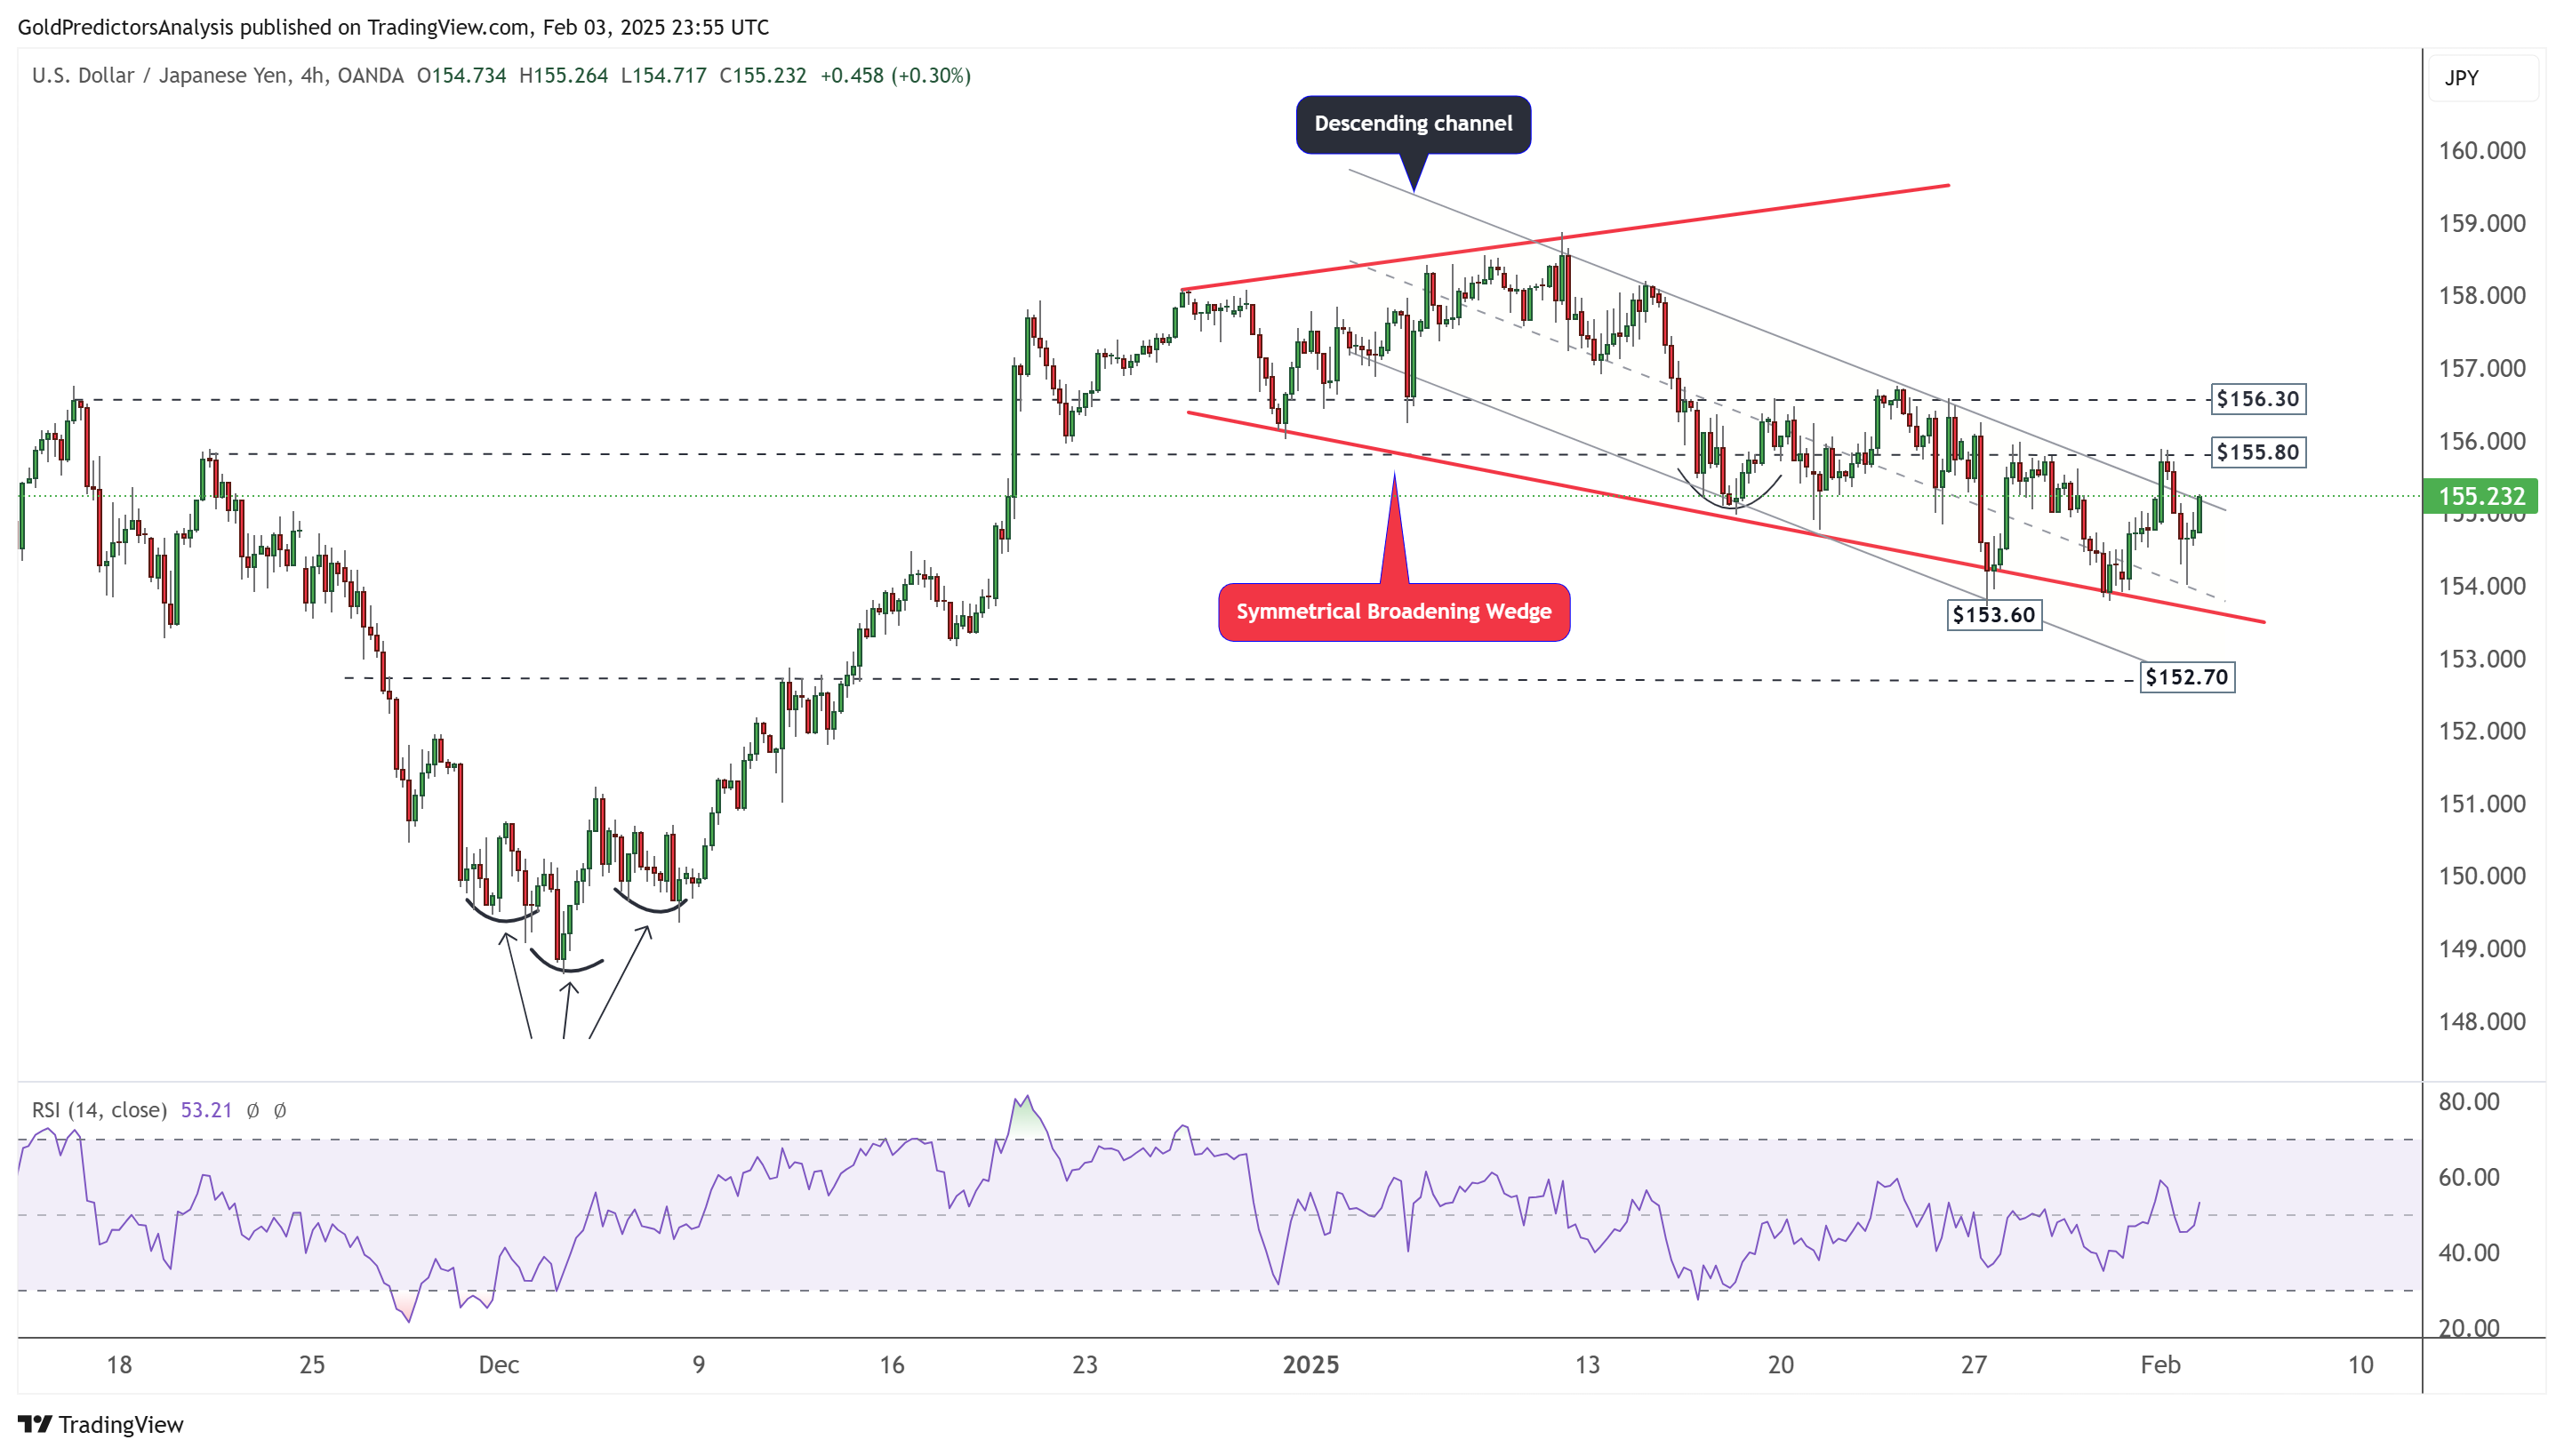
USD/JPY Analysis – Descending Channel
The 4-hour chart for USD/JPY shows a volatile pattern within a symmetrical broadening wedge. A descending channel within the wedge indicates a downward trend. However, the pair must break below $152.70 to confirm further downside movement.
About the Author
Bob MasonChief Crypto Boss
TEST 30 He has written extensively for a broader audience and his current focus is on developments relating to the financial markets including, but not limited to currencies, commodities, alternative asset classes, and global equities.
Latest news and analysis


Advertisement