
Advertisement
Advertisement
Bitcoin (BTC) Drops To $86,500 Despite Strategy’s $2B Purchase
By:
Key Points:
- Wave 4 correction confirmed with BTC breaking critical support.
- Fibonacci 0.382 level in focus at around $85,848.
- RSI oversold signals potential relief after steep drop.

Bitcoin (BTC) has experienced a sharp decline, confirming a Wave 4 correction in its ongoing Elliott Wave cycle. Recent price action suggests BTC has broken below key support levels, invalidating previous bullish structures and pointing toward deeper retracements.
This decline comes amid broader market uncertainty, with BTC dropping below $90,000, approaching significant Fibonacci support. The daily chart highlights a key inflection point where Bitcoin may either find support for a Wave 5 rally or extend further downward.
Strategy’s $2 Billion Bitcoin Acquisition
Strategy, formerly known as MicroStrategy, has expanded its Bitcoin holdings by purchasing an additional 20,356 BTC for $1.99 billion, averaging $97,514 per coin. This acquisition follows a $2 billion senior convertible note offering, part of the company’s “21/21 Plan” to raise $42 billion over three years for Bitcoin investments.
With this purchase, Strategy’s total Bitcoin reserves approach 500,000 BTC, acquired at an aggregate cost of $33.1 billion, averaging $66,357 per Bitcoin. Despite a $670 million net loss in Q4 2024, the company maintains an unrealized profit of over $14.8 billion on its Bitcoin holdings. Institutional interest in Strategy has grown, with BlackRock increasing its stake to 5% and twelve U.S. states holding shares in their pension funds or treasuries.
BTC Price Analysis
Bitcoin’s daily chart confirms a strong Wave 4 correction after the previous Wave 3 rally peaked above the $108,000 area. The decline has breached the key horizontal support around $92,000 below the 0.236 Fibonacci retracement, with BTC currently testing deeper Fibonacci retracement levels.
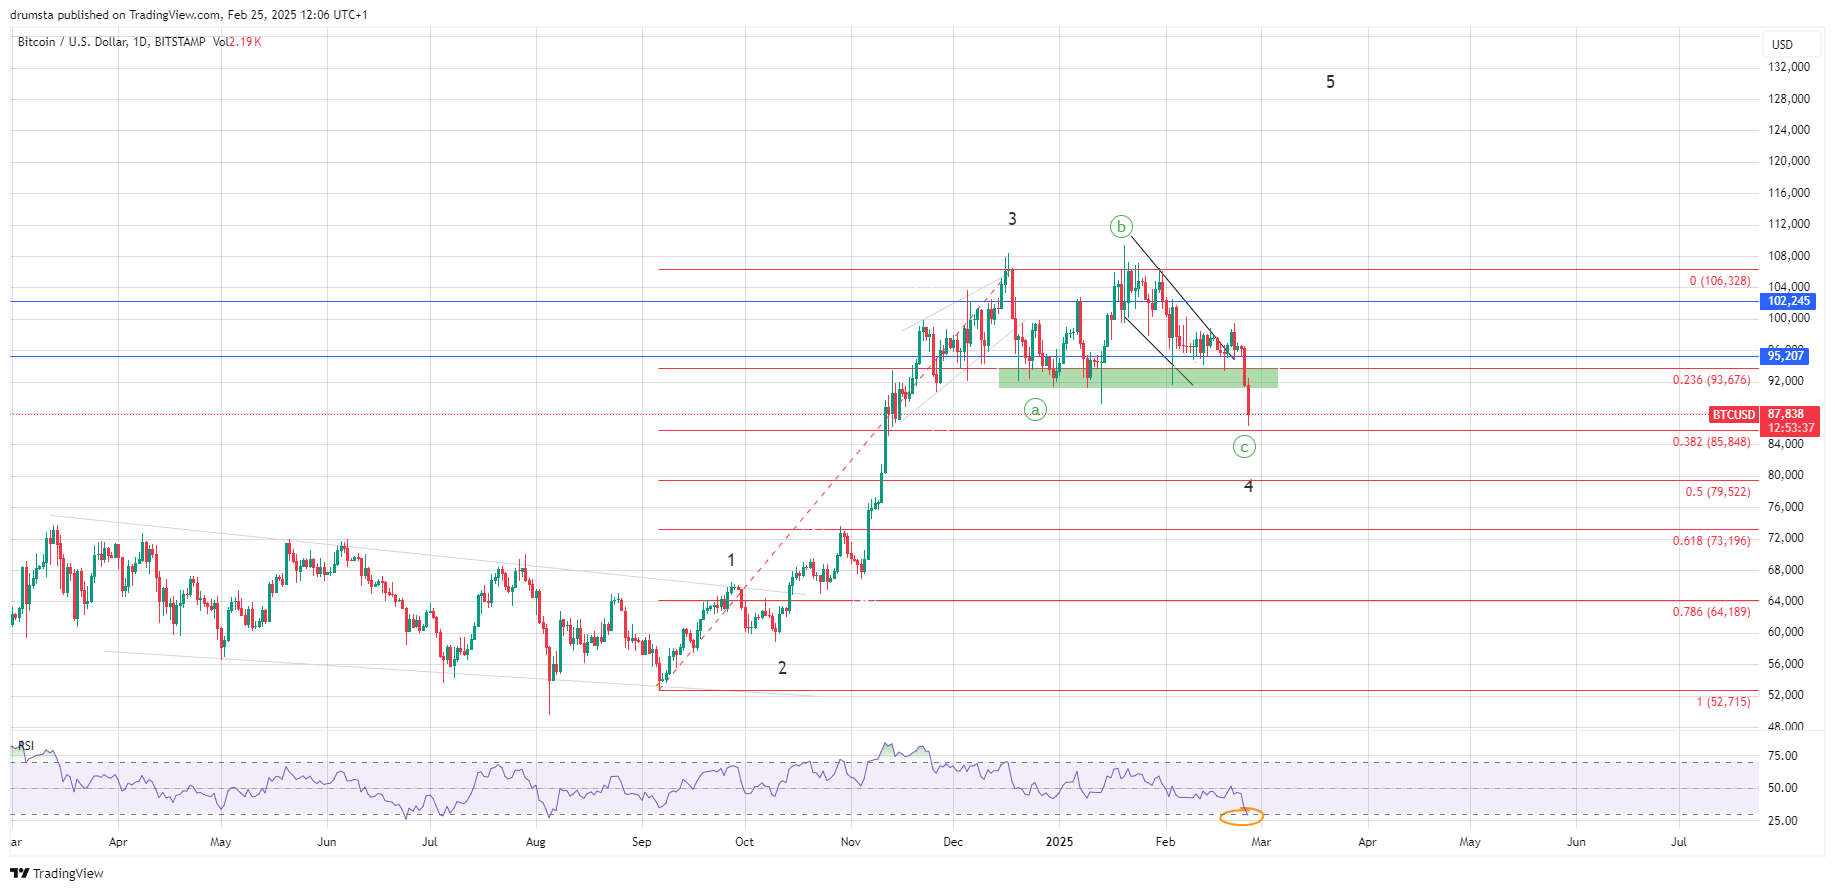
The Elliott Wave count suggests that BTC has completed its Wave 3 impulse and entered a corrective phase marked by an A-B-C structure. Wave A saw an initial pullback, followed by a relief bounce in Wave B, which failed to reclaim prior highs. The ongoing Wave C breakdown has accelerated, pushing BTC toward the 0.382 Fibonacci retracement level near $85,848. If bearish momentum persists, further downside could target the 0.5 level at $79,522 or even 0.618 at $73,196.
The Relative Strength Index (RSI) on the daily timeframe is showing oversold conditions, suggesting that BTC might be nearing a temporary bottom. However, a sustained reversal requires confirmation, ideally with a bullish divergence or reclaim of lost support levels.
From a structural perspective, BTC remains within the broader uptrend, but this correction phase may need additional consolidation before a new impulsive Wave 5 begins. The next bullish confirmation would be a reclaim of $95,207, which aligns with prior horizontal resistance.
BTC Price Prediction
On the 1-hour chart, Bitcoin has seen an aggressive sell-off, breaking below a descending channel and cascading toward lower Fibonacci supports. Taking a closer examination of the wave count, we can see that BTC is completing the final leg of a complex WXYXZ corrective pattern, with a possible reversal zone emerging near $85,848 (0.382 retracement).
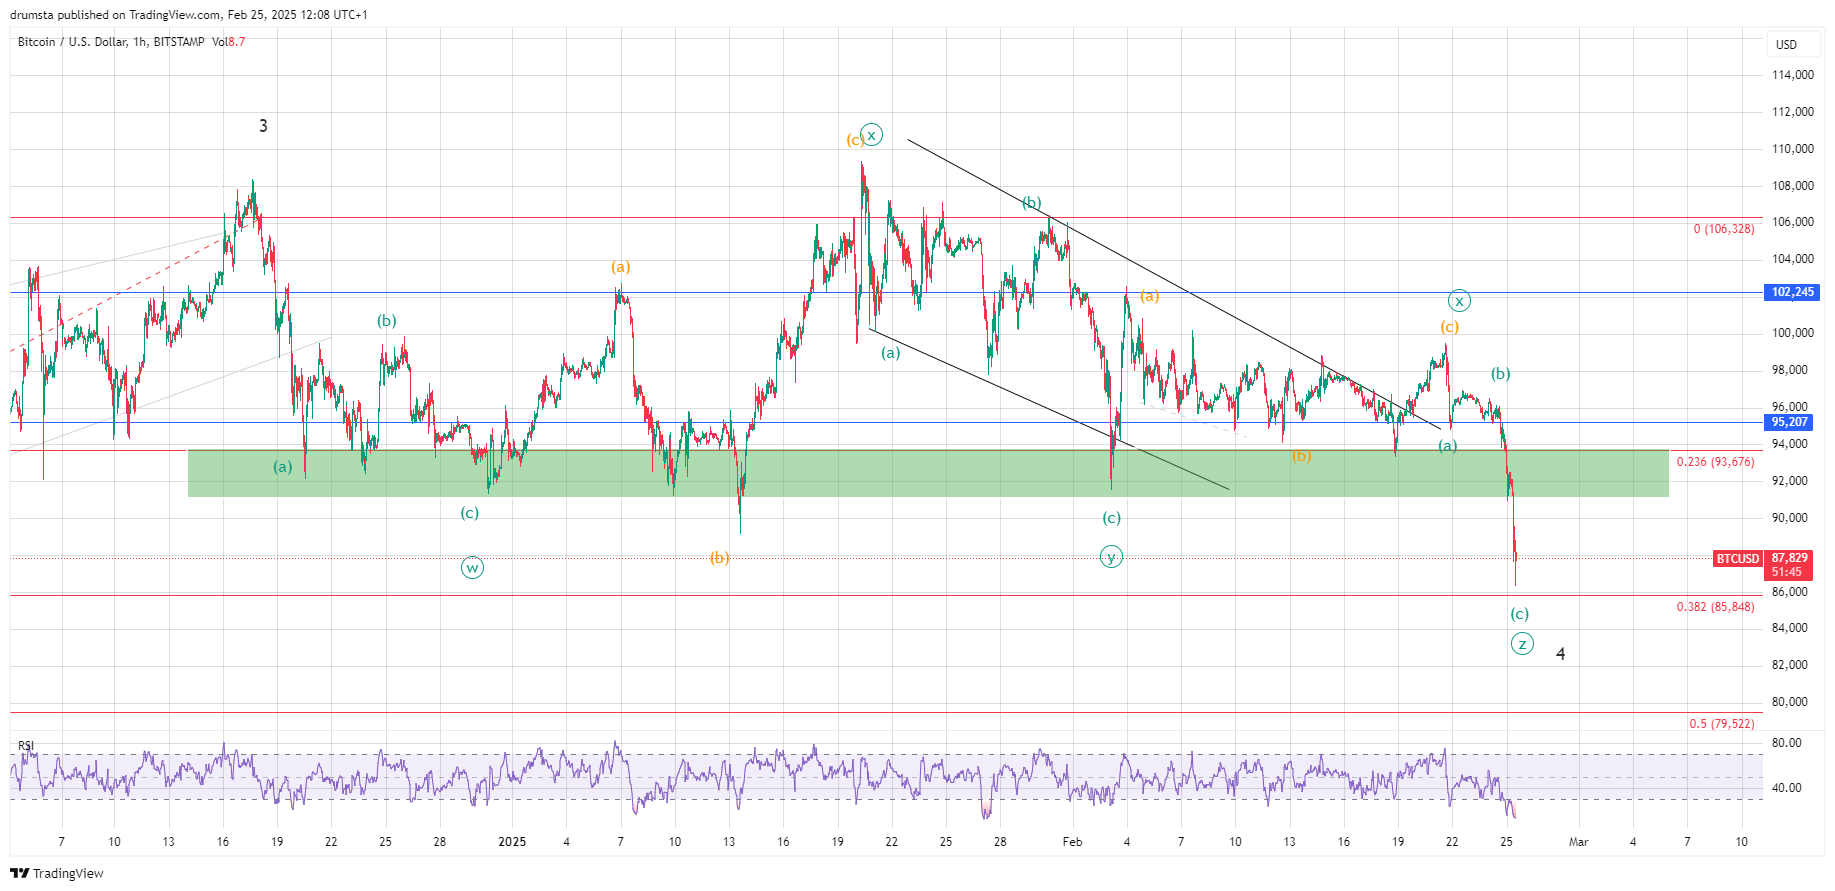
A rebound from this level could indicate a local bottom, leading to a corrective bounce toward $90,000–$93,676. However, if sellers remain dominant, BTC may extend losses to test the 0.5 Fibonacci level at $79,522. The RSI on the 1-hour chart is extremely oversold, hinting at a relief rally in the short term.
If BTC reclaims $93,676, it could signal the beginning of a new bullish impulse, possibly confirming the completion of Wave 4. The primary bullish scenario would involve BTC forming a base in this region before starting Wave 5, targeting new all-time highs. Conversely, continued weakness below $85,848 increases the risk of prolonged downside, with $79,522 acting as the next major support.
Key Levels to Watch
- Immediate Resistance: $93,676 (0.236 Fibonacci retracement)
- Key Resistance: $95,207 (prior horizontal support turned resistance)
- Major Resistance: $102,245 (psychological resistance & key retracement level)
- Immediate Support: $85,848 (0.382 Fibonacci retracement)
- Key Support: $79,522 (0.5 Fibonacci retracement)
- Critical Support: $73,196 (0.618 Fibonacci retracement)
About the Author
Bob MasonChief Crypto Boss
TEST 30 He has written extensively for a broader audience and his current focus is on developments relating to the financial markets including, but not limited to currencies, commodities, alternative asset classes, and global equities.
Latest news and analysis


Advertisement