
Advertisement
Advertisement
Bitcoin (BTC) News Today: ETF Outflows Pressuring BTC – What’s Next?
By:
Key Points:
- Bitcoin (BTC) tumbled 4.48% on Monday, June 24, ending the session at $60,331.
- Spot-ETF market outflows continued to pressure buyer demand for BTC, which dipped below $60,000.
- US consumer confidence and FOMC member commentary could influence buyer appetite for BTC-spot ETFs and BTC on Tuesday, June 25.

In this article:
BTC Slides Below $60K Amid ETF Outflows: Will US Economic Data Revive Demand?
On Monday, June 24, bitcoin (BTC) tumbled 4.48%. Following a 1.70% slide on Sunday, June 23, BTC ended the session at $60,331. Significantly, BTC dropped below $60,000 for the first time since May 2, 2024.
US BTC-spot ETF market flow trends impacted buyer demand for BTC. According to Farside Investors:
- Grayscale Bitcoin Trust (GBTC) had net outflows of $90.4 million on Monday, its highest since June 6.
- Fidelity Wise Origin Bitcoin Fund (FBTC) saw net outflows of $35.2 million.
- Franklin Bitcoin ETF (EZBC) reported net outflows of $20.9 million, with VanEck Bitcoin Trust (HODL) seeing net outflows of $10.2 million.
- Excluding flow data for iShares Bitcoin Trust (IBIT), the US BTC-spot ETF market saw total net outflows of $174.5 million on Monday, up from $105.9 million on Friday.
The US BTC-spot ETF market extended its net outflow streak to seven sessions. Despite the pullback in demand for US BTC-spot ETFs, IBIT last reported net outflows on May 1 (Flow data for June 24 is still pending).
Is BTC and the broader crypto market reaching the bottom of the latest pullback?
Near-term BTC-spot ETF and BTC trends will likely hinge on US economic indicators. Better-than-expected US consumer confidence (Tues) and hotter-than-expected inflation (Fri) numbers could reduce bets on a September Fed rate cut. A more hawkish Fed rate path could affect buyer demand for riskier assets.
What other factors are at play in dictating BTC price trends in the near and longer term?
Bitwise Chief Investor Officer Paints a Bright Future for BTC
Bitwise Investor Chief Investment Officer Matt Hougan shared his thoughts on current BTC price dynamics, saying,
“Throughout bitcoin’s history, various mechanisms have artificially pulled forward future demand and put it into a lock box. The biggest culprit was GBTC, which pulled forward tens of billions of dollars in future demand as hedge funds worked the premium trade. But there have been other mechanisms as well, including the Mt. Gox bankruptcy and the Silk Road seizure.”
Hougan went on to say,
“These lock boxes have kept the price of bitcoin higher than it would otherwise have been in a free flowing market, which has been great. But we are now unlocking these assets, thanks to the ETF and the passage of time. The result is that the bitcoin has to attract tens of billions of dollars in new demand just to tread water.”
Hougan concluded,
“I think we’ve worked off most of the overhang at this point — for instance, we’ve seen GBTC assets stabilize. But we haven’t worked off all of it, and that’s weighing on markets today. When we do, It will feel great to see new demand translate more directly into rising prices.”
Since the January 11 launch of the US BTC-spot ETF market, GBTC reported total net outflows of $18,450 billion. Bitwise Bitcoin ETF (BITB) saw total net inflows of $1,994 billion since its launch.
Technical Analysis
Bitcoin Analysis
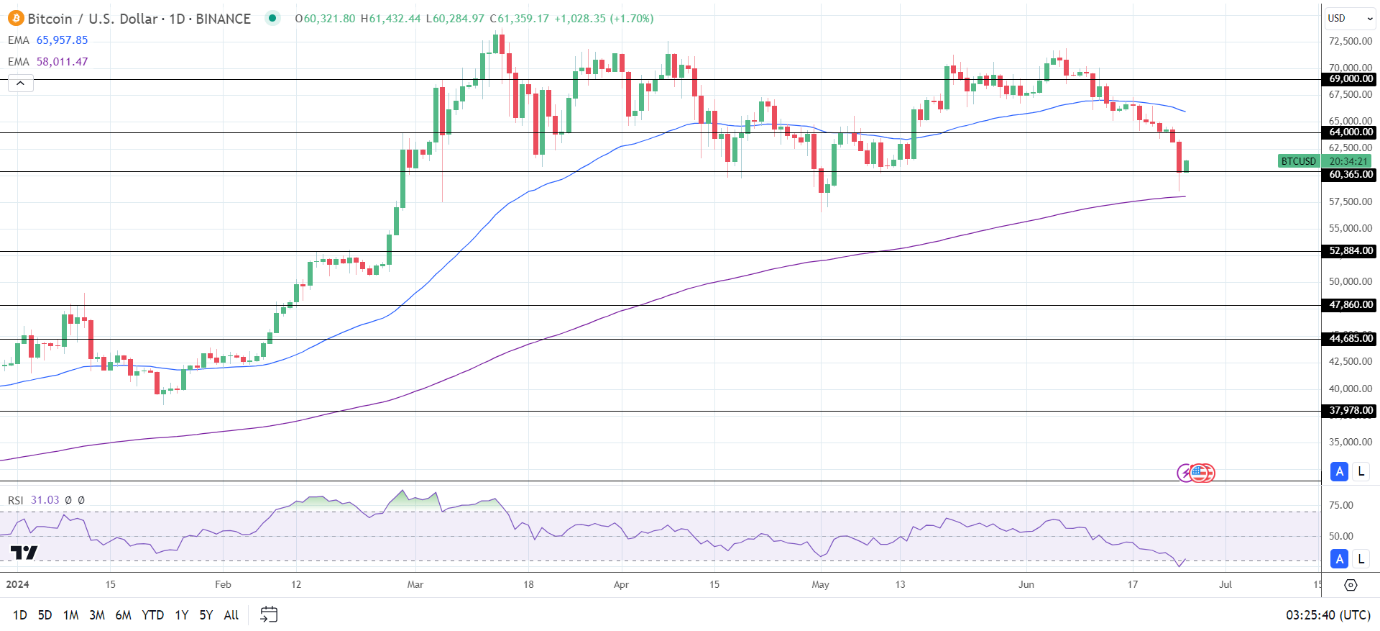
BTC sat well below the 50-day EMA but remained above the 200-day EMA. The EMAs sent bearish near-term signals but bullish longer-term signals.
A BTC break above the $64,000 resistance level could signal a move to the 50-day EMA. A breakout from the 50-day EMA may bring the $69,000 resistance level into play.
On Tuesday, US economic indicators, BTC-spot ETF flow data, and SEC activity require investor consideration.
On the other hand, a break below the $60,365 support level could give the bears a run at the 200-day EMA.
With a 31.03 14-Daily RSI reading, BTC may fall below the $60,365 support level before entering oversold territory.
Ethereum Analysis
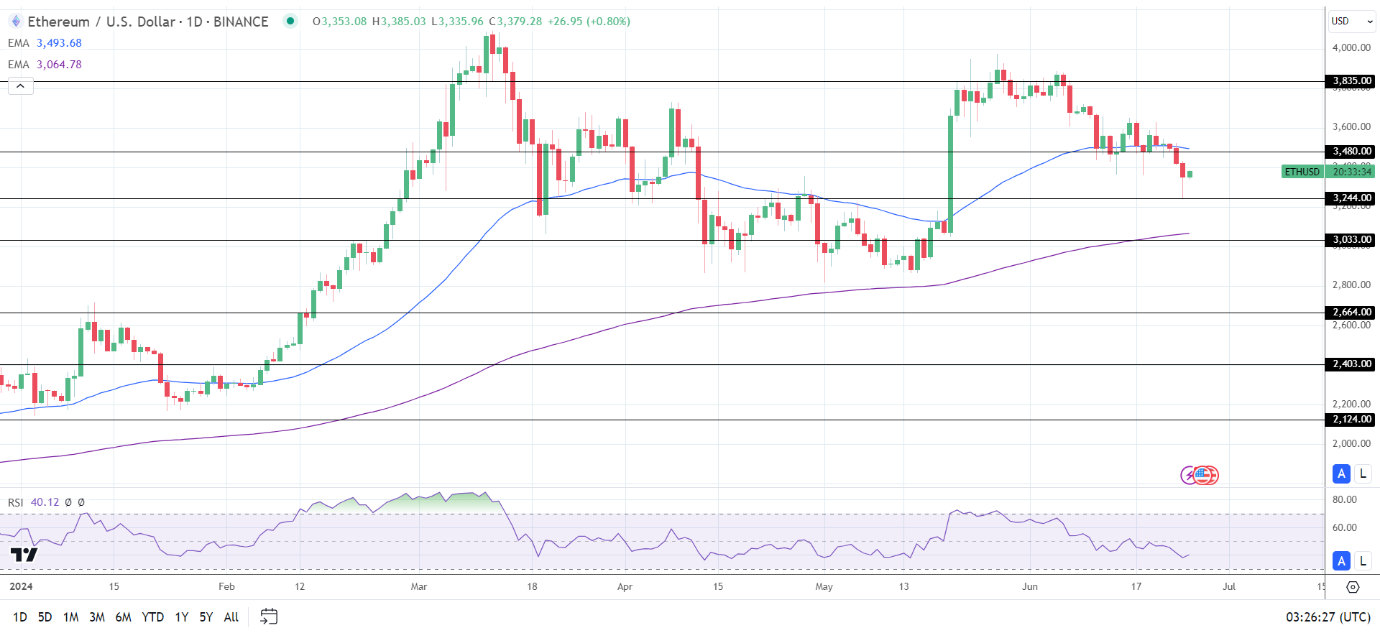
ETH remained below the 50-day EMA while sitting above the 200-day EMA. The EMAs affirmed the bearish near-term but bullish longer-term price signals.
A move above the $3,480 resistance level and the 50-day EMA could bring the $3,600 handle into play. An ETH return to the $3,600 handle could give the bulls a run at the $3,835 resistance level.
US ETH-spot ETF-related chatter needs consideration.
Conversely, an ETH drop below the $3,244 support level could give the bears a run at the 200-day EMA and the $3,033 support level.
The 14-period Daily RSI reading, 40.12, suggests an ETH fall through the $3,244 support level before entering oversold territory.
About the Author
Bob MasonChief Crypto Boss
TEST 30 He has written extensively for a broader audience and his current focus is on developments relating to the financial markets including, but not limited to currencies, commodities, alternative asset classes, and global equities.
Latest news and analysis


Advertisement