
Advertisement
Advertisement
Bitcoin (BTC) Rallies on US-China Trade Optimism and BlackRock ETF Inflow Surge
By:
Key Points:
- Bitcoin (BTC) rallied 1.72% to $104,617 on May 10, hitting its highest level since January 31 amid bullish sentiment.
- Trump’s comments on US-China trade reset boosted investor confidence, lifting demand for Bitcoin and risk assets.
- BlackRock’s IBIT led the inflow surge with $1.03B and a 19-day streak, signaling strong institutional appetite.

Bitcoin Rallies on US-China Trade Headlines
Bitcoin (BTC) gained 1.72% on Saturday, May 10, reversing Friday’s 0.24% loss to close at $104,617. BTC climbed to a session high of $104,774, its highest level since January 31, before easing back.
Optimism surrounding a potential US-China trade deal fueled demand. On May 10, President Trump shared updates from trade talks, stating:
“A very good meeting today with China, in Switzerland. Many things discussed, much agreed to. A total reset negotiated in a friendly, but constructive, manner. We want to see, for the good of both China and the U.S., an opening up of China to American business. GREAT PROGRESS MADE!!!”
US BTC-Spot ETF Market Extends Inflow Streak
Easing geopolitical tensions also boosted demand for US BTC-spot ETFs, crucial for BTC’s supply-demand trajectory. According to Farside Investors, the week ending May 9 saw $920.9 million in net inflows, extending the inflow streak to four weeks. Key weekly flows included:
- BlackRock’s (BLK) iShares Bitcoin Trust (IBIT) continued dominating the market, with net inflows of $1,030.3 million.
- Fidelity Wise Origin Bitcoin Fund (FBTC) had net inflows of $62.4 million.
- ARK 21Shares Bitcoin ETF (ARKB) saw net inflows of $45.6 million.
Notably, IBIT extended its daily inflow streak to an impressive nineteen sessions.
Bloomberg Intelligence Senior ETF Analyst Eric Balchunas commented:
“For a total of about $5b, about tied for 2nd among all ETFs after King VOO of course. What’s interesting tho is IBIT has taken in like 90% of all the flows in category past month, long term average is more like 67%. My theory is HF basis trade and/or big fish buying, bc they favor most liq etfs.”
ETF Store President Nate Geraci added:
“Primarily bigger fish IMO… it’s legit institutional $$$ being deployed w/ longer-term intention. Think this $$$ was (& is) coming regardless, but recent performance of btc certainly helping. Wish institutions would give some other btc ETF issuers a look tho (but I get it).”
The deployment of longer-term capital into BTC-spot ETFs could further support BTC price gains.
BTC Price Outlook: Key Drivers
BTC’s short-term price outlook hinges on several key macro and market drivers:
- US-China trade developments will likely influence risk sentiment and broader crypto market appetite.
- Upcoming US economic data could affect Fed rate cut bets and recession risk.
- Progress on the Bitcoin Act may drive fresh institutional interest.
- US BTC-spot ETF flows remain crucial to near-term price trends.
BTC Price Scenarios:
- Bullish Scenario: Easing trade tensions, dovish Fed bets, Bitcoin Act momentum, and strong ETF inflows may drive BTC toward $110,000.
- Bearish Scenario: Renewed trade tensions, hawkish Fed signals, legislative gridlock, or ETF outflows could drag BTC toward $90,000.
For ongoing insights into macro trends, regulation, and ETF data, follow our analysis here.
Technical Analysis
Bitcoin Analysis
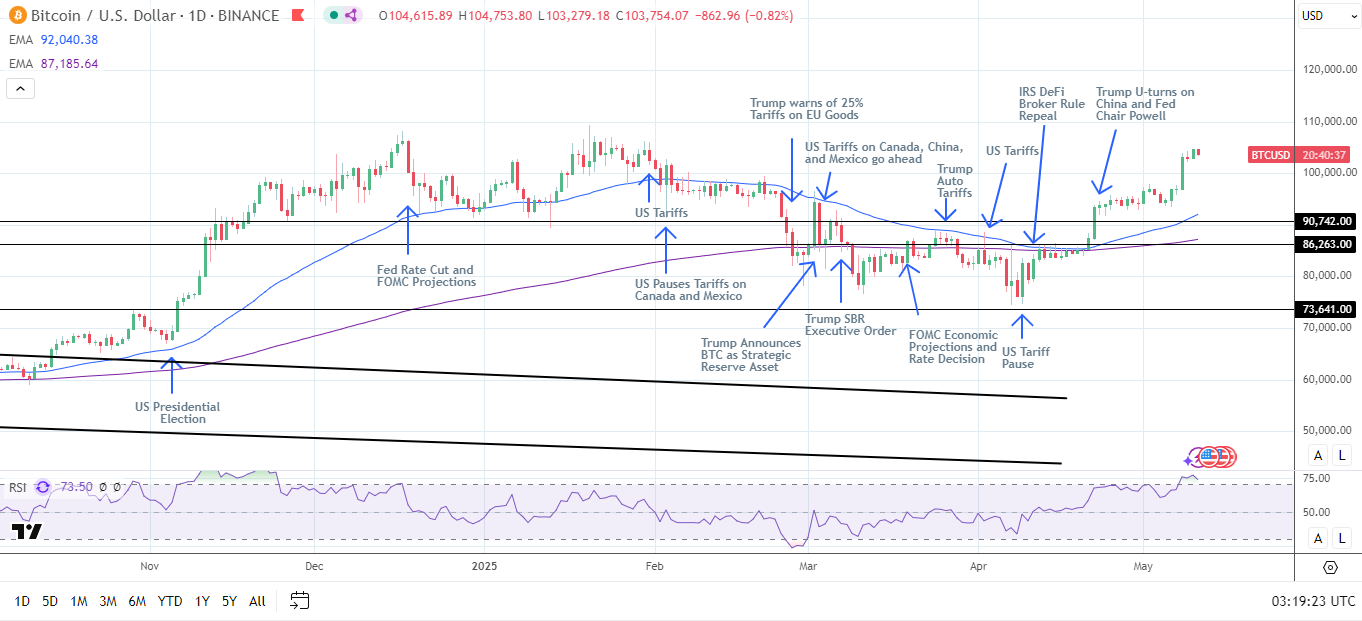
BTC remains above the 50-day and the 200-day Exponential Moving Averages (EMA), reaffirming bullish momentum.
- Upside Target: A break above the May 10 high of $104,774 could pave the way to the record high of $109,312. A decisive move past $109,312 may enable the bulls to target $115,000.
- Downside Risk: A drop below $100,000 could send BTC toward the 50-day EMA. Intensifying selling pressure may expose the $90,742 support level.
The 14-day Relative Strength Index (RSI) at 73.50 shows BTC in overbought territory (RSI > 70). Selling pressure may intensify at the May 10 high of $104,774.
Stay ahead of market trends by accessing real-time BTC price data and technical indicators here.
Ethereum Analysis
Turning to ethereum (ETH), ETH benefited from a shift in sentiment toward crypto assets.
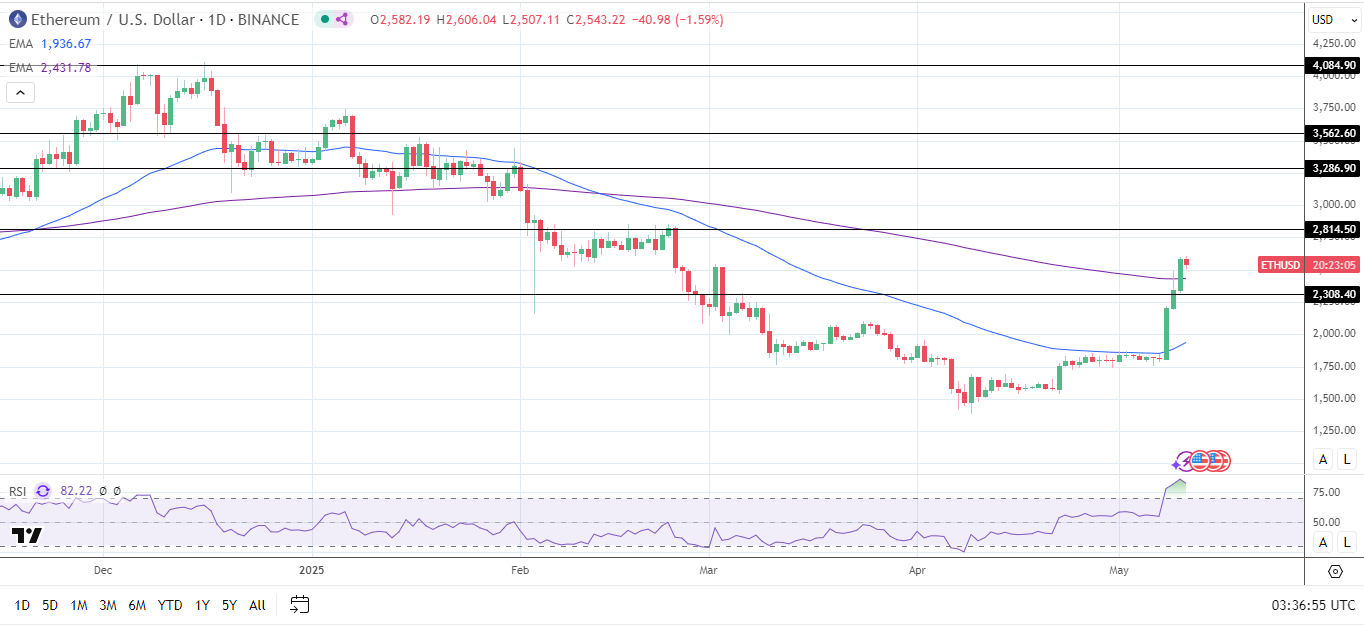
After three breakout sessions, ETH trades above the 50-day and 200-day EMAs, signaling bullish momentum.
- Upside target: A breakout above the May 11 high of $2,606 could enable the bulls to target the $2,815 resistance level. A sustained move above $2,815 could pave the way to test $3,000.
- Downside risks: If ETH drops below the 200-day EMA, the $2,308 support level could come into play.
The 14-day Relative Strength Index (RSI) at 82.22 shows ETH in overbought territory (RSI > 70). Selling pressure may intensify at the May 11 high of $2,606.
Stay informed on BTC and ETH trends by tracking macroeconomic developments, ETF flows, and technical indicators in real-time here.
About the Author
Bob MasonChief Crypto Boss
123456789 30 He has written extensively for a broader audience and his current focus is on developments relating to the financial markets including, but not limited to currencies, commodities, alternative asset classes, and global equities.


Advertisement