
Advertisement
Advertisement
Bitcoin Faces Pressure Amid ETF Outflows, US Data, and Looming Jobs Report
By:
Key Points:
- Bitcoin falls 3.15% on September 5, closing at $56,190.
- US BTC-spot ETFs face heavy outflows, marking six consecutive days of declining investor demand.
- Investors await US Jobs Report, which could influence near-term BTC price and market sentiment.

In this article:
Bitcoin Under Pressure
On Thursday, September 5, BTC slid by 3.15%, reversing a 0.85% gain from the previous session, closing at $56,190. Significantly, BTC slid to a session low of $55,664.
US Economic Calendar Sends BTC to Session Low
US labor market data weighed on BTC demand. The ADP reported a 99k increase in employment for August, the lowest since January 2021. The markets expected a 145k increase.
The weaker-than-expected numbers impacted demand for riskier assets. Investors were cautious ahead of Friday’s crucial US Jobs Report. On Thursday, the Dow Jones and S&P 500 saw losses of 0.54% and 0.30%, respectively, while the Nasdaq Composite Index gained 0.25%.
Lingering fears of a US hard landing (recession) also affected market sentiment despite the steady ISM Services PMI, further affecting market risk sentiment.
Uncertainty Fuels US BTC-spot ETF Market Outflows
On Wednesday, September 4, the US BTC-spot ETF market saw net outflows of $37.2 million, extending its outflows streak to six sessions. Waning BTC demand through the spot ETF market contributed to the negative sentiment.
The US BTC-spot ETF market faces the prospect of a seven-day net outflow streak on Thursday, September 5. According to Farside Investors,
- Fidelity Wise Origin Bitcoin Fund (FBTC) reported net outflows of $149.5 million.
- Bitwise Bitcoin ETF (BITB) had net outflows of $30.0 million.
- Grayscale Bitcoin Trust (GBTC) saw net outflows of $23.2 million.
- Grayscale Bitcoin Mini Trust reported net outflows of $8.4 million.
Excluding iShares Bitcoin Trust (IBIT), the US BTC-spot ETFs saw $211.1 million in net outflows on Thursday.
Upcoming US Jobs Report and BTC Trends
On Friday, September 6, the heavily anticipated US Jobs Report could dictate near-term BTC price trends. Economists expect the US unemployment rate to fall from 4.3% in July to 4.2% in August. Additionally, economists predict nonfarm payrolls will increase by 160k in August, following a 114k rise in July.
Positive US labor market data could signal a no-landing scenario and sink bets on a 50-basis point September Fed rate cut. Easing fear of a US recession may support a BTC move toward $60,000. However, buyer appetite for US BTC-spot ETFs must improve to drive BTC demand.
Weak numbers and an extension of outflows from the US BTC-spot ETF market may tilt the supply-demand balance in favor of supply. BTC could drop toward $50,000 in an extended outflow backdrop.
Investors should stay vigilant as shifting sentiment and supply-demand trends may affect BTC demand. Stay updated with our latest news and analysis to manage exposure to BTC and the broader crypto market.
Technical Analysis
Bitcoin Analysis
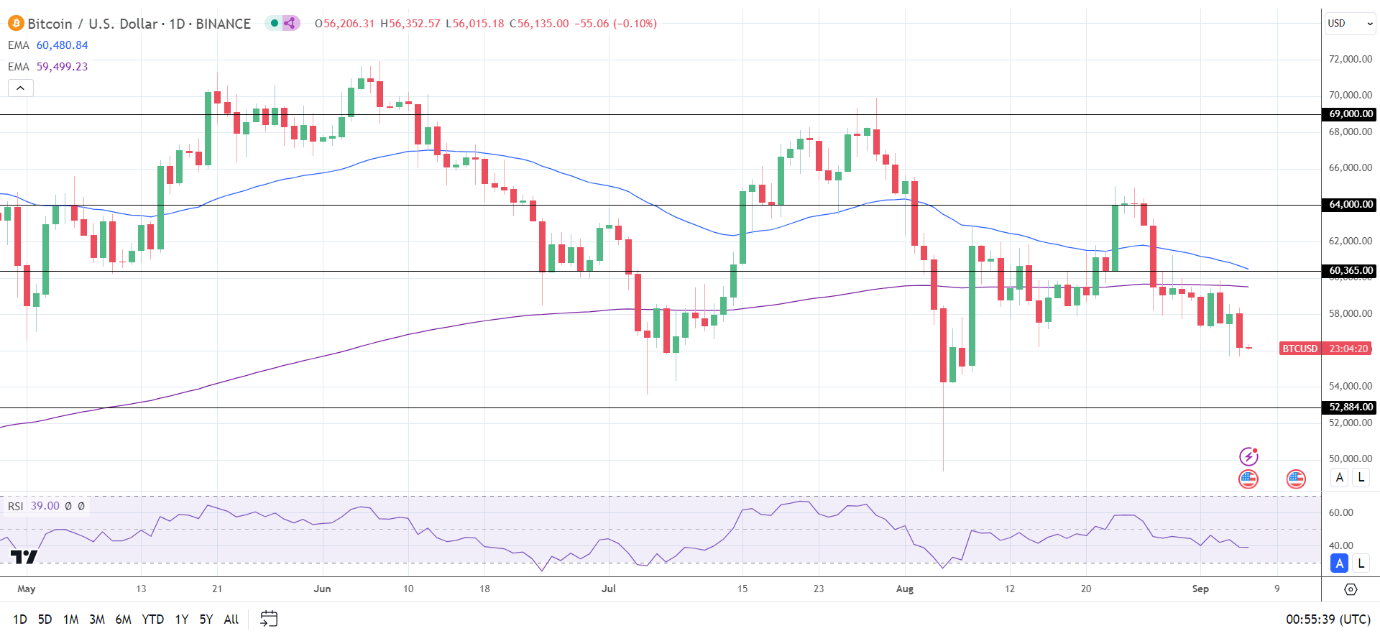
BTC sat well below the 50-day and 200-day EMAs, affirming bearish price signals.
A return to $57,500 would support a move toward the 200-day EMA. Furthermore, a break above the 200-day EMA could give the bulls a run at the $60,365 resistance level and 50-day EMA. Selling pressure could intensify at the $60,365 resistance level as the 50-day EMA is confluent with the resistance level.
The US Job Report, sentiment toward the Fed rate path, and BTC-spot ETF market flow trends require consideration.
Conversely, a break below $55,000 could give the bears a run at the $52,884 support level.
With a 39.00 14-day RSI reading, BTC could drop below $55,000 before entering oversold territory.
Ethereum Analysis
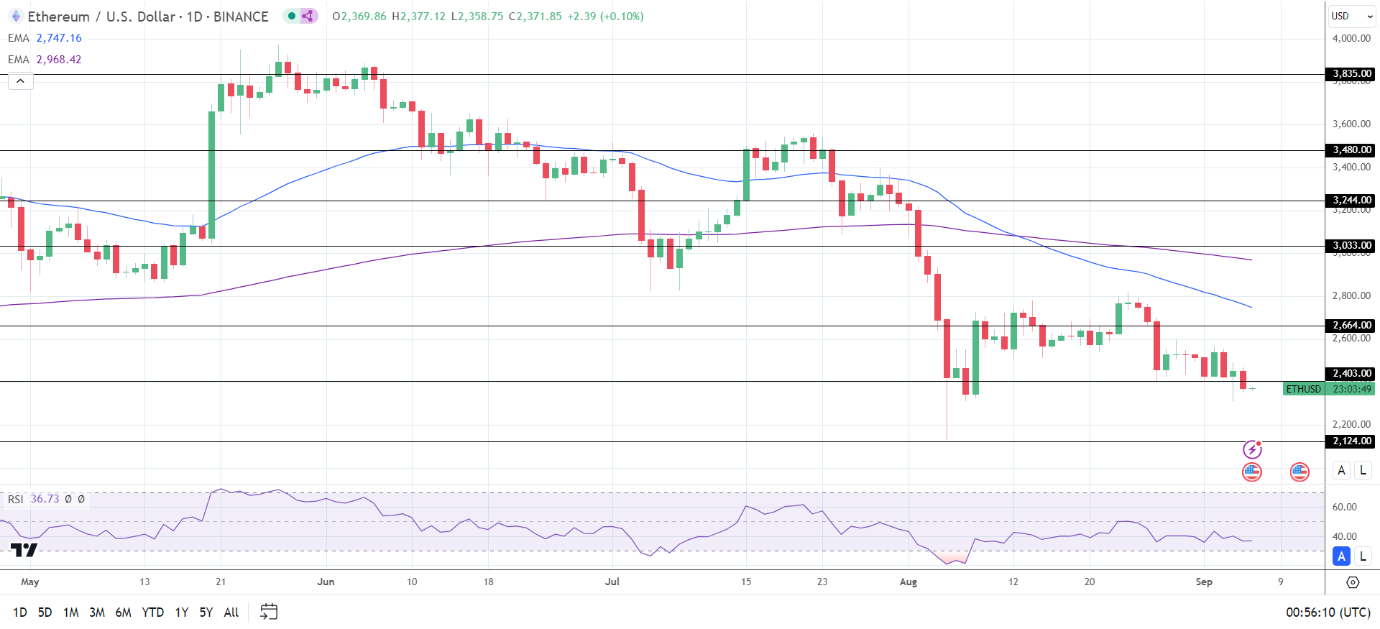
ETH remained well below the 50-day and 200-day EMAs, affirming bearish price signals.
An ETH break above the $2,403 resistance level would support a return to $2,500. Furthermore, a breakout from the $2,403 resistance level could give the bulls a run at the $2,664 resistance level.
US ETH-spot ETF market-related updates also require consideration.
Conversely, an ETH drop below the September 4 low of $2,311 may signal a drop toward the $2,124 support level.
The 14-period Daily RSI reading, 36.73, suggests an ETH drop to the $2,124 support level before entering oversold territory.
About the Author
Bob MasonChief Crypto Boss
TEST 30 He has written extensively for a broader audience and his current focus is on developments relating to the financial markets including, but not limited to currencies, commodities, alternative asset classes, and global equities.
Latest news and analysis


Advertisement