
Advertisement
Advertisement
Bitcoin’s ‘Strong Structural Support,’ Rate Cut Hopes Hint at $128K BTC Price Next
By:
Key Points:
- Bitcoin is holding strong above the $93K–$100K cost basis zone, signaling continued bullish structure.
- Fed rate cut expectations and easing geopolitical tensions are driving renewed BTC upside momentum.
- A breakout above the current bull flag pattern could propel Bitcoin toward $128,000 in the short term.

Bitcoin (BTC) looks poised to retest all-time highs as macro and onchain tailwinds align. A solid base around $100,000, combined with rising expectations of US rate cuts, is setting the stage for a potential breakout toward $128,000 in the coming months.
$93K–$100K Zone Becomes Bitcoin’s Bull Market Fault Line
Over the weekend, Bitcoin dropped to as low as $99,000 before rebounding sharply, validating the dense cost basis zone between $93,000 and $100,000 as structural support.
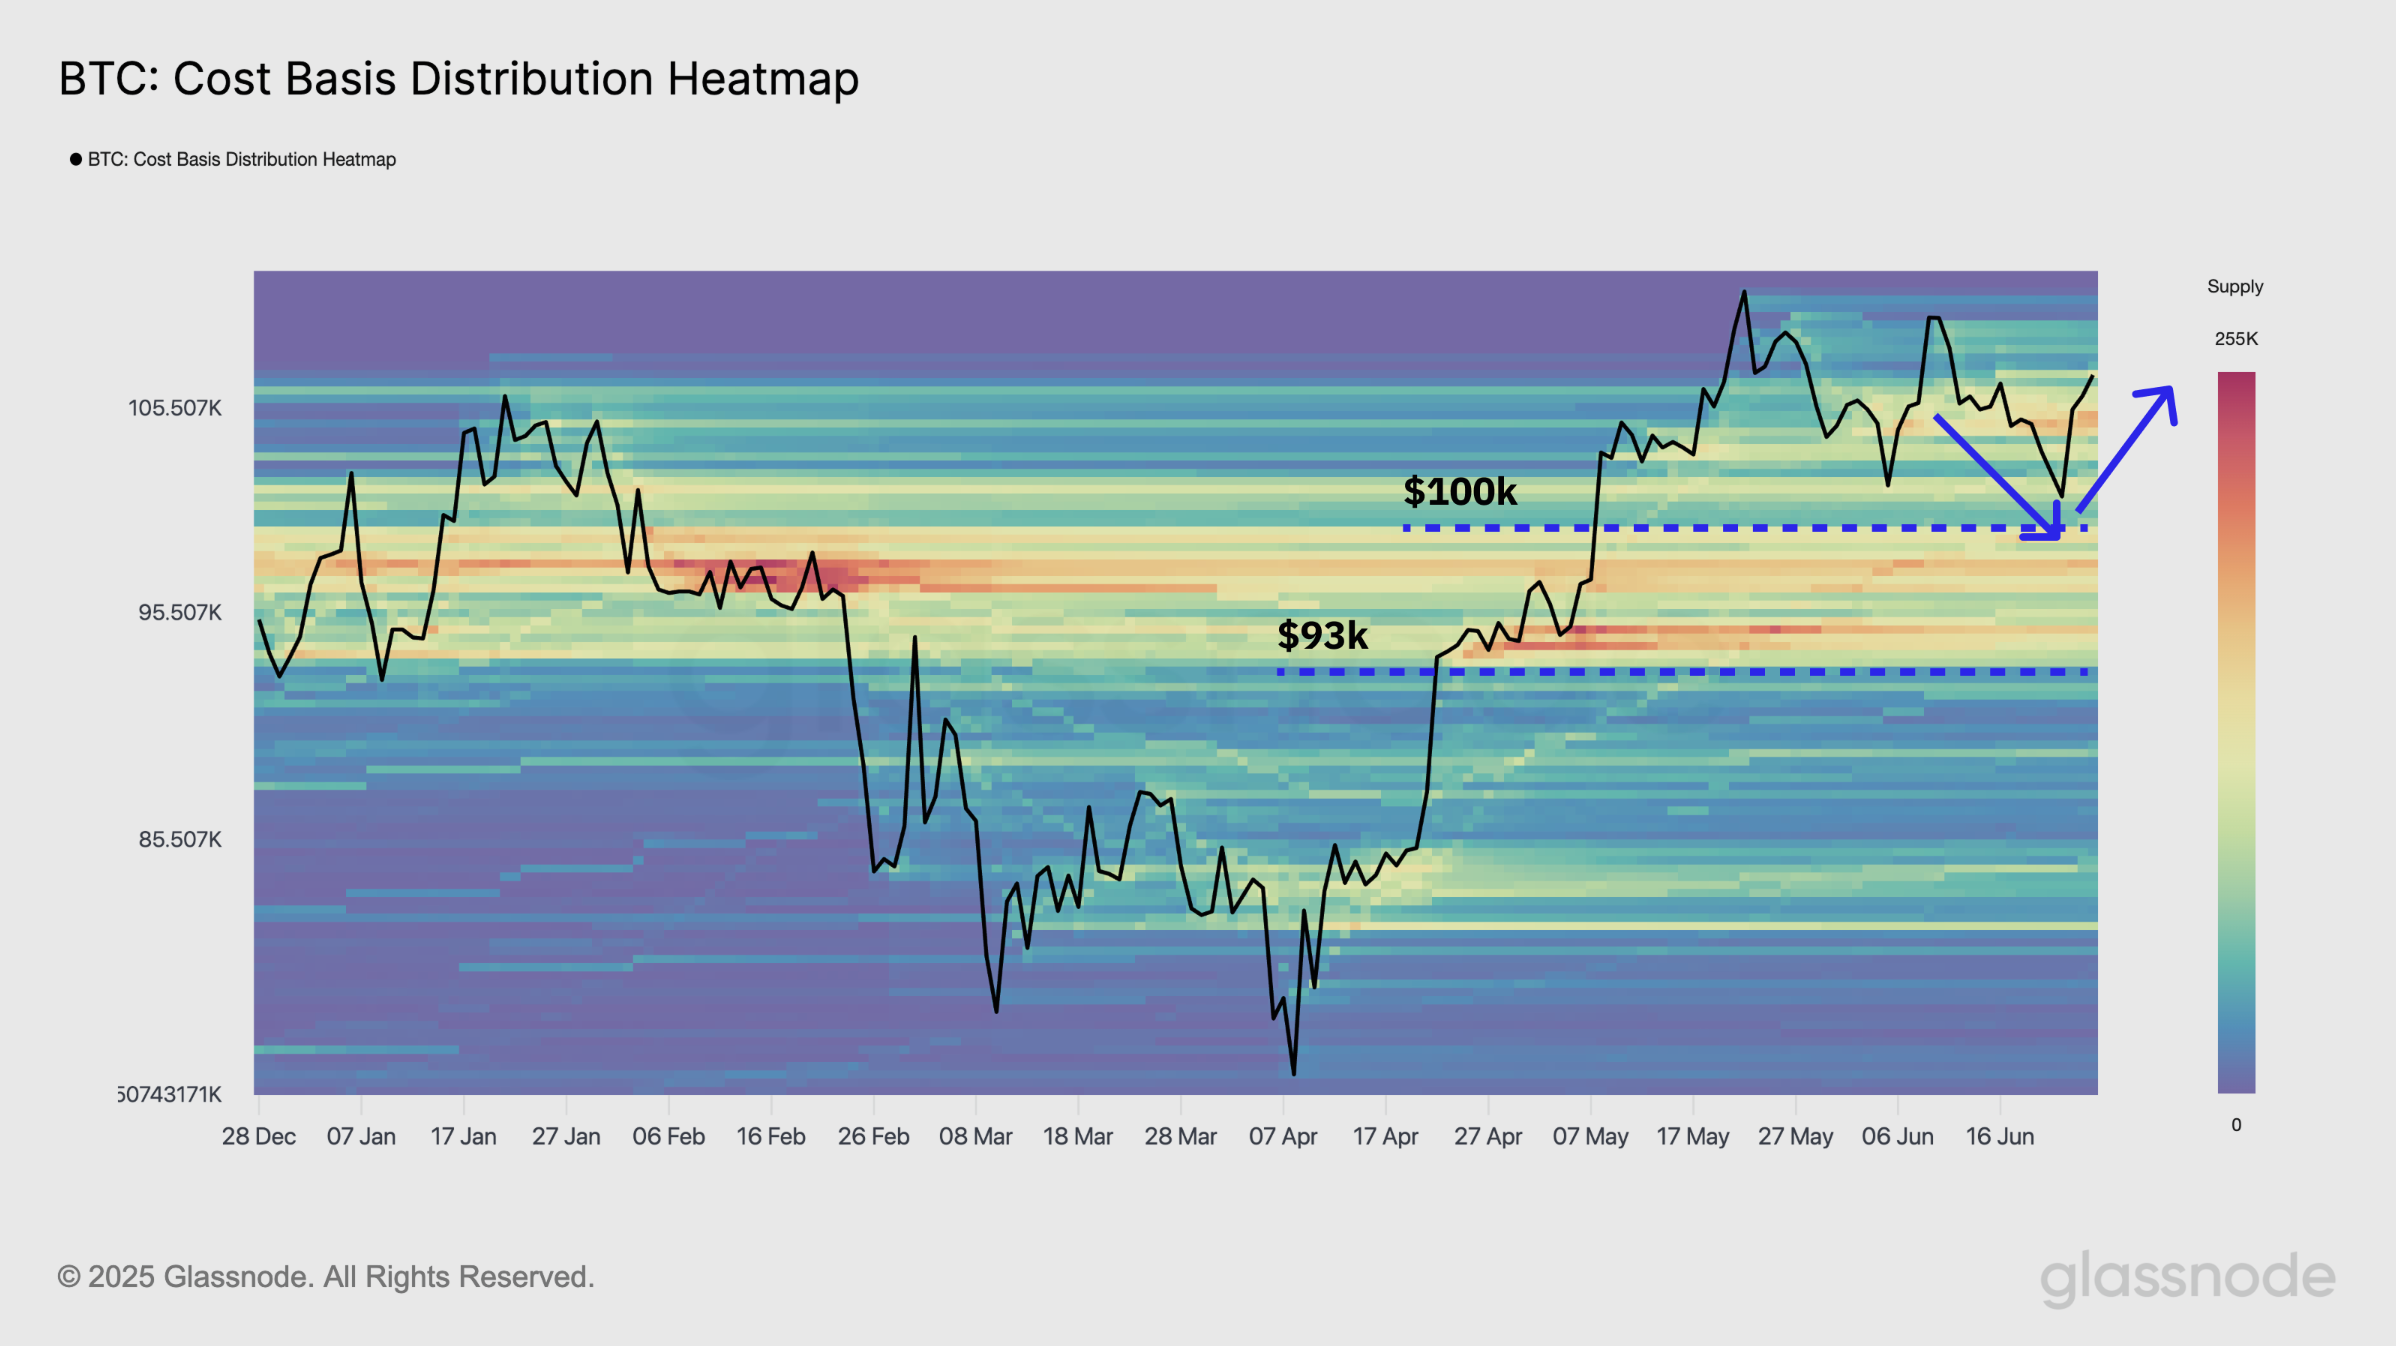
Bitcoin’s quick recovery above this level suggests minimal panic among short-term investors, keeping the broader uptrend intact. Glassnode analysts note that price action above this zone signals continued accumulation rather than capitulation.
Macro Tailwinds Project $128,000 BTC Price Target
The rebound coincided with Israel-Iran de-escalation headlines and a sharp rise in market expectations for a Federal Reserve rate cut.
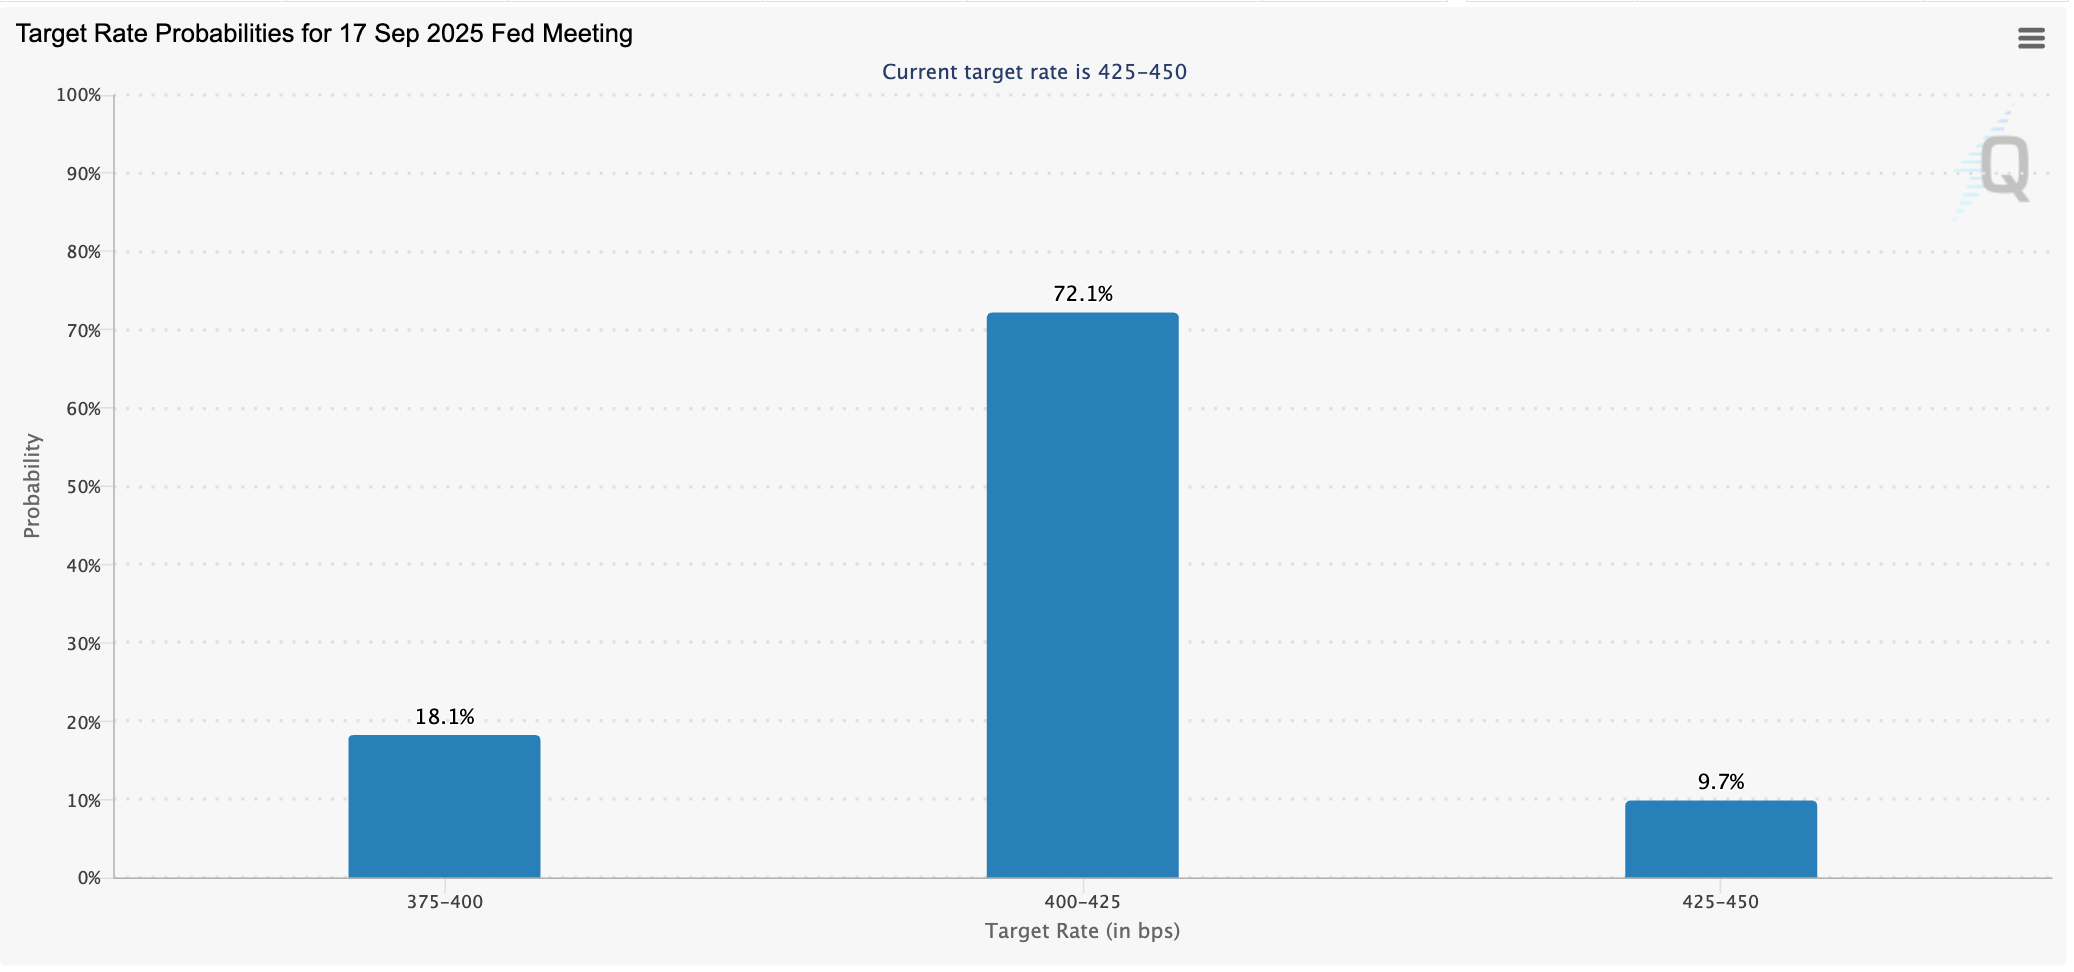
Fed futures now price in a third 72.1% chance of a 25 basis points cut in September, up from 47.7% a month ago. Historically, such easing environments have boosted demand for Bitcoin as a non-yielding macro hedge.
Meanwhile, Bitcoin continues to consolidate between $100,000 and $110,000, a range it has held since May 8. A breakout above $110,000 could confirm the next leg of the rally.
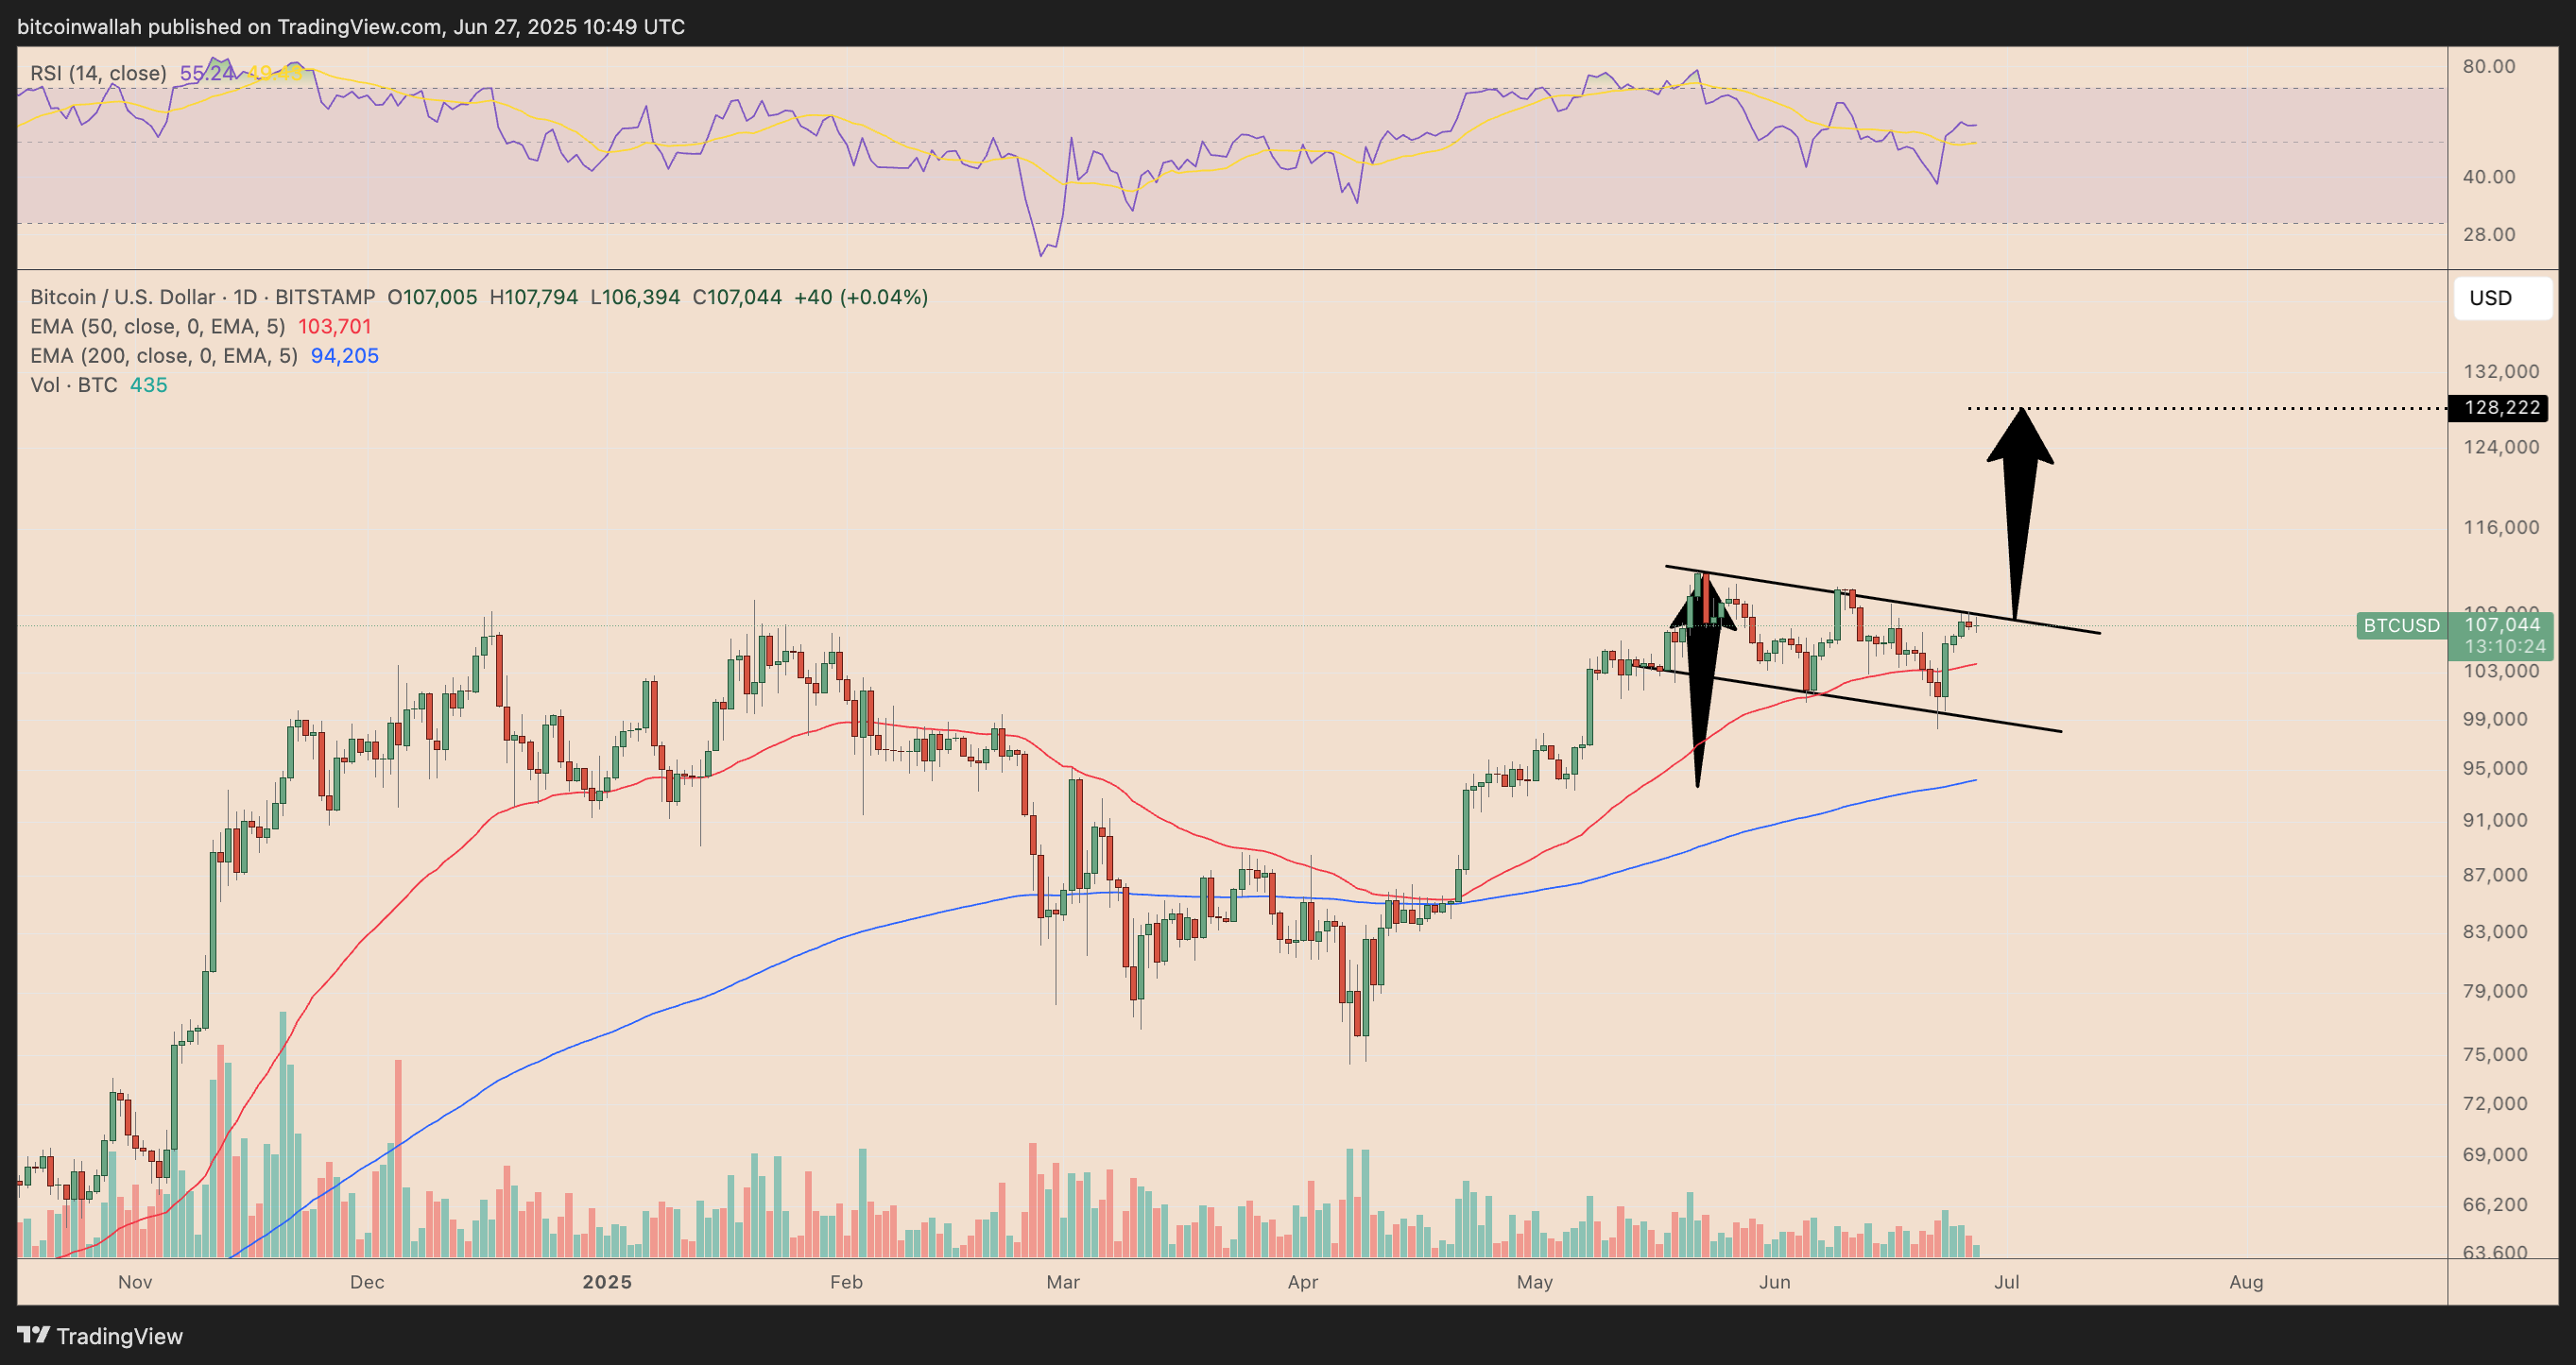
Bull flags form when the price consolidates lower inside a downward-sloping channel, especially after undergoing a strong upside run. They typically resolve when the price breaks above the upper trendline and rises to the level at length equal to the previous uptrend’s height, called a “flagpole.”
As of June 27, BTC’s price was testing the flag’s upper trendline for a breakout.
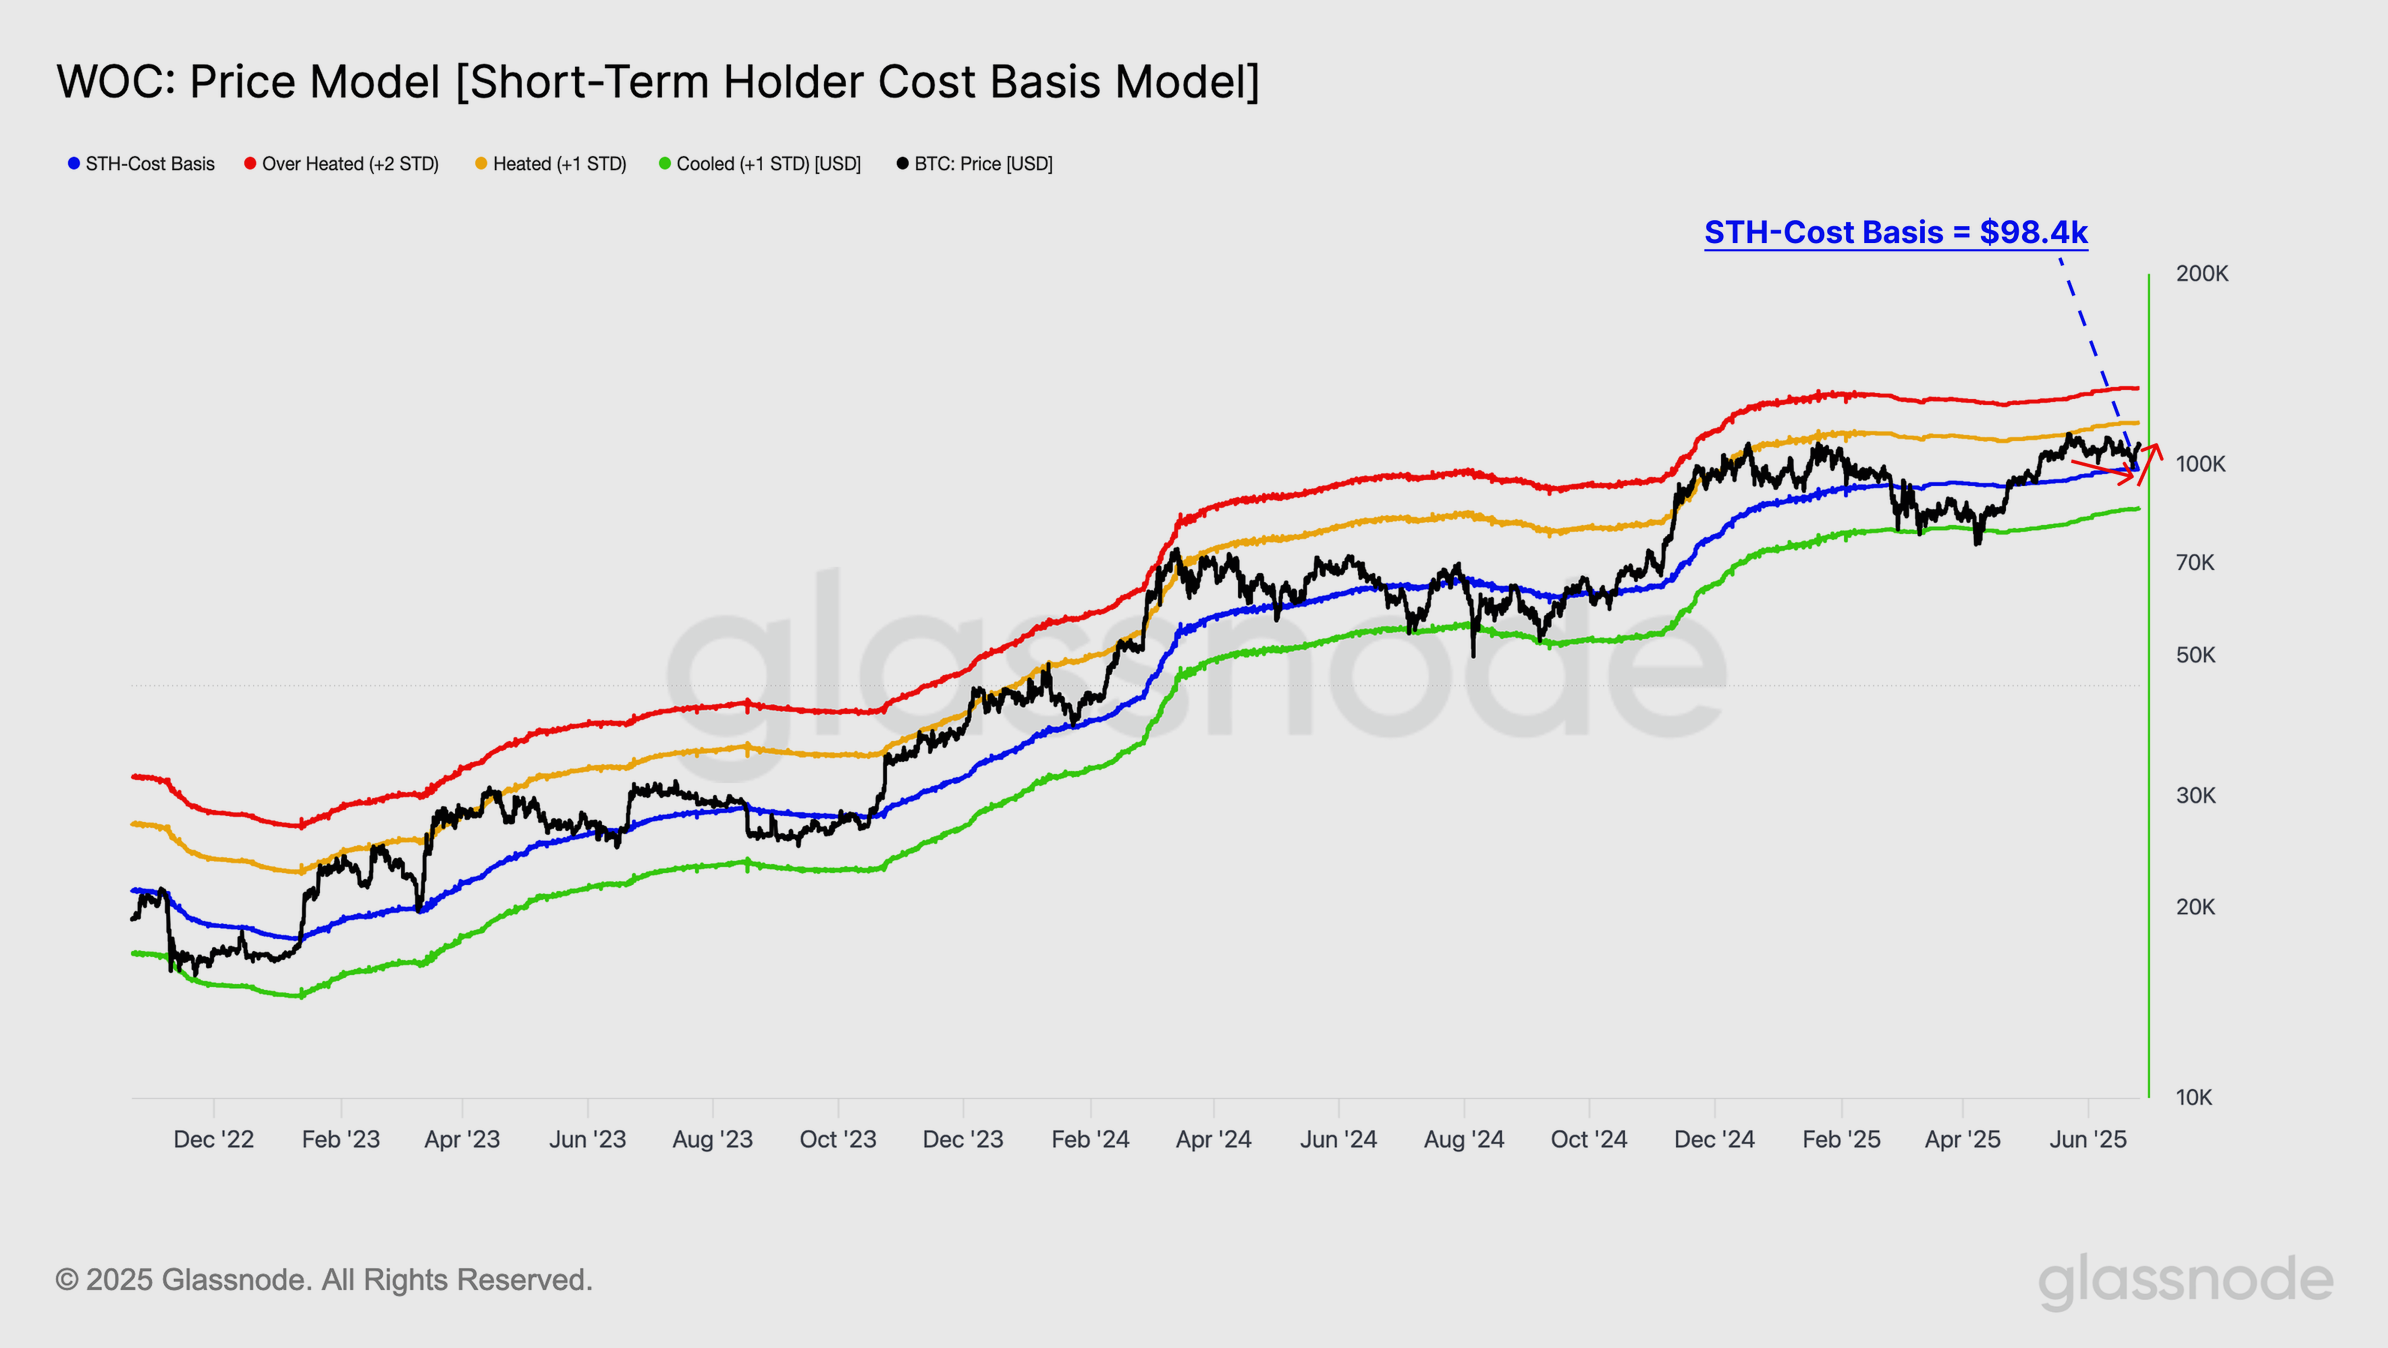
The cryptocurrency could rally toward $128,000 on a successful close above the trendline. Otherwise, it risks plunging toward the lower trendline target around $98,250, right around the short-term cost basis target.
About the Author
Bob MasonChief Crypto Boss
123456789 30 He has written extensively for a broader audience and his current focus is on developments relating to the financial markets including, but not limited to currencies, commodities, alternative asset classes, and global equities.


Advertisement