
Advertisement
Advertisement
Chainlink Price News: LINK Could Rise to $20 After Support Bounce and Key Announcements
By:
Key Points:
- Chainlink announced two important developments this week that could drive higher demand for LINK in the long term.
- LINK has faced strong selling pressure at $17.5.
- The 21-day EMA is the key support to watch if the price pulls back from this level.

Trading volumes have been above the average in the past week as the market has recovered quickly from its 2025 lows as sentiment shifted.
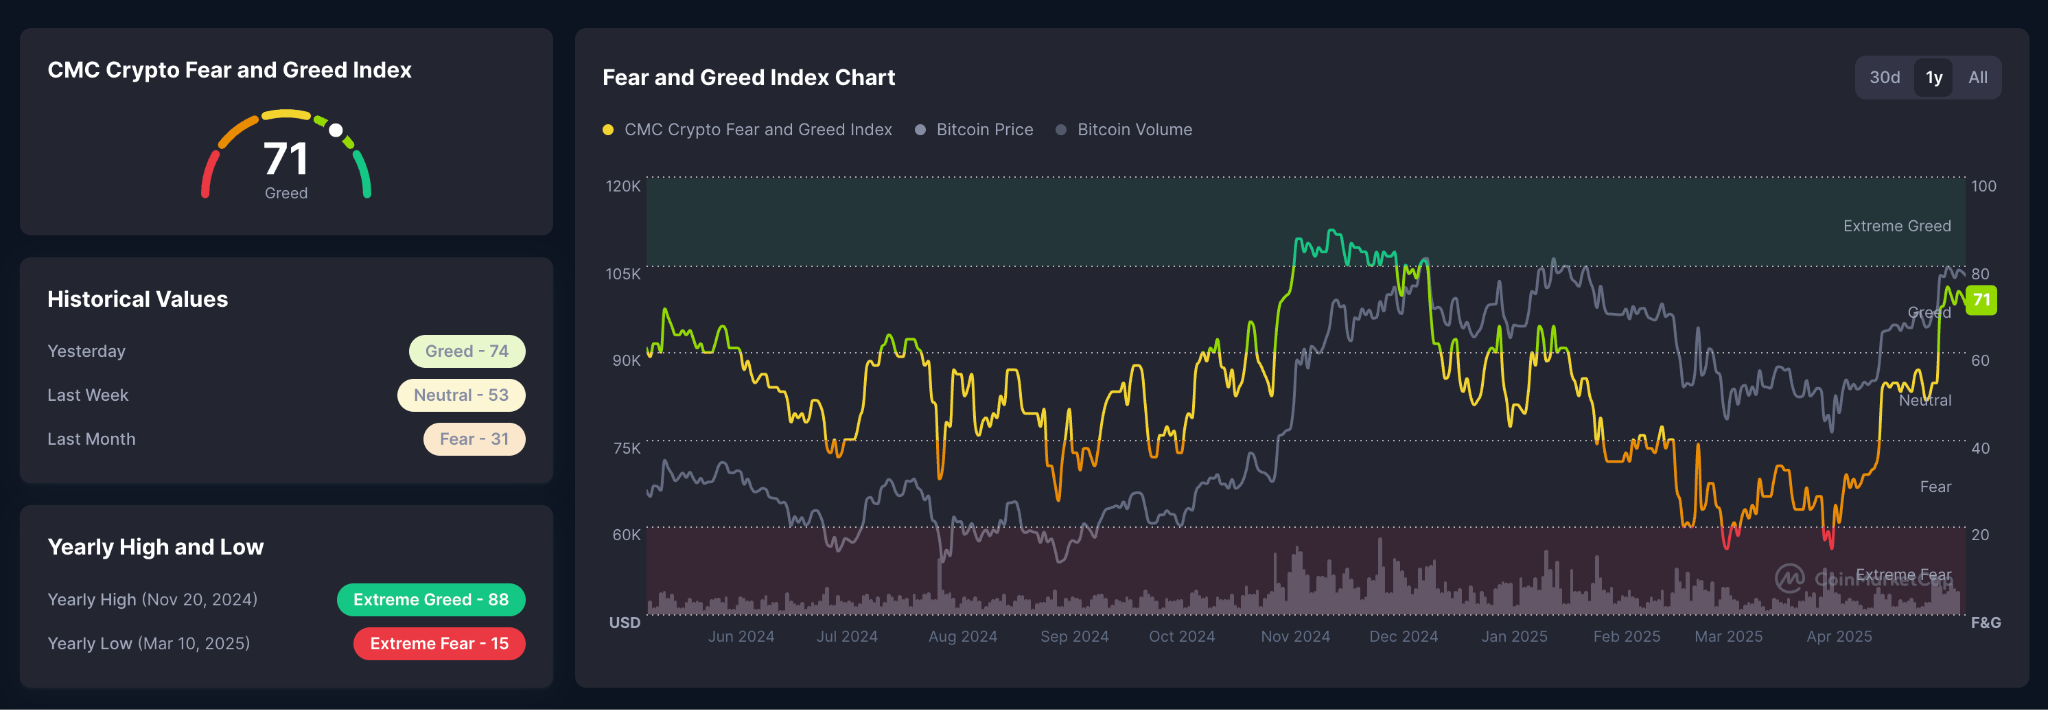
The Fear and Greed Index bounced from a record low of 15 (Extreme Fear) just a month ago to 73 at the time of writing after President Donald Trump showed a willingness to negotiate an agreement with China and other countries on tariffs.
Meanwhile, although the price action does not yet reflect it, the project has made two bullish announcements that could trigger a rally once the selling pressure eases.
Chainlink Partners with J.P. Morgan and Tron
Just minutes ago, the project announced that the Tron Network has now implemented Chainlink’s price oracles to power its $5.5 billion decentralized finance (DeFi) ecosystem.
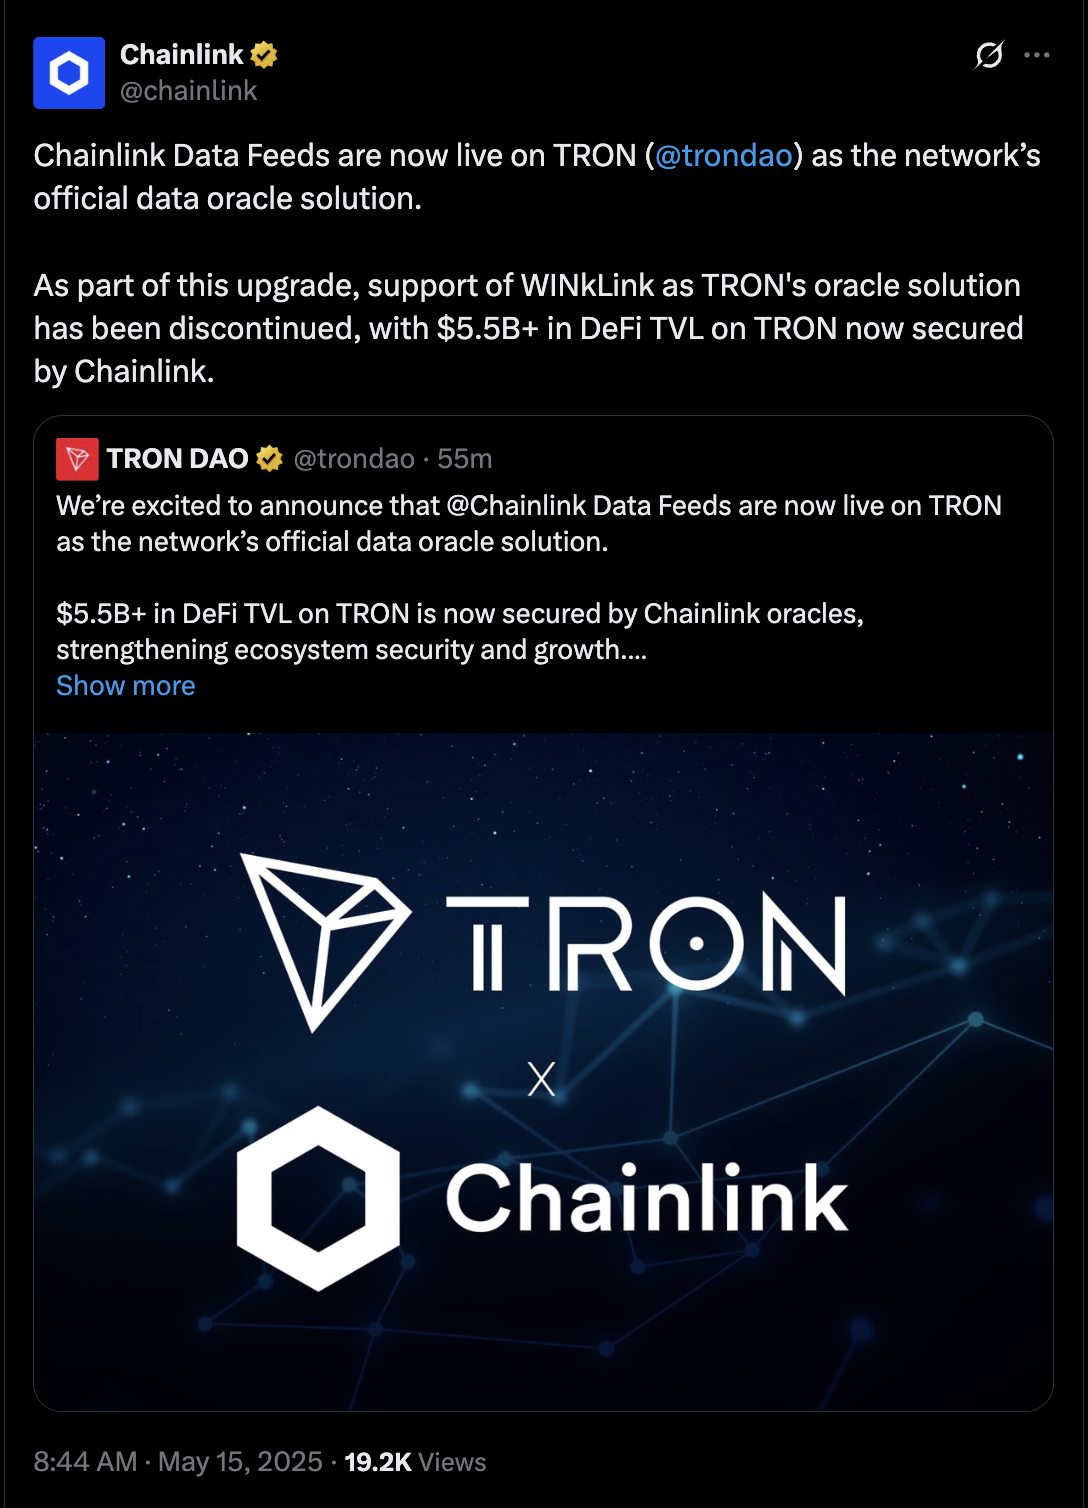
Chainlink’s data feeds provide real-time data points to decentralized protocols in the DeFi space to execute transactions based on reliable data.
As more blockchain projects embrace Chainlink’s solutions, the demand for LINK will rise as this is the utility token used to pay node operators for settling the transactions that use these solutions.
In addition, Chainlink announced a collaboration with Ondo Finance and Kinexys, a J.P. Morgan-backed payments solution provider.
A solution called Chainlink Runtime Environment will be used to provide J.P. Morgan’s institutional clients a flexible alternative to trade Ondo’s Short-Term U.S. Government Treasuries Fund (OUSG) through the Kinexys payments platform.
Institutional demand for Chainlink’s solutions, especially from financial institutions as big and influential as J.P. Morgan indicates that traditional banks are progressively testing decentralized platforms and their practical use cases to innovate and improve their operations.
LINK Broke Out Its Bullish Inverse H&S Pattern
Looking at LINK’s daily chart, an inverse head and shoulders pattern has formed in the past few weeks. On May 8, a strong breakout above the neckline of this technical setup occurred and this confirmed a bullish outlook for the token in the near term.
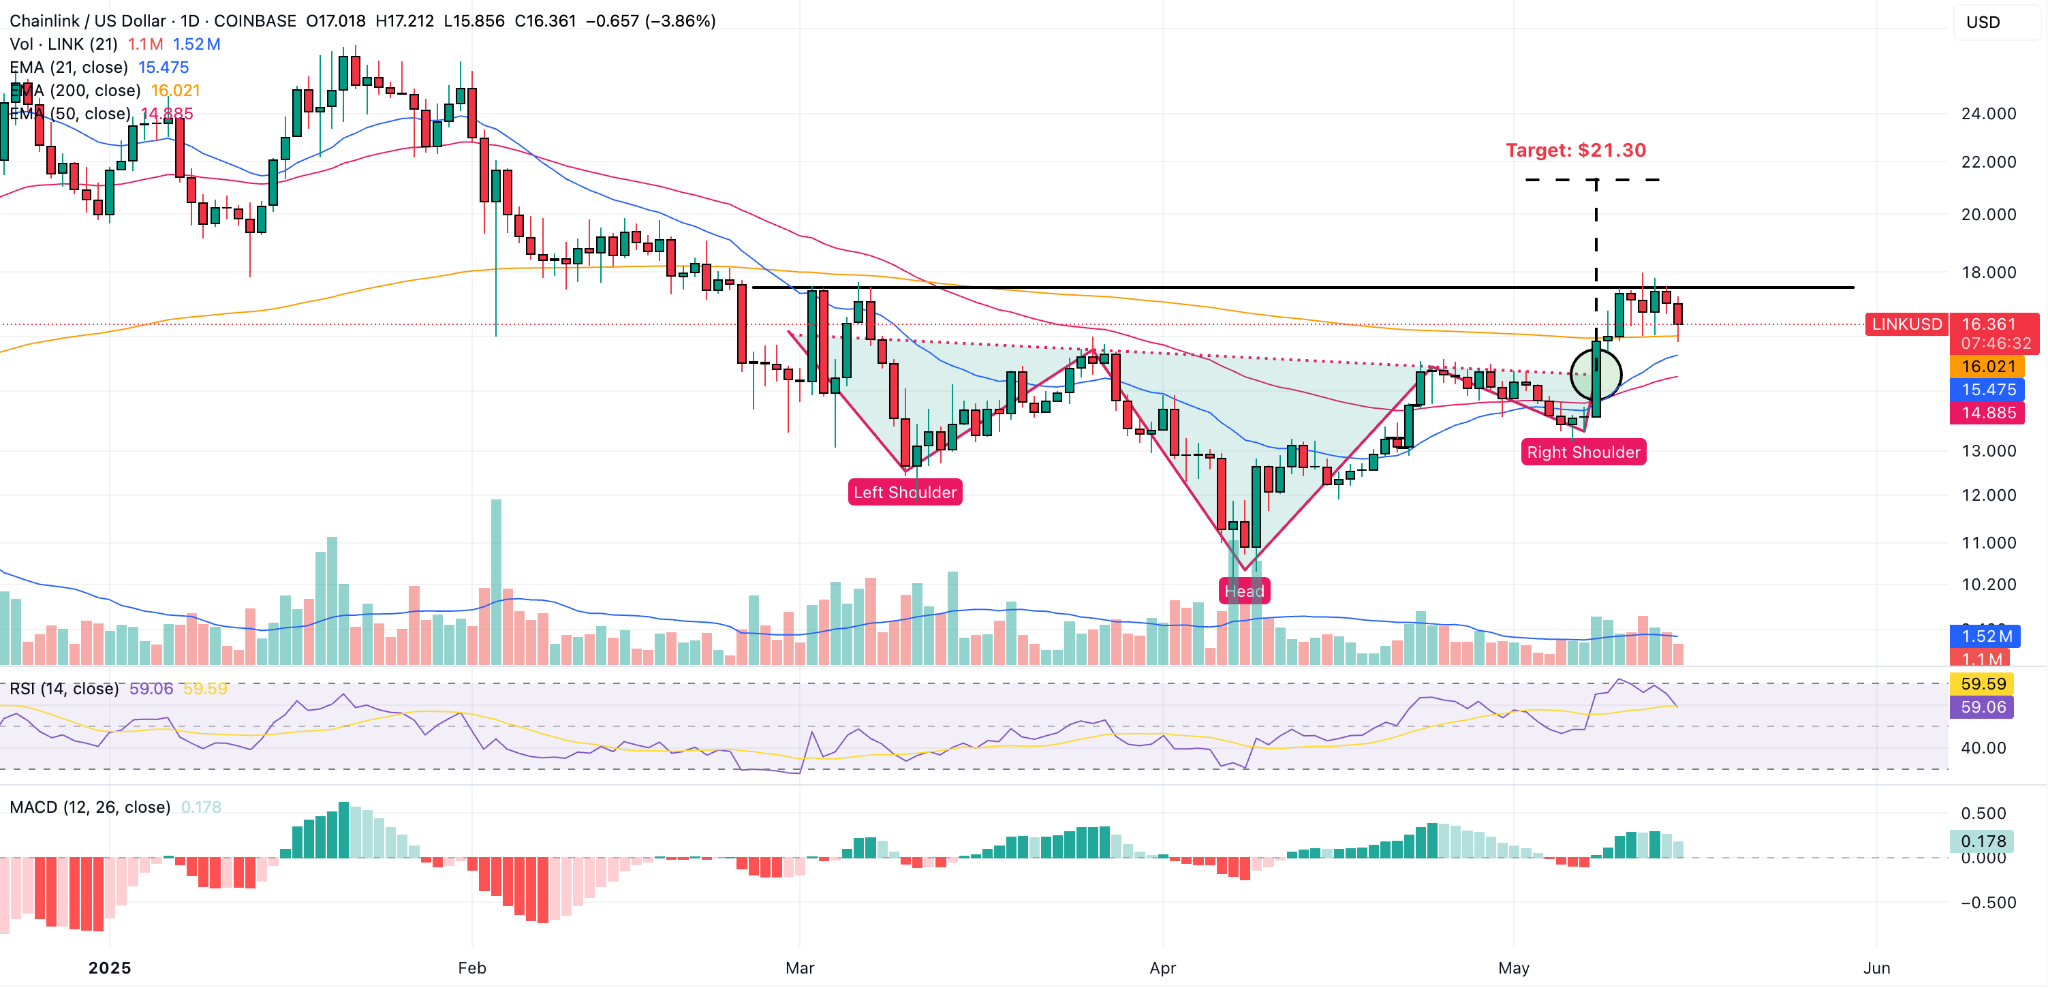
Although the H&S is not ‘textbook perfect’, the fact that strong volumes occurred at the neckline’s resistance may be considered evidence of the pattern’s relevance to market participants.
However, right after this breakout, the price hit what seems to be a short-term ceiling at $17.5.
This is not abnormal as the uptrend was already nearing overbought levels in the Relative Strength Index (RSI).
Market participants could give the rally a breather as early buyers take some profits off the table and late buyers take advantage of a correction to enter the rally.
A break above the 200-day EMA also favors a bullish outlook for LINK. In the next few days, the 21-day EMA would be the key support to watch in the daily chart. As long as the price stays above this marker, LINK’s outlook continues to be bullish.
Meanwhile, if a bullish breakout above the $17.5 occurs, a short-term target can be set at $21.30 based on the length of the pattern’s head, which is often used as a reference to estimate how strong the rally could be.
About the Author
Bob MasonChief Crypto Boss
123456789 30 He has written extensively for a broader audience and his current focus is on developments relating to the financial markets including, but not limited to currencies, commodities, alternative asset classes, and global equities.


Advertisement