
Advertisement
Advertisement
Crude Oil and Natural Gas Technical Analysis: OPEC Cuts and Trade Policy Shape Next Move
By:
Key Points:
- WTI Crude Oil (CL) hits the $65-$67 resistance within a negative trend.
- Natural Gas (NG) consolidates at the key support level at $3.
- US Dollar index (DXY) rebounds from the oversold region under bearish pressure.

WTI crude oil (CL) may recover as trade tensions between the US and China ease. The Trump administration is considering cutting tariffs from 145% to 50% and 65%. This potential rollback could stimulate global trade and lift oil demand.
At the same time, OPEC’s latest compensation plan supports oil prices. Eight member countries, including Iraq and Russia, will implement a combined production cut of 4.57 million barrels daily through mid-2026. Moreover, additional compensatory cuts of 378,000 barrels per day will help offset prior overproduction in May, preventing any significant supply surge.
The short-term outlook remains constructive despite today’s 2.5% dip in crude oil. However, the medium-term trend is neutral and requires a break above $72 to trigger a meaningful rally. Markets welcomed signs of a softer US stance. If tariff relief materializes and OPEC’s cuts are implemented as planned, oil prices could rebound steadily in the coming weeks.
WTI Crude Oil (CL) Technical Analysis
WTI Oil Daily Chart – Pivotal Zone
The daily chart for WTI crude oil shows a rebound from the oversold region, reaching the key long-term pivot zone between $66 and $67. The price may consolidate within this area before a directional move. The trend remains bearish, and this rebound reacts to oversold conditions. If the price fails to break above $65-$67, another decline in WTI crude oil may follow.

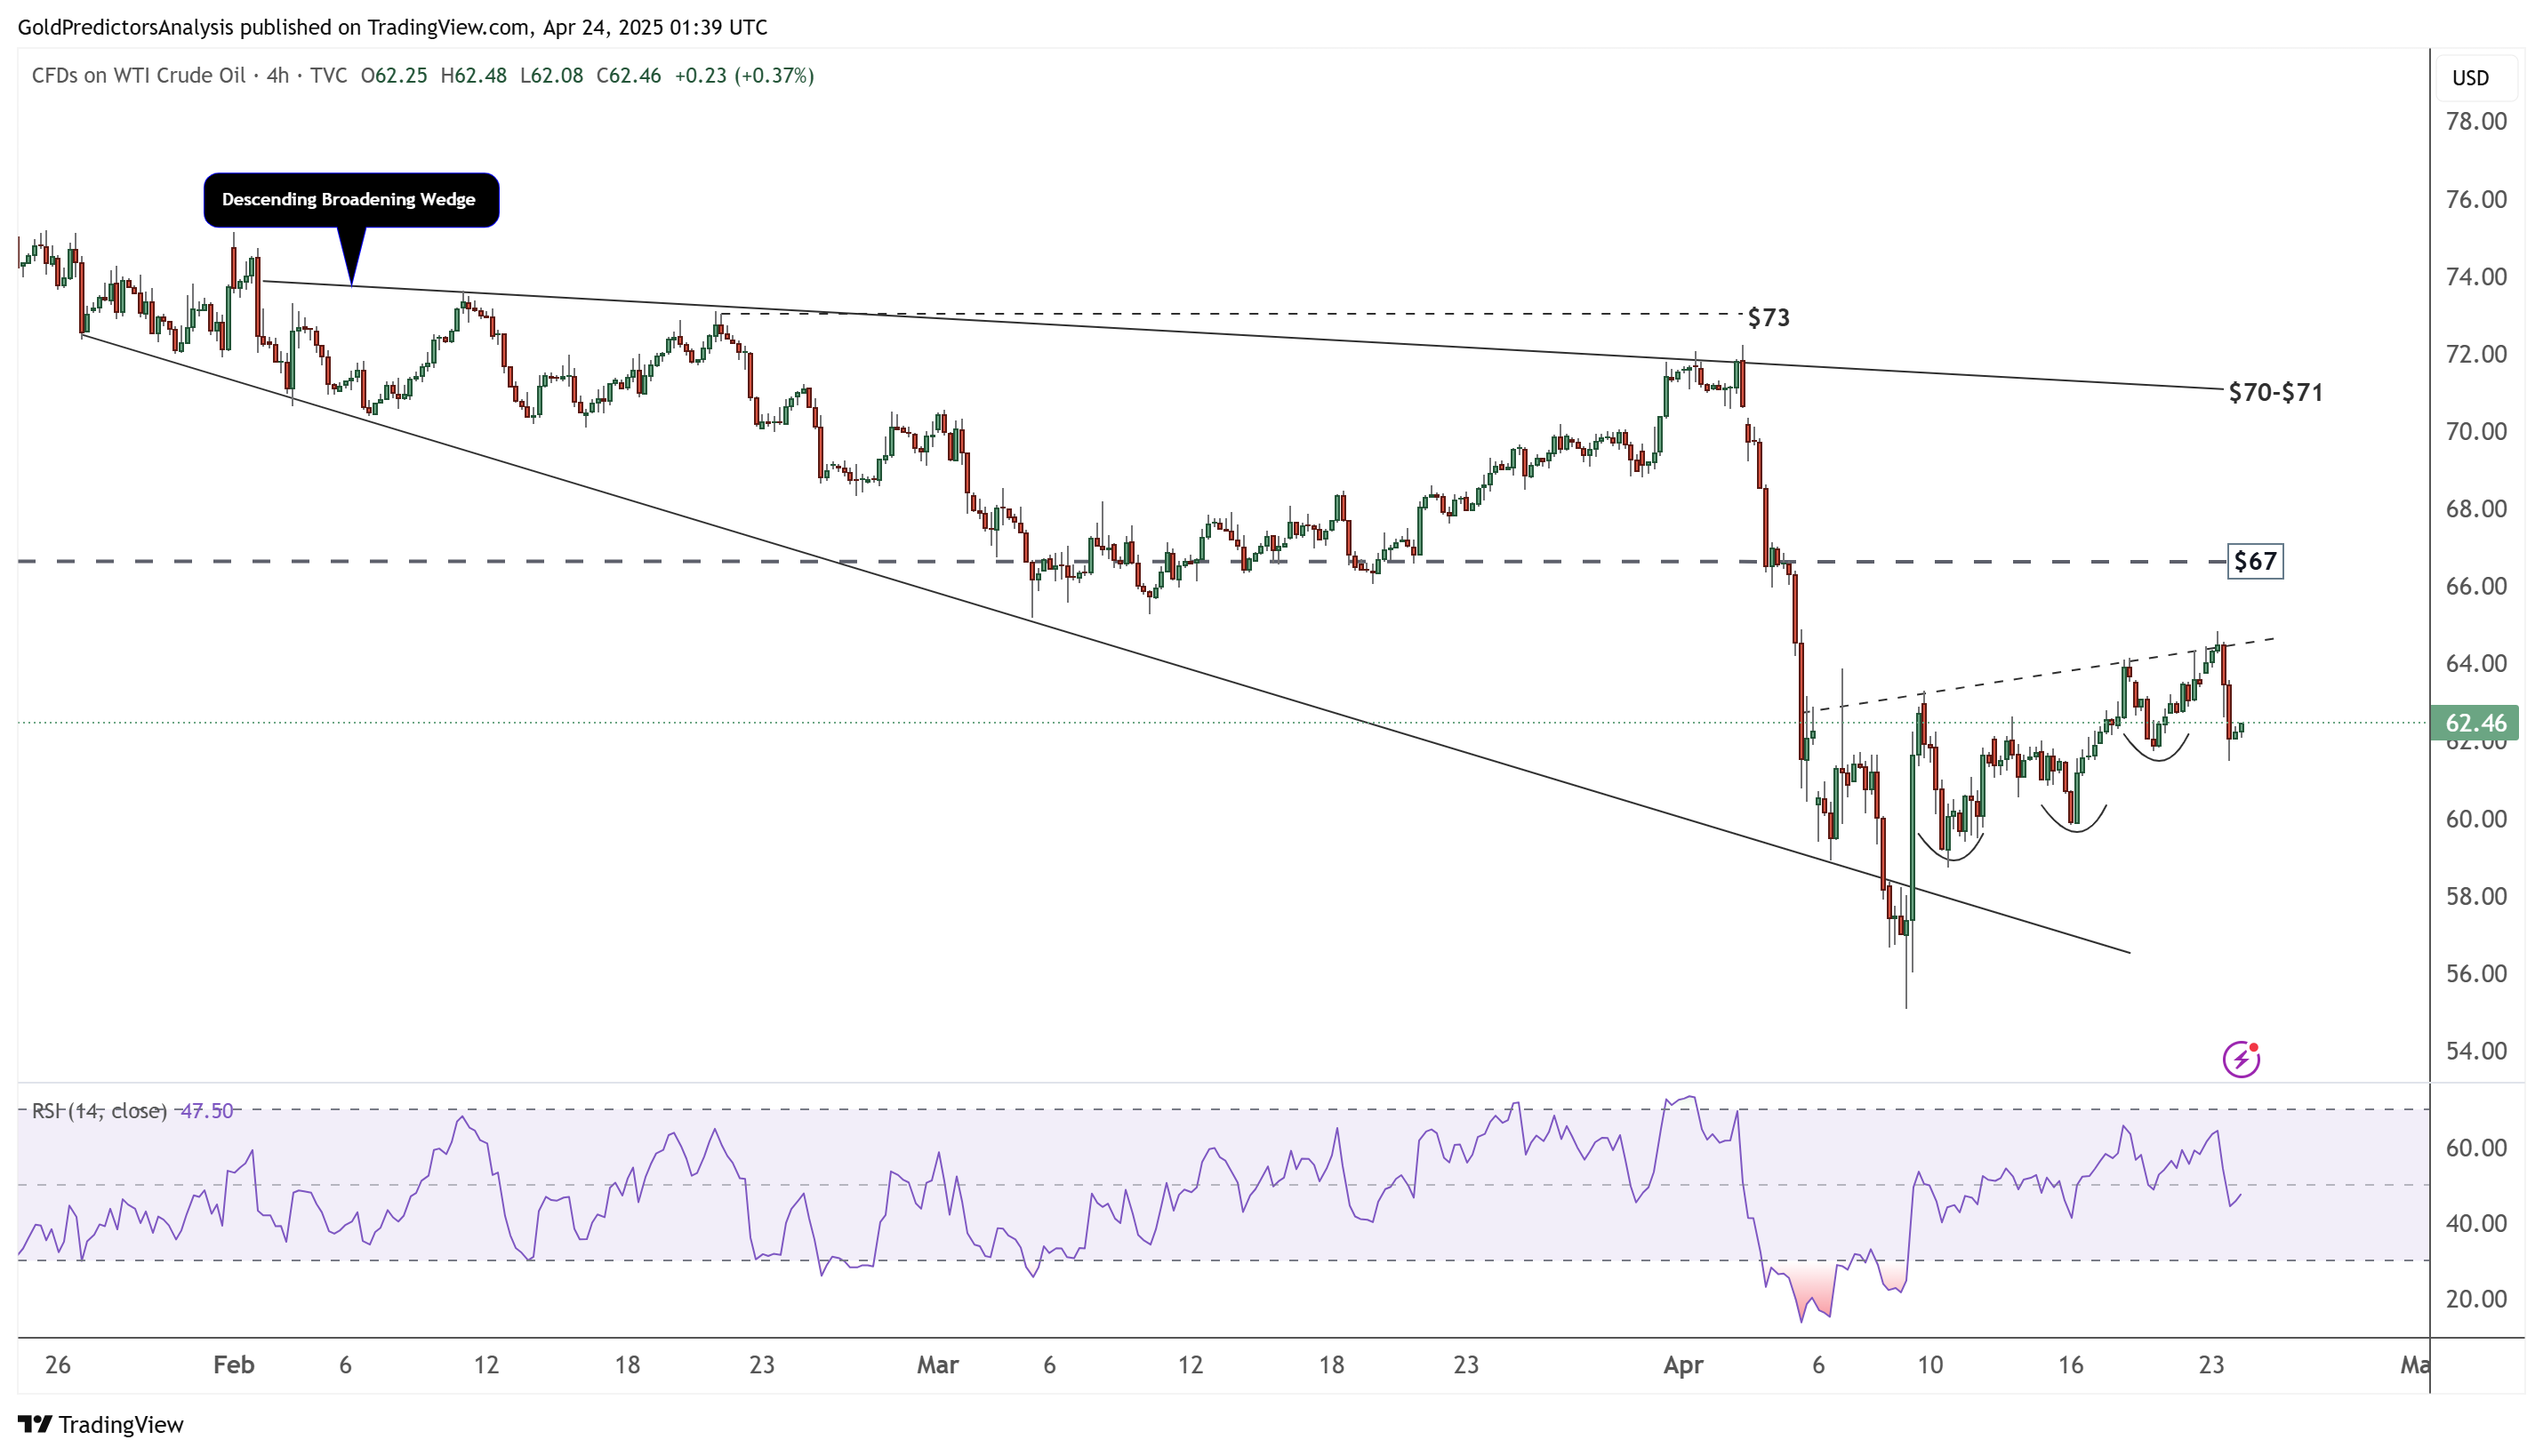
WTI Oil 4-Hour Chart – Descending Broadening Wedge
The 4-hour chart for WTI crude oil shows a rebound from the support of a descending broadening wedge pattern, pushing the price toward the $65 area. The RSI indicator suggests that oversold market conditions drove the rebound, as the price now approaches the key resistance zone of $65-$67.
Natural Gas (NG) Technical Analysis
Natural Gas Daily Chart – Key Level of $3
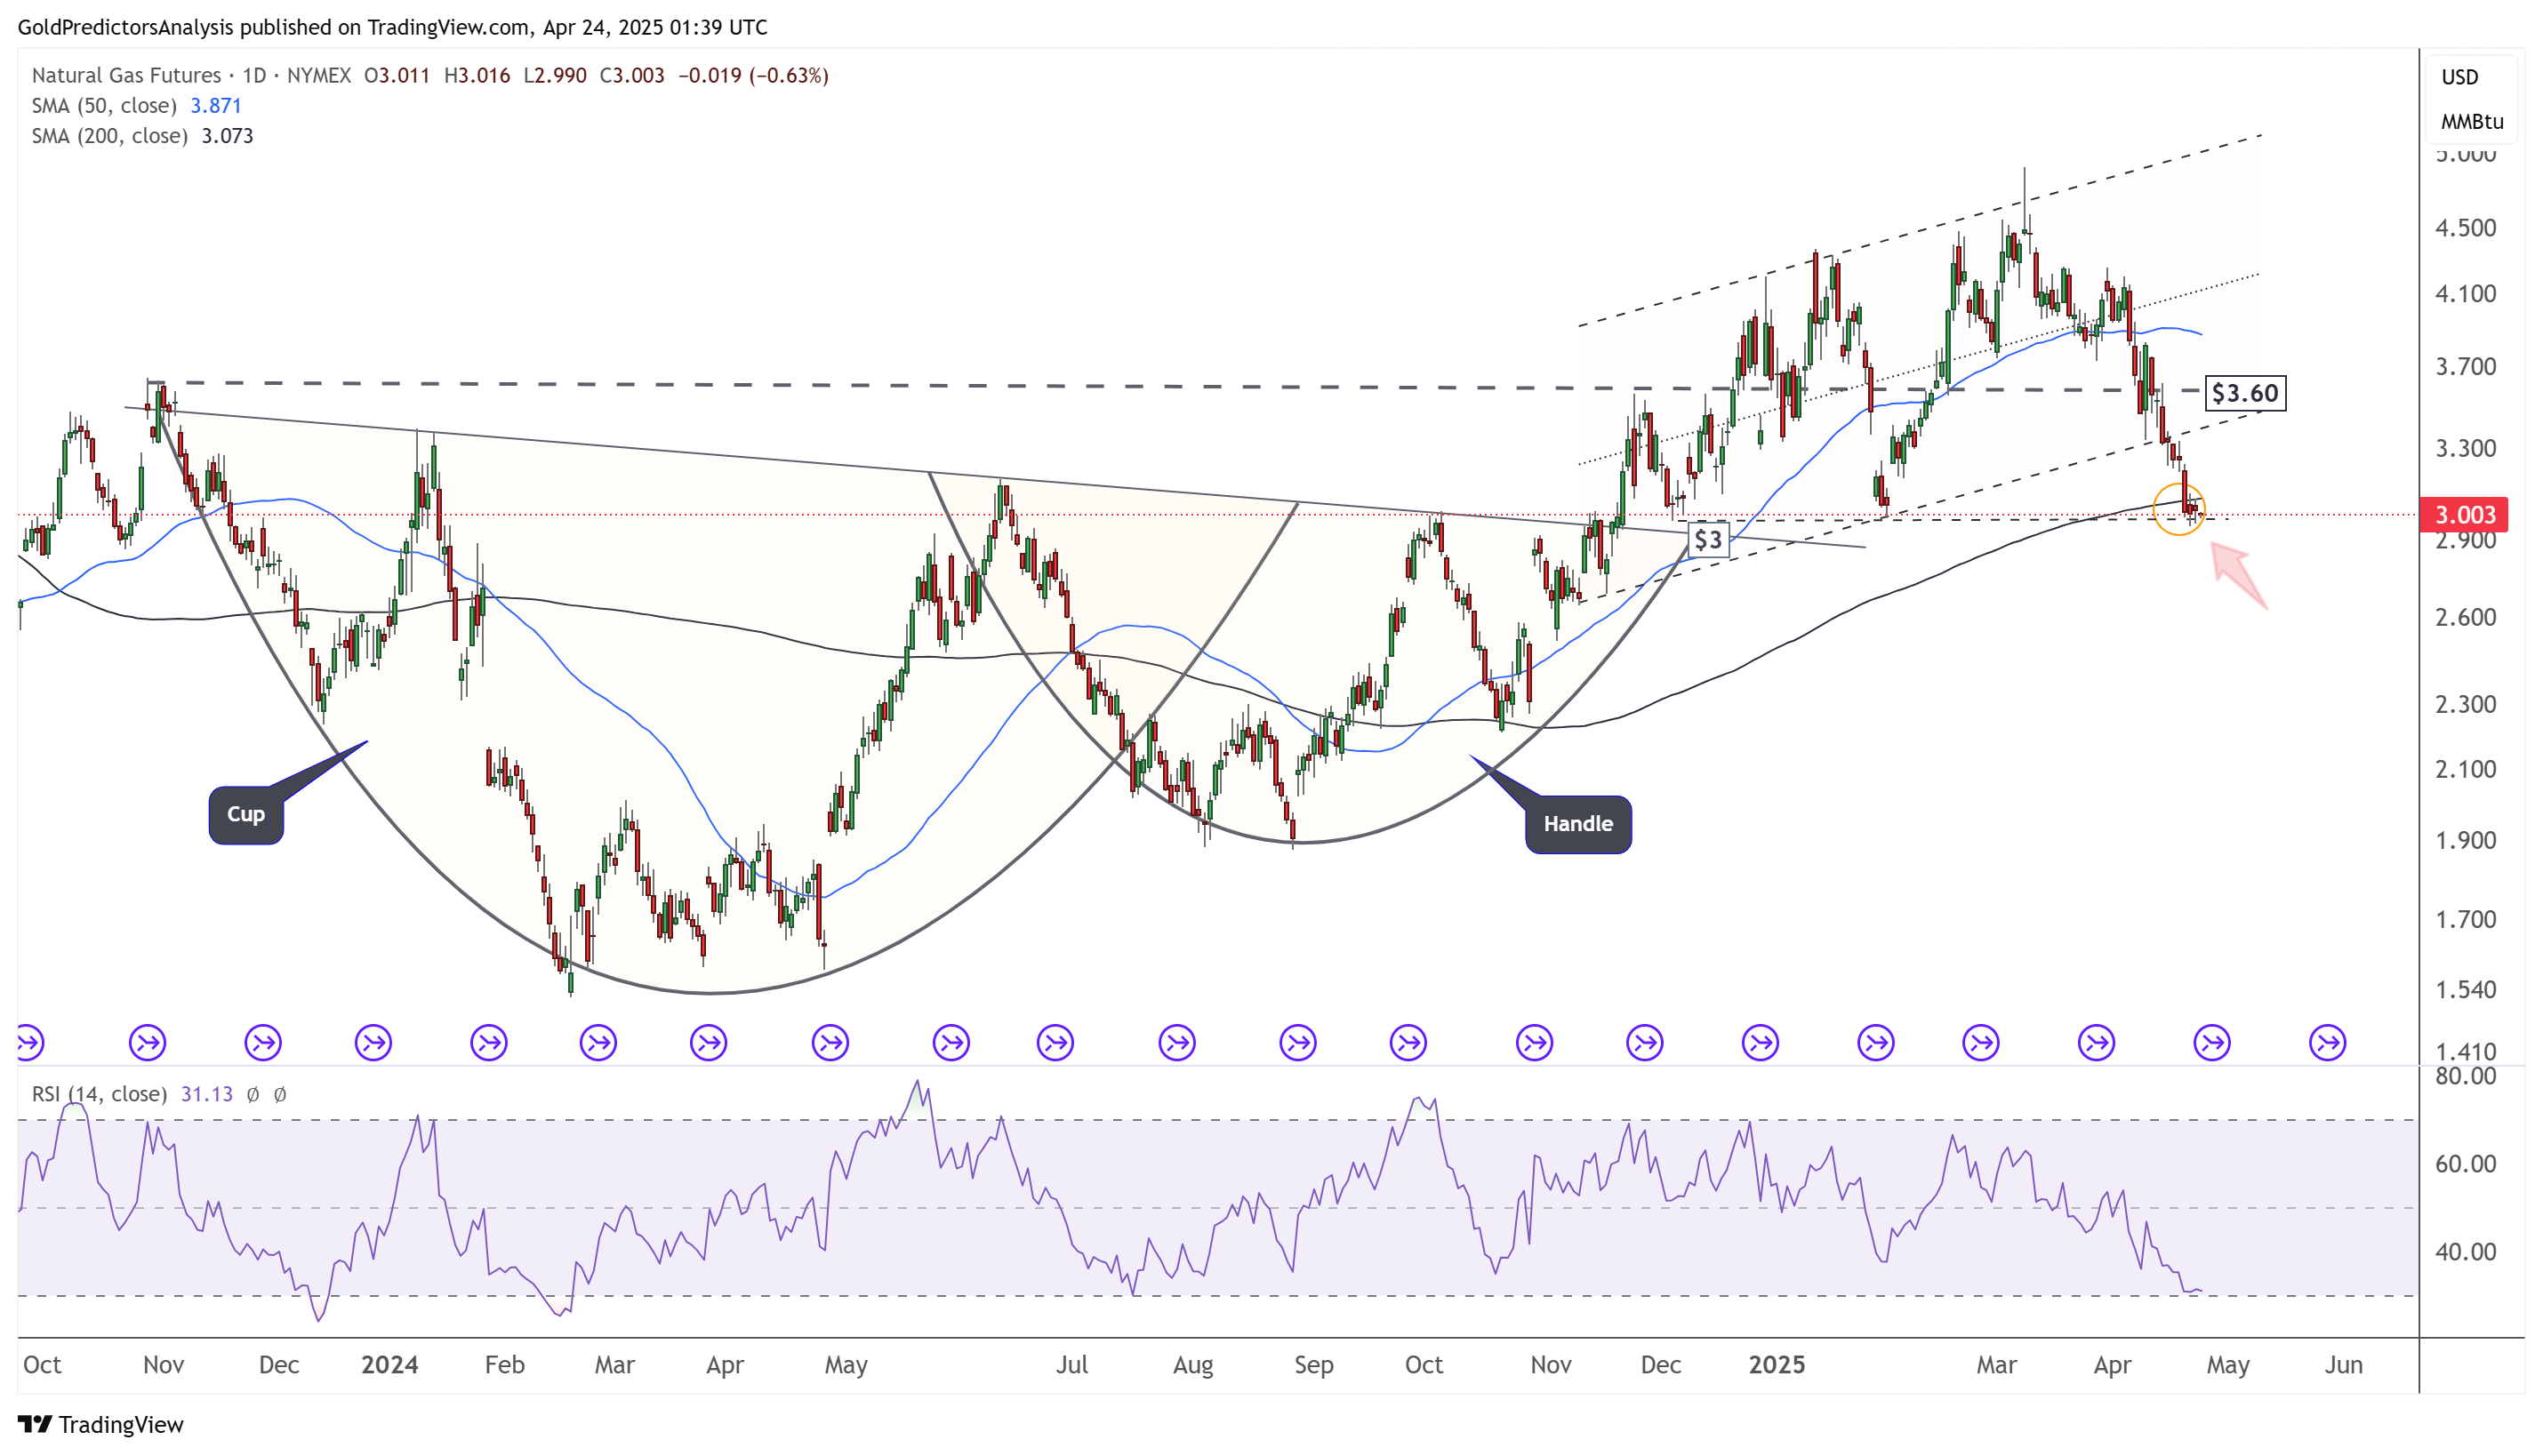
The daily natural gas (NG) chart shows that the price correction has reached the key support level at $3, which aligns with the 200-day SMA. The RSI is approaching 31, indicating the potential for a bottom to form in this region. The emergence of a cup and handle pattern suggests that the correction in natural gas prices may be limited and could present a buying opportunity.
Natural Gas 4-Hour Chart – Ascending Channel
The 4-hour chart for natural gas shows that the price has broken below the ascending channel and reached the key support at $3. This level is also significant on the daily chart. A break below this support could extend the correction toward $2.40. However, the overall trend remains bullish, and this pullback will likely present a buying opportunity with a potential upside toward $5.

US Dollar (DXY) Technical Analysis
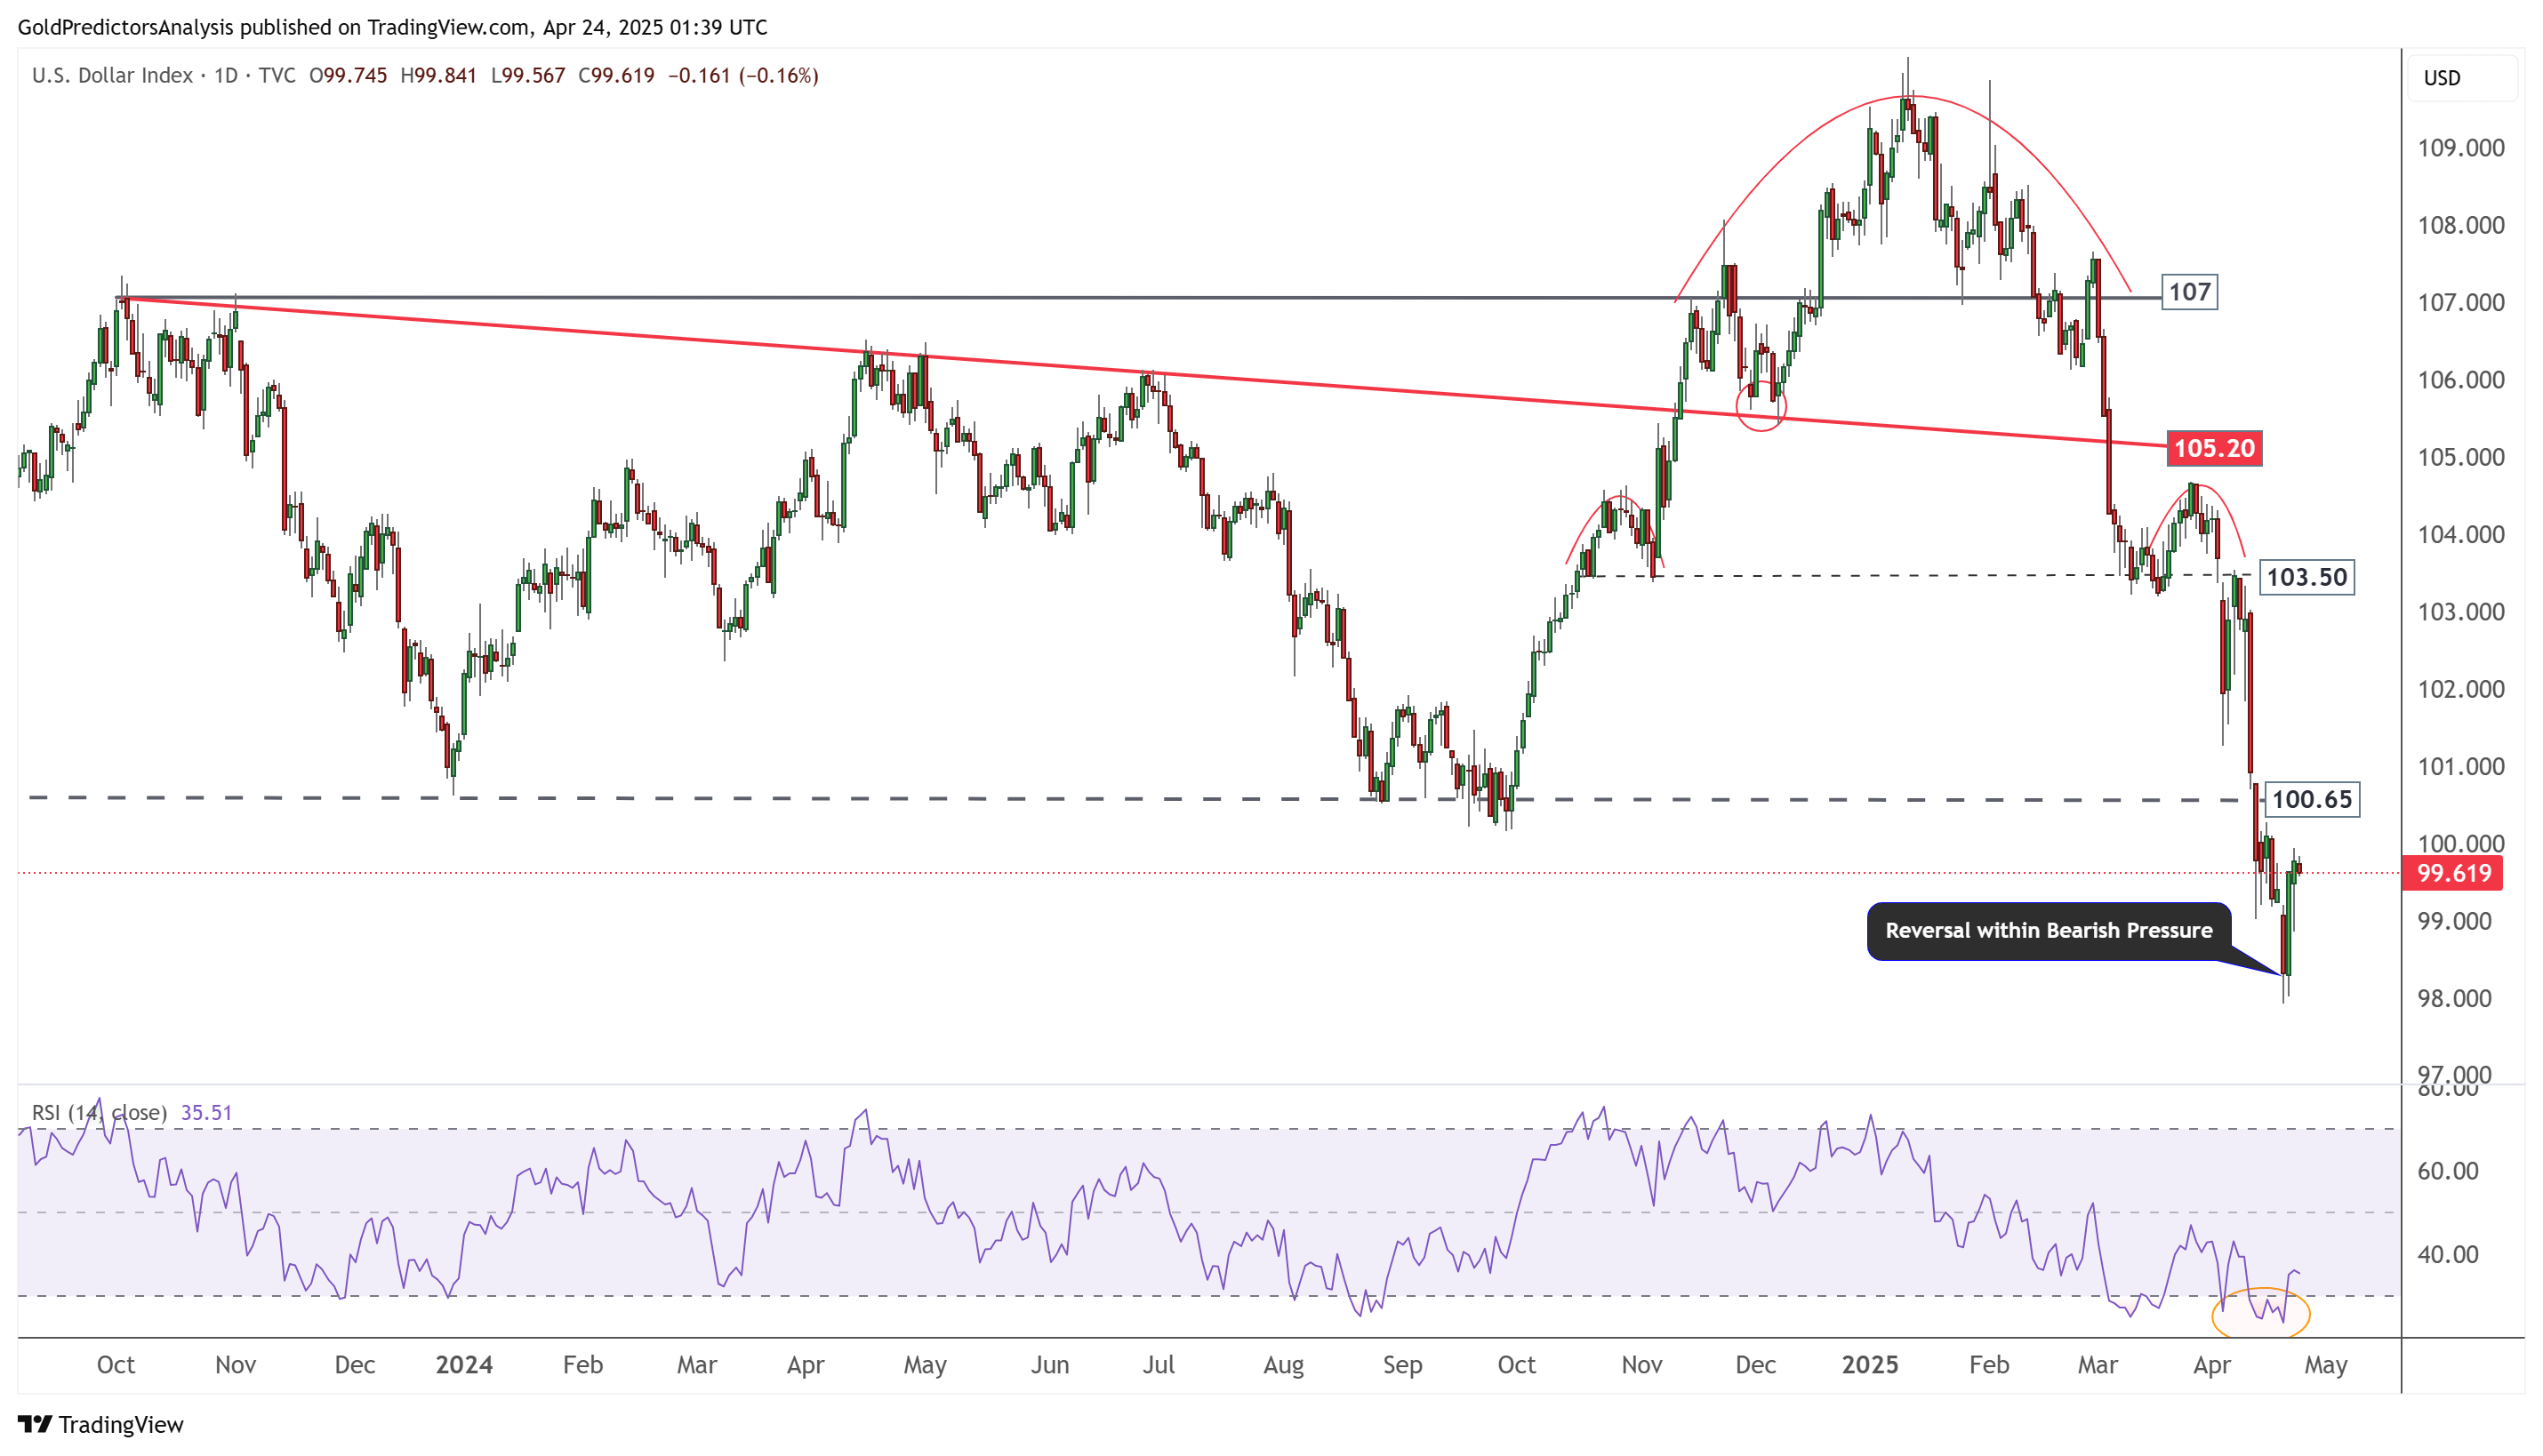
US Dollar Daily Chart – Bearish Pressure
The daily chart for the US Dollar Index shows a rebound from the long-term support level of 98 toward the resistance zone between 100 and 100.65. However, this rebound appears to be driven by extreme oversold market conditions. The index remains under bearish pressure, and this correction will likely result in another sharp decline.
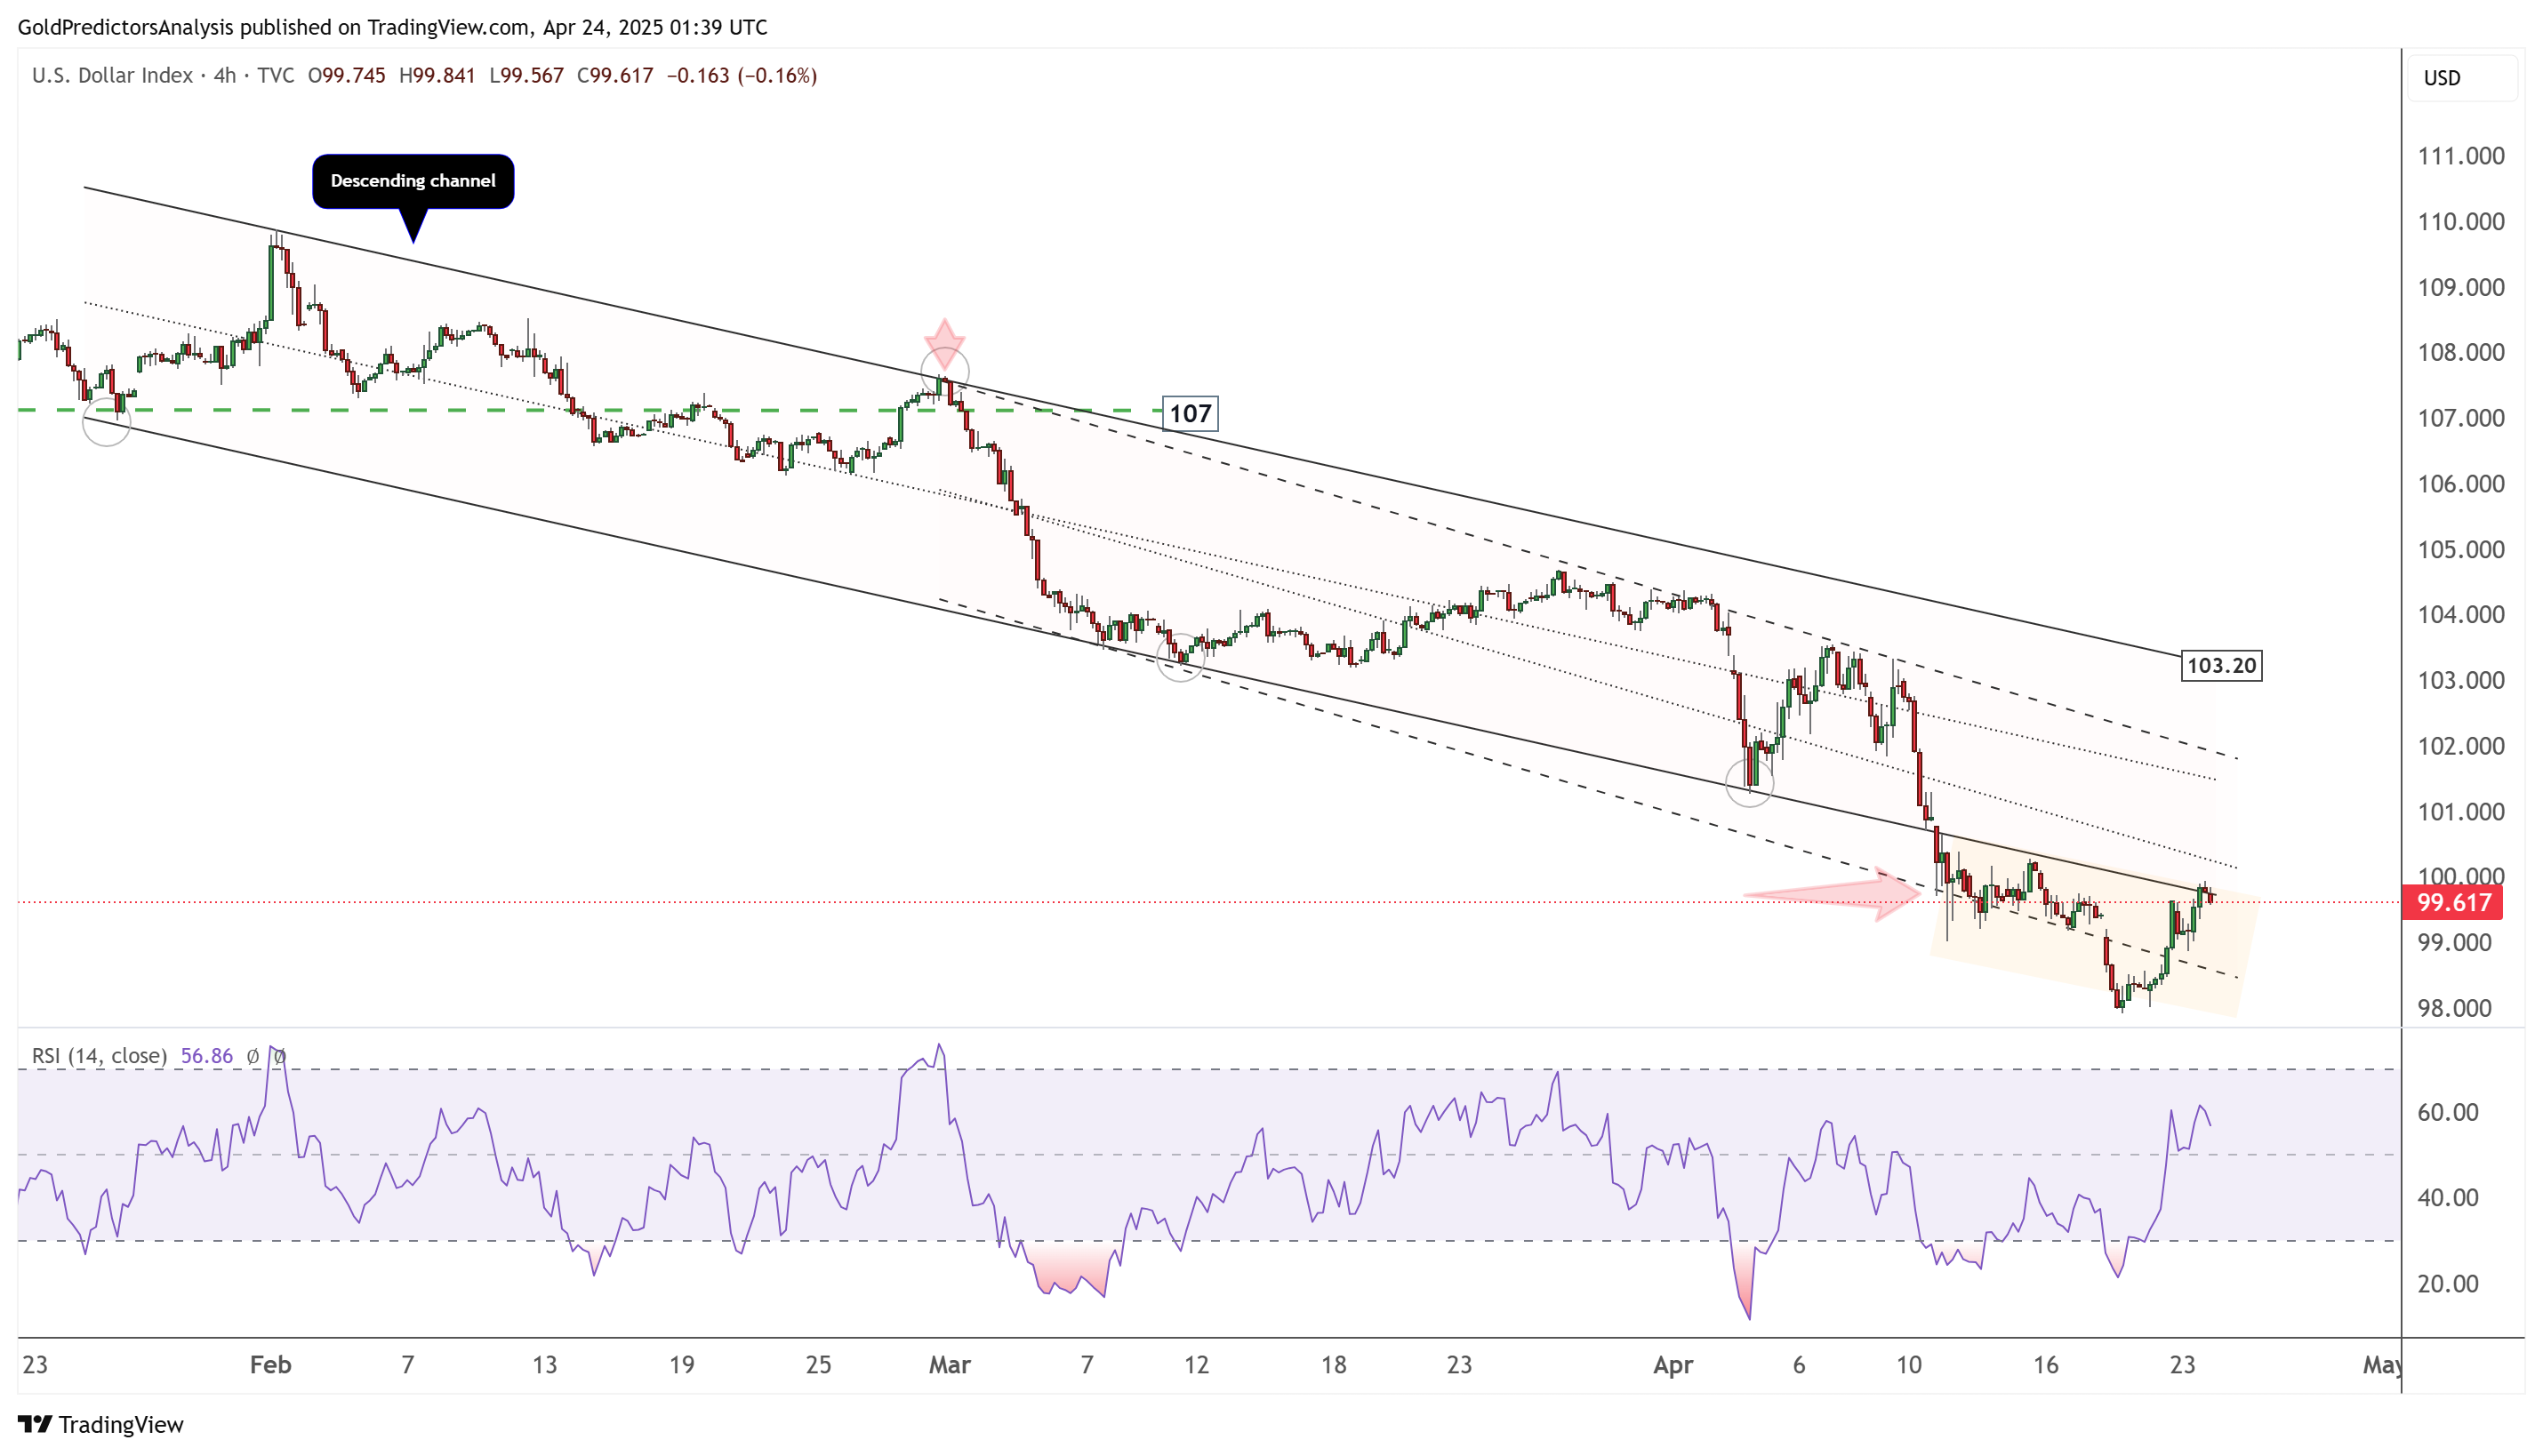
US Dollar 4-Hour Chart – Descending Channel
The 4-hour chart for the US Dollar Index shows that the index trades within the orange zone, defined by the intersection of a descending channel. This zone reflects intense bearish pressure. Although the index has rebounded slightly, it remains within the bearish structure, suggesting another decline may follow.
About the Author
Bob MasonChief Crypto Boss
123456789 30 He has written extensively for a broader audience and his current focus is on developments relating to the financial markets including, but not limited to currencies, commodities, alternative asset classes, and global equities.


Advertisement