
Advertisement
Advertisement
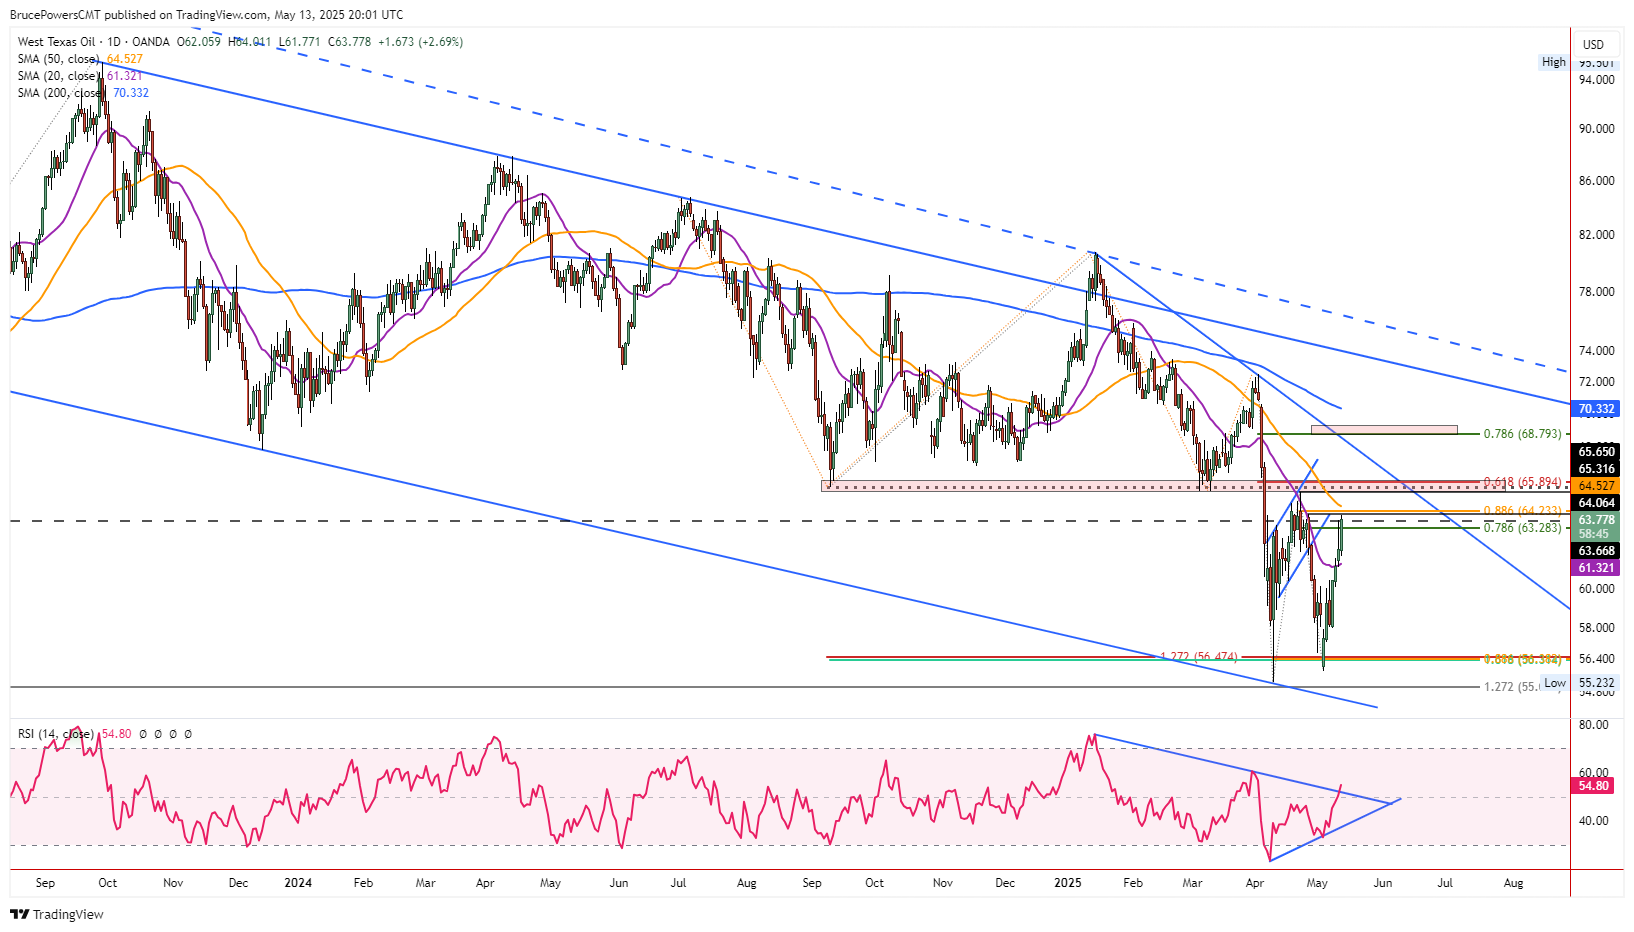
Crude Oil Price Forecast: Bullish Momentum Builds as Crude Nears $64.06 Barrier
By:
Momentum is back in crude oil, as price action targets a breakout above $64.06, reinforcing bullish sentiment and potentially challenging the downtrend.
Crude oil rallied right up to $64.01 on Wednesday before stalling its advance. That was a successful test of resistance at the three-week high of $64.06, the next key price level for crude oil to encounter. Of course, it has greater potential significance since it is a weekly high and because a rally above that high would show continuing strength in the price of crude oil in the face of potential resistance. Also, a rally above last week’s high would give another indication of a bullish reversal in the weekly time frame. Since the weekly pattern takes precedence over the daily, that would be bullish for the daily pattern as well.
Bulls in Charge
Tuesday’s advance becomes more interesting when noticing the relatively bearish potential shooting star candle pattern from yesterday. It looks like bullish momentum went away. Now that it is back the momentum of the upswing has the potential to intensify. As the price of crude rises and takes out higher potential resistance zones, the potential for it to continue to rise improves.
Not only because of the potentially bearish behavior on Monday but also the higher daily high and higher low established today along with a likely strong bullish closing price. At the time of this writing crude oil continues to trade near the high of the day and looks likely to close the day in the top third of the day’s trading range. Of greater significance would be a daily close above Monday’s high of $63.74.
Strong Demand Keep Prices Elevated
Since the price of crude is likely to end the day near the weekly resistance high of $64.06, that bullish behavior may extend. It also puts that price level front and center for the next bullish breakout. If a weekly breakout can be confirmed and sustained, starting with a daily close above $64.06, higher price targets begin to become more likely. Notice that Monday’s low was a successful test of the 20-Day MA as support since the decline below it at the beginning of April.
Subsequent bullish signs today confirm the bullish reversal from the line. That establishes a launching pad to test resistance around the 50-Day MA, currently at $63.53, or head higher. The most recent swing high at $65.32 is another key price level, as it was a lower swing high and therefore partly defined by the downtrend pattern.
For a look at all of today’s economic events, check out our economic calendar.
About the Author
Bruce Powerscontributor
Bruce has been involved in the financial markets for over 20 years, as an analyst, trader, educator, and writer.


Advertisement