
Advertisement
Advertisement
Crude Oil Price Forecast: Downtrend Intact Despite Short-Term Reversal
By:
Crude oil remains in a bearish retracement despite a short-term bounce. Key resistance levels near $73.15 may cap gains, while downside potential remains open.
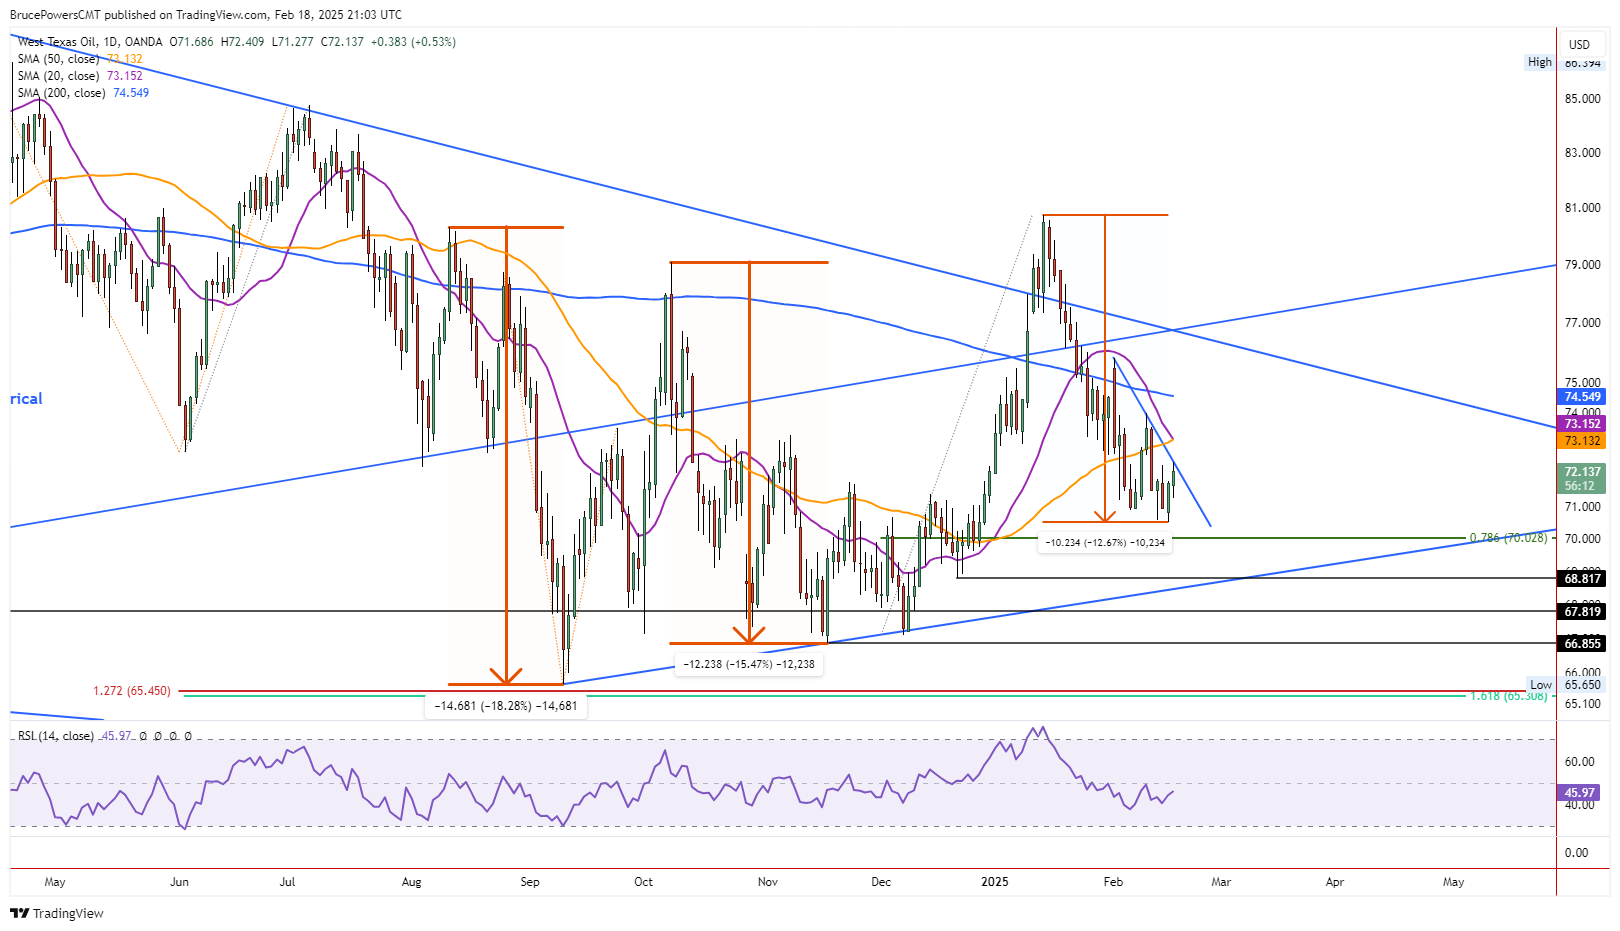
Crude oil remains in a bearish retracement that may have further to fall. However, on Tuesday, it triggered a bullish reversal by surpassing Monday’s high of $70.52. The high for the day at the time of this writing was $71.27 and trading continues near the highs of the day. If the day ends with crude in the top third of the day’s trading range, there is a good chance it can test higher potential resistance levels. On Monday, a minor new retracement low of $70.52 was established.
Bearish Correction May Have More to Go
The price of crude oil dropped by $10.23, or 12.7%, from the January 15 high of $80.76. However, it remains in a downtrend with lower swing highs and lower swing lows. Moreover, last week ended at the lowest weekly closing price for crude in seven weeks. A bearish shooting star candlestick pattern formed for the week and the closing price of $70.95 was almost below the prior week’s low at $70.91. This indicates that downward pressure remains.
Moving Averages Point to Possible Resistance
Moving averages tell a story as the 20-Day MA (purple) is touching the 50-Day MA (orange) and is on track to possibly drop below it, which is a bearish sign. The expectation is for this bounce to eventually encounter resistance and the price of crude to turn back down.
Since the two moving averages are converging, they represent an idea price zone for a test of resistance. Currently, the 50-Day line shows $73.13, and the 20-Day line marks $73.15. Although there has been a healthy correction so far, previous measured moves keep open the possibility of crude testing lower potential support levels before the correction is complete.
Bearish Measured Moves
Two of the most recent bearish corrections are marked on the chart. The first in August 2024 ended with an 18.3% decline in the price of crude oil, while the next bearish correction that began in October completed a 15.5% decrease. There are two lower potential targets for crude oil indicated on the chart. The first is the completion of a 78.6% retracement at $70.03. A bit lower is the three-point rising trendline, that shows dynamic potential resistance price levels. Crude oil would be down by 13.3% from the January swing high at that point.
For a look at all of today’s economic events, check out our economic calendar.
About the Author
Bruce Powerscontributor
Bruce has been involved in the financial markets for over 20 years, as an analyst, trader, educator, and writer.
Latest news and analysis


Advertisement