
Advertisement
Advertisement
Crude Oil Price Forecast: Faces Pullback Following Double Bottom Breakout
By:
Crude oil shows bullish continuation potential, targeting $68.98, despite today’s bearish candlestick hinting at a possible short-term pullback from recent breakouts.
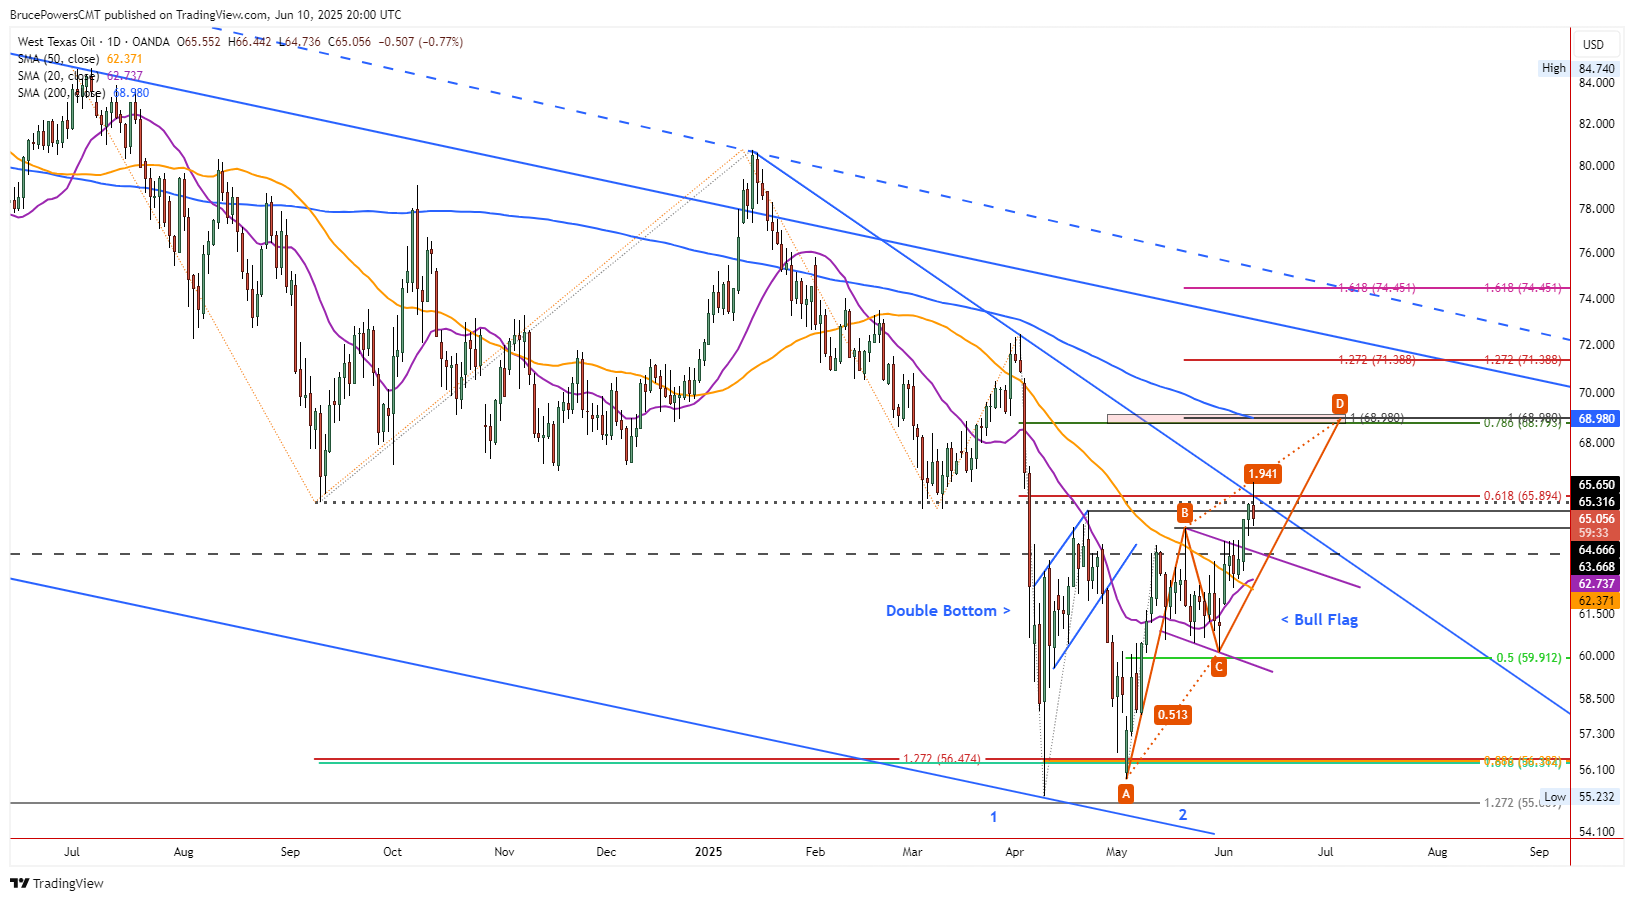
Crude oil rose above a 61.8% Fibonacci retracement level at $65.89 and a downtrend line on Tuesday, before finding resistance following the day’s high of $66.44. Sellers then took over, driving crude to new lows for the day. At the time of this writing, a low of $64.93 was reached but trading continues near the lows of the day. Despite showing strength due to key breakouts, both today and yesterday, crude oil looks set to end the day with a bearish shooting start candlestick pattern. The pattern will trigger on a drop below today’s low, once today’s trading session is finished.
Short-term Weakness Follows Upside Reversal
Although today’s price action may be short-term bearish, bull signals generated over the past few days show improving demand and an increased chance that the price of crude oil can continue its rising trend. On Friday, a bullish trend continuation signal was confirmed by a daily close above the swing high at $64.67 (B). That close also confirmed a rising ABCD pattern that shows an initial target at $68.98. At that price the two rising measured moves, labeled AB and CD, will show symmetry as the change in price for the CD leg will match what was seen in the AB advance. A potential key pivot level would therefore be identified.
Confluence Zone Points to $68.79
But what makes that price zone interesting is not just the ABCD pattern target. There are two other price levels identified nearby. The 78.6% Fibonacci retracement is at $68.79, and the 200-Day MA is now at $68.98. Sometimes, when there is a confluence of indicators pointing to a similar price area, that area can act like a magnet and attract the price towards it. Whether it is eventually reached or not, it does show higher potential.
Double Bottom Potential Reversal
Furthermore, a double bottom trend reversal pattern confirmed on Monday with a rally above $65.32, the swing high from late April. That swing high ended the first rally following the April swing low at $55.23. Since the trend reversal pattern just triggered, there is strong potential for further upside, unless the breakout shows signs of failure. And that would only begin to be seen on a drop below the 20-Day MA, now at $62,73.
For a look at all of today’s economic events, check out our economic calendar.
About the Author
Bruce Powerscontributor
Bruce has been involved in the financial markets for over 20 years, as an analyst, trader, educator, and writer.


Advertisement