
Advertisement
Advertisement
Dogecoin (DOGE) Remains Flat Despite Elon Musk-Fueled Dogefather Rally
By:
Key Points:
- Descending wedge breakout signals potential trend reversal.
- Fibonacci levels confirm key resistance and support zones.
- Elliott Wave count suggests an imminent impulsive rally.

Elon Musk once again triggered excitement in the meme coin space, referencing Dogecoin in a tweet that fueled a rally in the Dogefather (DOGEF) token. Yet, despite the surge in DOGEF, Dogecoin itself has remained relatively flat, struggling to gain bullish momentum. This raises a crucial question: Why hasn’t DOGE followed suit, and could a breakout be on the horizon?
The technical charts suggest that DOGE is consolidating within a descending wedge, a structure that often precedes a breakout. Additionally, key Fibonacci levels and Elliott Wave counts indicate a potential reversal. While social media hype alone hasn’t been enough to drive DOGE higher, could its technical setup finally align with renewed bullish sentiment? Let’s analyze the price action and forecast what’s next for DOGE.
Elon Musk Sparks Dogefather Token Rally
Elon Musk has once again influenced the crypto market, triggering a significant surge in the Dogefather (DOGEF) token. Following a tweet referencing Dogecoin, speculative interest in DOGEF skyrocketed, leading to a rapid price increase.
The rally reflects the continued impact Musk’s social media activity has on meme coins, reinforcing his status as a key market influencer. However, despite the initial spike, analysts caution about potential volatility, as sharp corrections have often followed previous Musk-driven surges.
This event underscores the speculative nature of meme-based cryptocurrencies, where price movements are heavily tied to hype and social media trends rather than fundamental developments. Investors should remain vigilant as DOGEF’s momentum could shift rapidly depending on broader market sentiment and further comments from Musk.
DOGE Price Analysis
Dogecoin (DOGE) has been trading within a descending wedge pattern since its all-time high from Dec. 8 at $0.486, completing a corrective wave structure labeled A-B-C. The price recently found support near the 0.618 Fibonacci retracement level at $0.24088, marking a potential turning point.
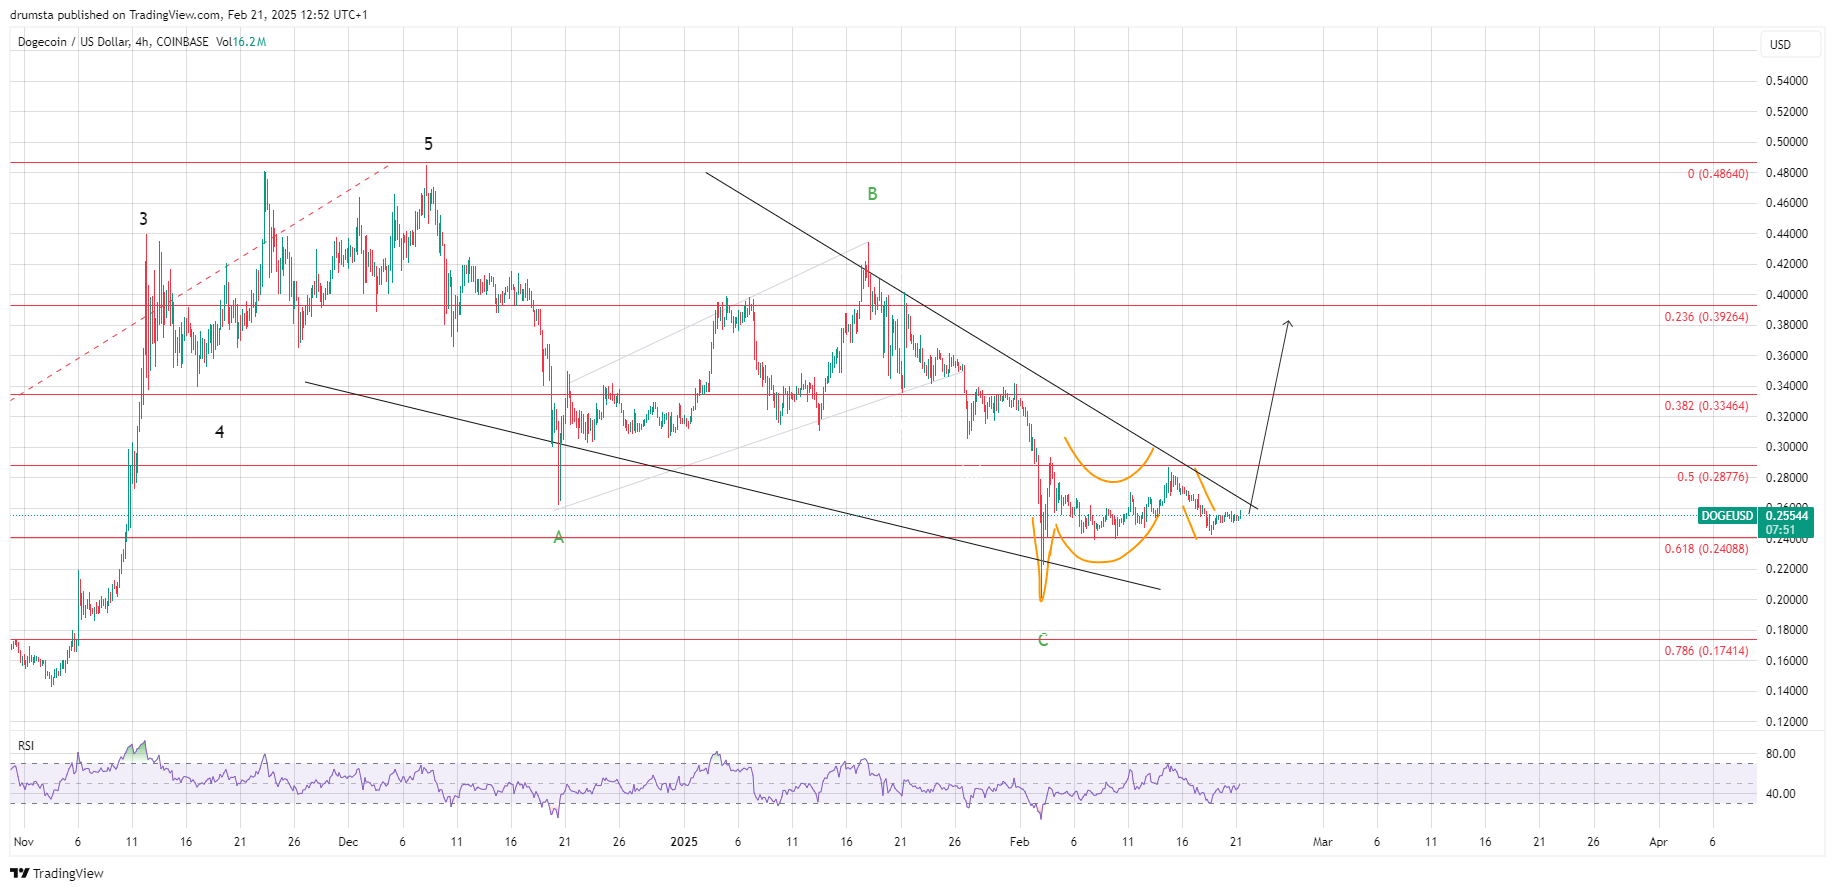
The presence of a well-defined inverse cup and handle pattern within this wedge further reinforces a bullish reversal scenario.
From an Elliott Wave perspective, DOGE appears to have completed a five-wave impulse, followed by a corrective ABC pattern. The downward structure has now reached its terminal phase, and a breakout above the upper wedge resistance would signal a fresh bullish cycle.
The Relative Strength Index (RSI) on the 4-hour timeframe remains in neutral territory but has started to rise, suggesting increasing bullish momentum. A successful breakout from the wedge could target the next major resistance at $0.28776 (0.5 Fibonacci retracement), followed by $0.33464 (0.382 Fibonacci).
A rejection here would invalidate the bullish outlook and could lead to a retest of lower support levels.
DOGE Price Prediction
The 1-hour chart provides a closer look at the developing Elliott Wave count, highlighting a potential five-wave impulsive move. The corrective wave (ii) seems to have completed its pullback near $0.24088, aligning with the 0.618 Fibonacci level.
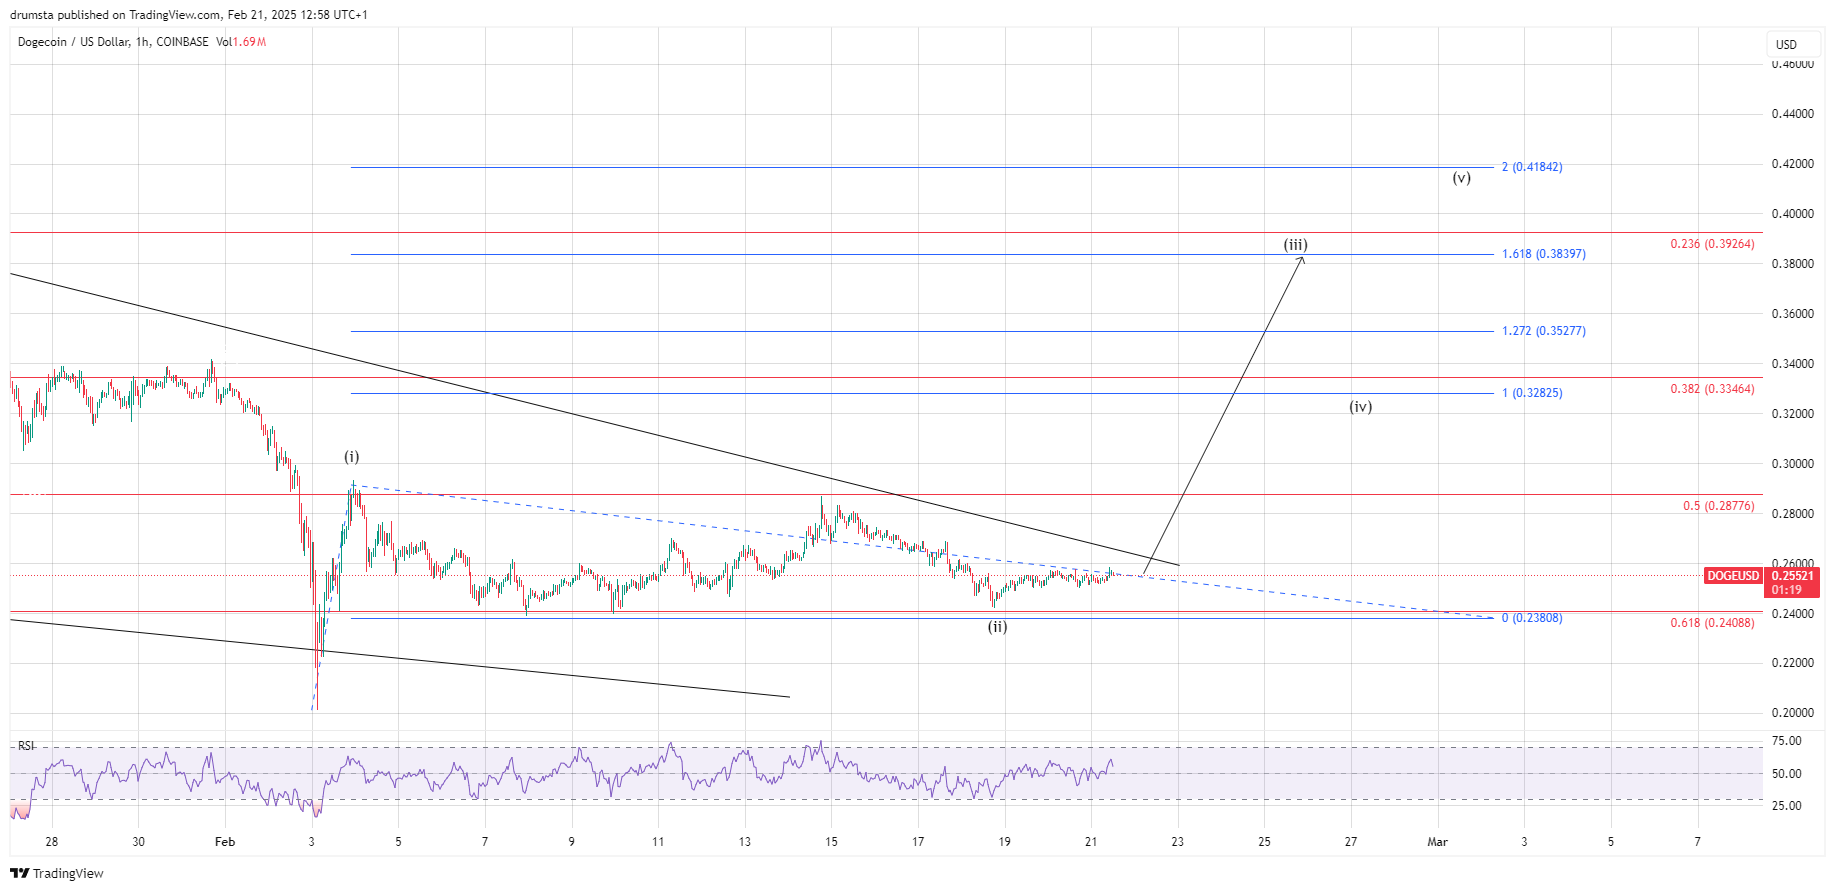
Wave (iii) is the key component of the expected breakout, with its initial target at the 1.618 Fibonacci extension ($0.38397). If DOGE successfully holds above this level, wave (v) could extend toward $0.41842, following a brief corrective wave (iv).
The RSI is currently at moderate levels, indicating there is room for upward momentum before entering overbought conditions.
However, a failure to break out of the wedge could trigger another retest of support near $0.24088. Invalidation of the bullish setup would occur if DOGE drops below this level, exposing further downside risks toward $0.17414 (0.786 Fibonacci).
Key Levels to Watch
- Immediate Resistance: $0.28776 (0.5 Fibonacci retracement)
- Key Resistance: $0.33464 (0.382 Fibonacci), $0.39264 (0.236 Fibonacci)
- Major Resistance: $0.41842 (wave (v) Fibonacci extension)
- Immediate Support: $0.24088 (0.618 Fibonacci retracement)
- Critical Support: $0.17414 (0.786 Fibonacci retracement)
- Breakout Confirmation: Above $0.28776 with volume support
About the Author
Bob MasonChief Crypto Boss
TEST 30 He has written extensively for a broader audience and his current focus is on developments relating to the financial markets including, but not limited to currencies, commodities, alternative asset classes, and global equities.
Latest news and analysis


Advertisement