
Advertisement
Advertisement
Ethereum (ETH) Showing Bullish Signs Amid Cboe and 21Shares’ ETF Staking Proposal
By:
Key Points:
- Elliott Wave count suggests a new bullish impulse wave
- RSI shows early signs of strength after prior oversold conditions
- Fibonacci resistance at $3,349, key support at $2,503

Ethereum (ETH) has shown early signs of recovery after finding support near the $2,503 level, aligning with key Fibonacci retracements. The recent correction appears to have completed a WXY pattern, suggesting a potential trend reversal.
With the latest news of Cboe and 21Shares proposing Ether ETF staking, investor sentiment may strengthen, fueling further upside. Technical indicators and Elliott Wave counts point to a developing bullish structure, with key resistance levels ahead that could determine Ethereum’s next major move.
Cboe and 21Shares’ ETF Staking Proposal
Ethereum’s price experienced a notable increase following the announcement that Cboe and 21Shares have submitted a proposal to the U.S. Securities and Exchange Commission (SEC) to incorporate staking into their Ether ETF offering.
This move signifies a significant development in the cryptocurrency investment landscape, as it would allow ETF investors to participate in Ethereum’s staking mechanism, potentially enhancing returns through staking rewards.
The proposal’s approval could pave the way for broader adoption of staking services within traditional financial products, reflecting the growing integration of decentralized finance features into mainstream investment vehicles. Market participants are closely monitoring the SEC’s response, anticipating that a favorable decision could further bolster Ethereum’s market performance and validate the inclusion of staking in regulated financial instruments.
ETH Price Analysis
Ethereum’s recent decline found support at the 0.5 Fibonacci retracement level at $2,503, although it initially spiked lower to $2,150. The larger structure on the 4-hour chart indicates a completed WXY corrective pattern, culminating in a potential reversal at $2,503. This area aligns with the 0.5 retracement of the prior impulsive wave, making it a significant structural support zone.

A recovery is now unfolding, with price action showing early signs of a new five-wave impulsive structure forming. Yesterday we saw a 10% jump from a low of $2,543 to a high of nearly $2,800. Although it is still early to call for a bullish reversal these could be the first signs.
The Relative Strength Index (RSI) is recovering from oversold conditions, suggesting increasing buying pressure. However, Ethereum faces overhead resistance at $2,881 (0.382 Fib) and $3,349 (0.236 Fib), which must be breached for sustained bullish momentum. A successful breakout above these levels could signal the completion of a corrective phase and confirm the start of a larger uptrend.
ETH Price Prediction
On the 1-hour chart, a detailed Elliott Wave count reveals Ethereum forming a new five-wave structure, with wave (i) marking the recent local high at $2,900 on Feb 4m rising 36% since its $2,150 low. A corrective wave (ii) tested support near $2,500, and price action now suggests the emergence of an extended wave (iii), targeting $3,349 as its primary objective.
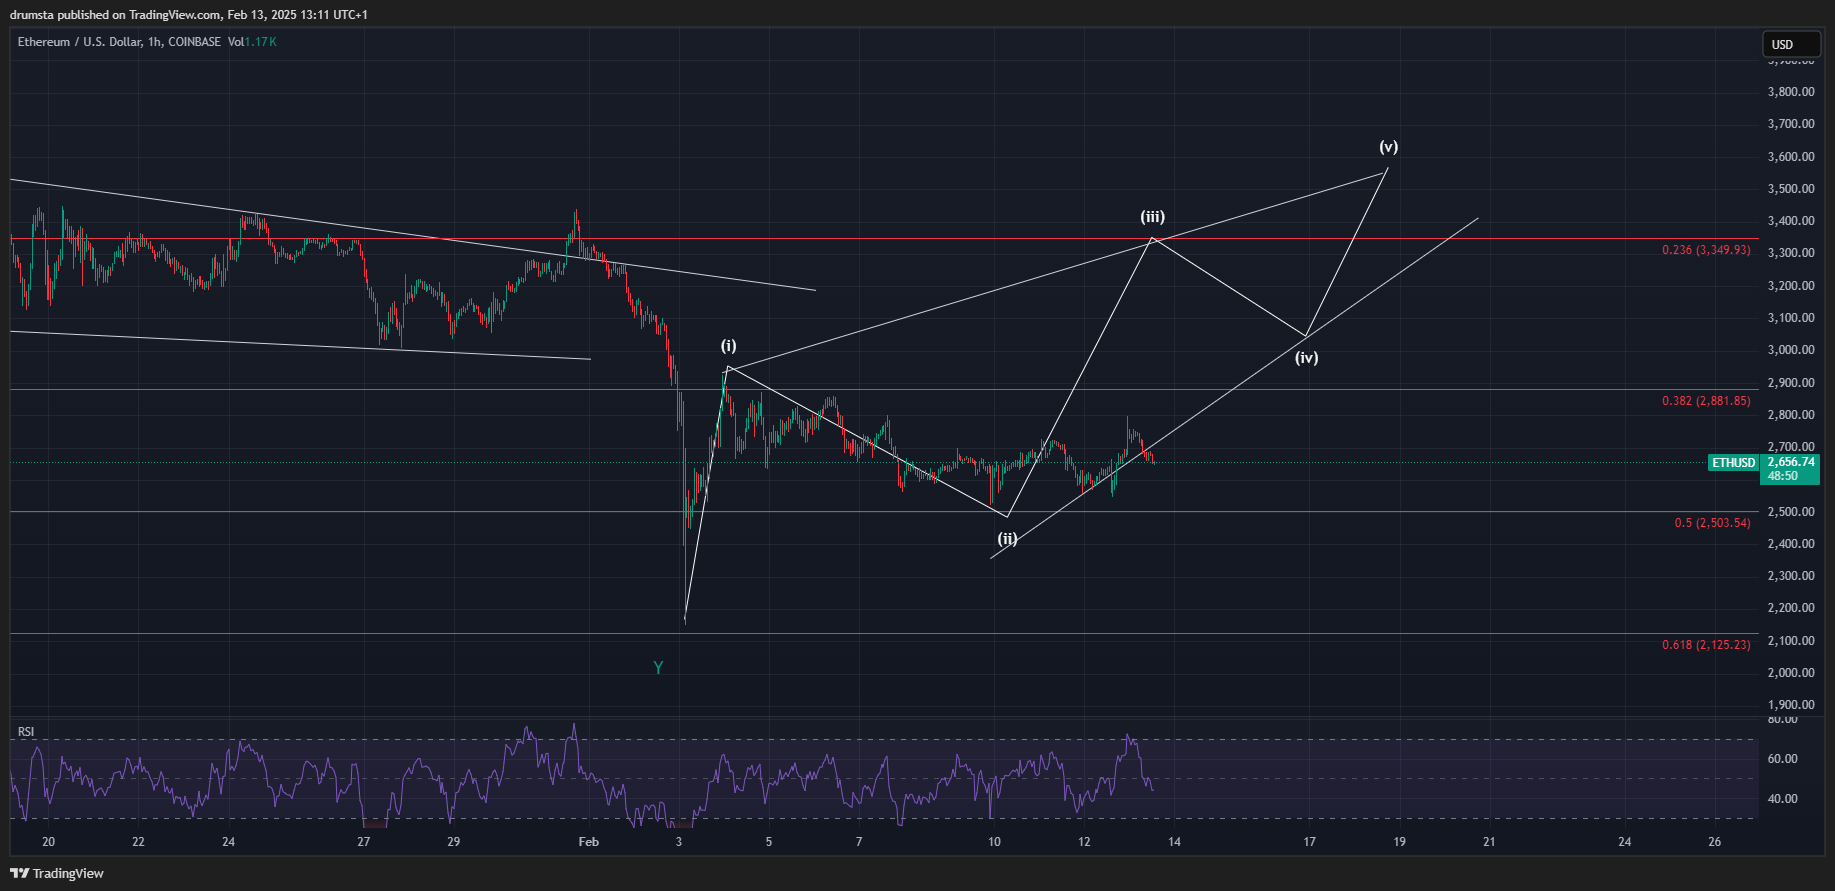
If wave (iii) unfolds as projected, it may extend towards $3,500, aligning with the 1.618 Fibonacci extension level. However, before reaching this target, Ethereum must clear immediate resistance at $2,881, a level that has historically acted as a strong pivot point. A rejection at this zone could lead to a temporary wave (iv) pullback, potentially retesting $2,700 before the final wave (v) extension towards $3,500.
Failure to hold above $2,600 would invalidate the bullish outlook, increasing the probability of retesting $2,503 or even the 0.618 retracement at $2,125. RSI remains neutral, suggesting room for additional upward momentum, but confirmation will depend on volume expansion and a decisive break above $2,900.
Key Levels to Watch
- Immediate Resistance: $2,881
- Key Resistance: $3,349 (
- Wave (iii) Target: $3,500
- Immediate Support: $2,700
- Critical Support: $2,503
- Invalidation Level: Below $2,125
About the Author
Bob MasonChief Crypto Boss
TEST 30 He has written extensively for a broader audience and his current focus is on developments relating to the financial markets including, but not limited to currencies, commodities, alternative asset classes, and global equities.
Latest news and analysis


Advertisement