
Advertisement
Advertisement
Ethereum (ETH) Tests Key Support Amid Leadership Shake-Up at Foundation
By:
Key Points:
- Descending channel structure remains intact, with key resistance overhead.
- ETH is testing the 0.5 Fibonacci retracement as critical support.
- A breakout above $3,078 could confirm bullish continuation.

Ethereum (ETH) is at a pivotal moment, both in price action and leadership changes. As the Ethereum Foundation announces Aya Miyaguchi’s transition to president and Vitalik Buterin signals structural reforms, ETH’s price remains trapped in a descending channel.
The asset is testing key support at $2,487, with potential for either a breakout above $2,881 or a deeper correction toward $2,125. This analysis explores ETH’s technical outlook amid these fundamental shifts.
Ethereum Foundation Leadership Change
In a significant organizational shift, the Ethereum Foundation has announced that Executive Director Aya Miyaguchi will assume the role of president. This move comes as co-founder Vitalik Buterin commits to overhauling the foundation’s leadership structure.
The decision follows recent community discussions and calls for leadership changes within the foundation. Notably, former Ethereum Foundation researcher Danny Ryan has been suggested by many as a potential candidate for a leadership position. These developments indicate a strategic effort to address community concerns and enhance the foundation’s governance.
ETH Price Analysis
ETH has been in a corrective phase since reaching its high of $4,106 in December, forming a downward-sloping channel. The wave structure suggests that the asset is completing a larger ABC correction, where wave C reached $2,157 falling below the $2,487 level aligning with the 0.5 Fibonacci retracement on Feb. 3.
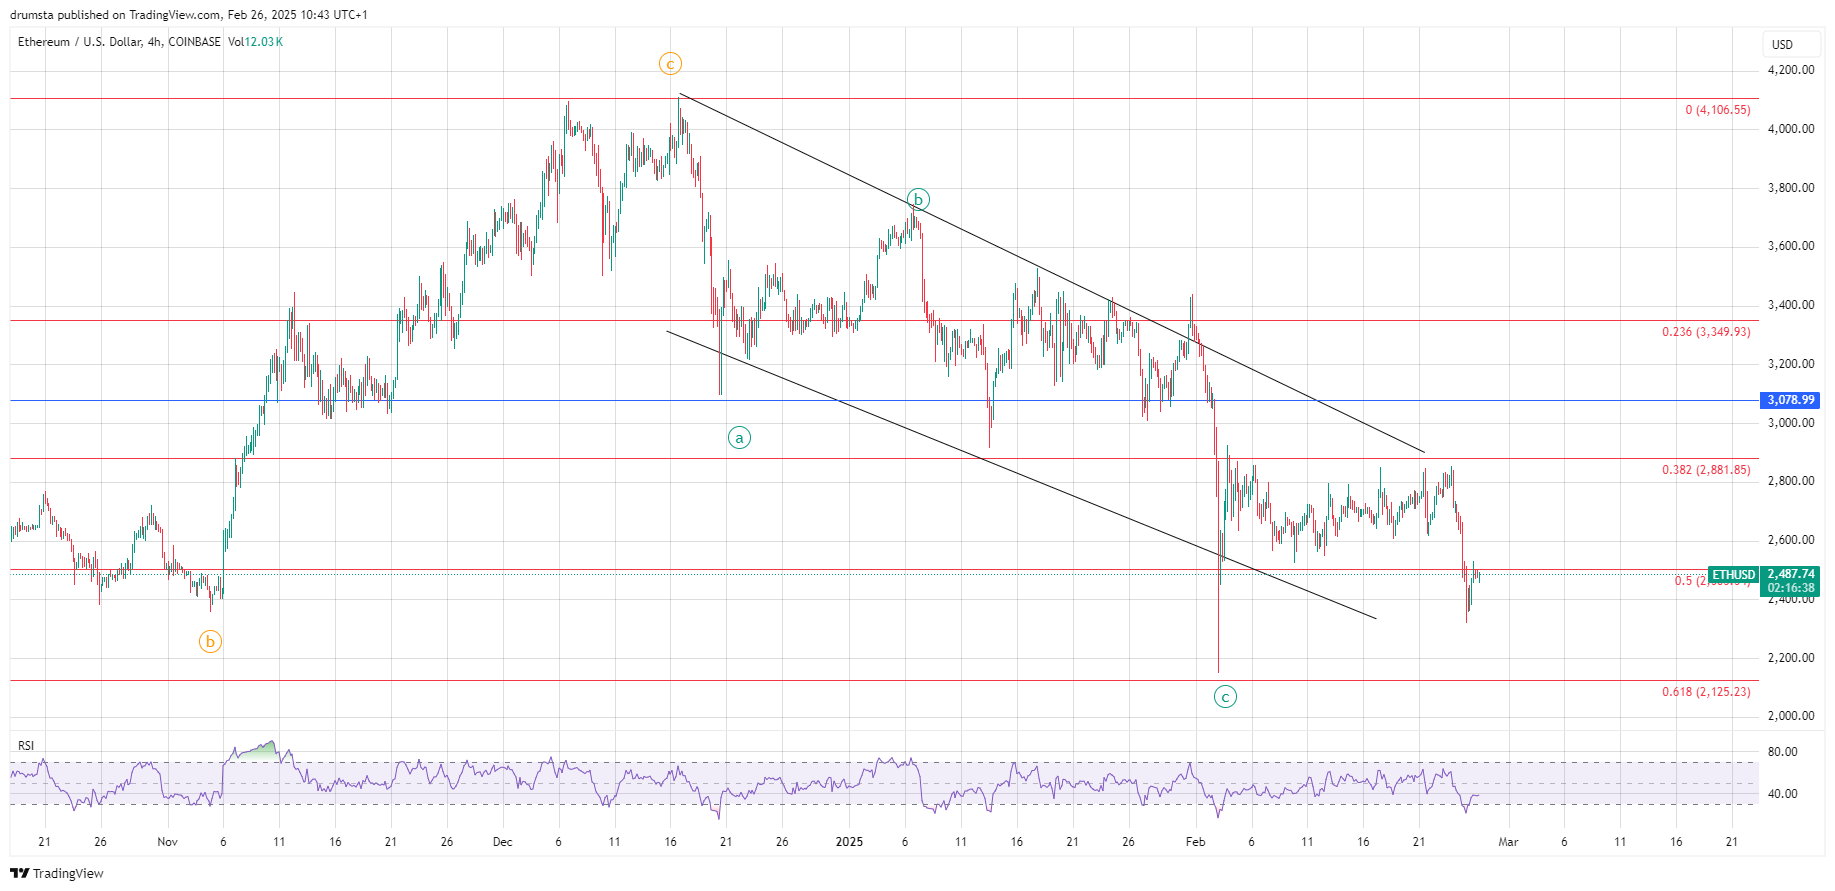
The price action shows strong interaction with Fibonacci levels, with $2,881 (0.382 retracement) acting as a major resistance. The Relative Strength Index (RSI) has fluctuated between neutral and oversold conditions, indicating waning bearish momentum but lacking clear signs of a strong reversal. A further move lower could test $2,125 (0.618 Fibonacci level), which is a critical support level for ETH to maintain its broader uptrend.
A decisive break above $2,881 could trigger a retest of $3,078 (a horizontal resistance zone), which also aligns with the previous breakdown structure. However, a failure to hold above $2,487 might accelerate a drop towards $2,125, completing the final corrective wave before a potential larger recovery.
ETH Price Prediction
The 1-hour chart presents a more detailed view of the ongoing correction. ETH recently bounced off the lower boundary of its descending channel, testing resistance near $2,487. The structure appears to be forming a possible wave E of a larger corrective wave count, suggesting one final move lower before a bullish reversal.
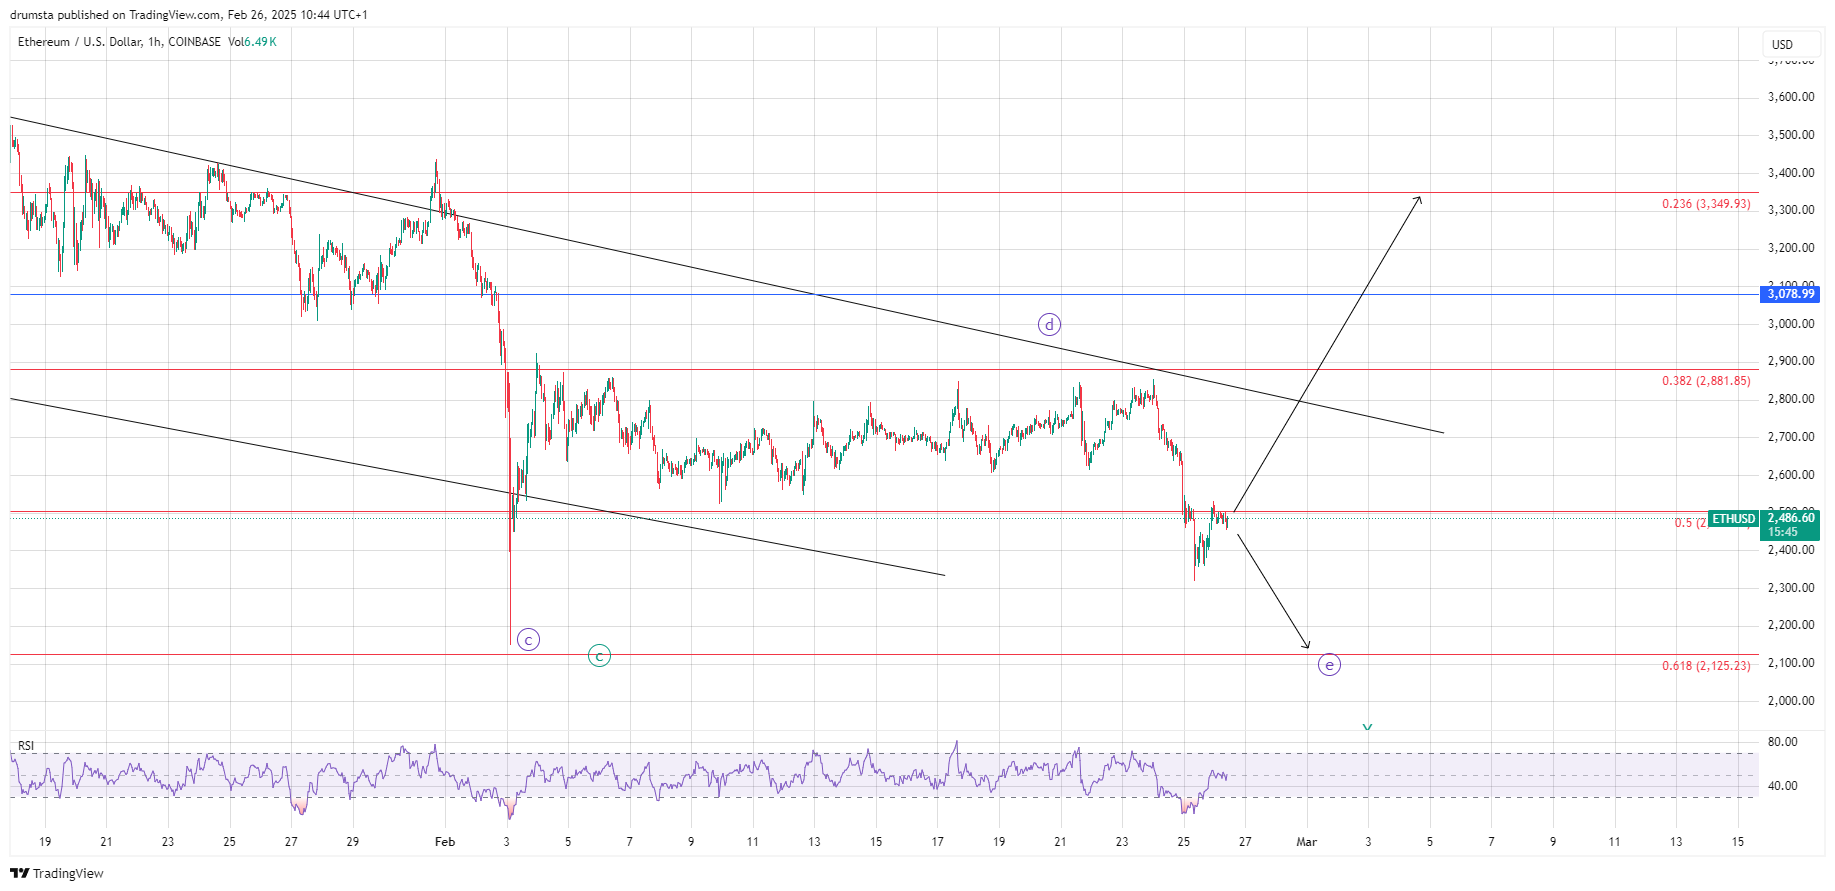
The immediate resistance lies near $2,881, which aligns with the 0.382 Fibonacci retracement. A break above this level could confirm a bullish breakout, targeting $3,078 as the next key upside level. Conversely, if ETH fails to hold above $2,487, the bearish scenario would target $2,125, where the 0.618 Fibonacci retracement aligns with a previous liquidity zone.
RSI on the 1-hour timeframe remains in recovery mode but still below the neutral 50 level, indicating weak momentum. If RSI continues upward, it may signal to strengthen bullish pressure. Volume confirmation will be crucial in validating the next breakout direction.
The difference between these two scenarios lies in how the sideways structure since Feb. 3 is counted. This could either be a stabilization after an aggressive wick finished the correction count. In that case it recent recovery since yesterday’s low could be the start of a new bull phase which will be confirmed by the descending resitance breakout.
On the other hand correction could have been prolonged by two more waves out of which the sideways movement since Feb. 3 is the sub-wave D, leading to a lower low as the sub-wave E.
Key Levels to Watch
- Immediate Resistance: $2,881 (0.382 Fibonacci retracement)
- Key Resistance: $3,078 (horizontal level)
- Immediate Support: $2,487 (0.5 Fibonacci retracement)
- Critical Support: $2,125 (0.618 Fibonacci retracement)
- Breakout Target: Above $3,349 (0.236 Fibonacci retracement) if bullish momentum sustains.
About the Author
Bob MasonChief Crypto Boss
TEST 30 He has written extensively for a broader audience and his current focus is on developments relating to the financial markets including, but not limited to currencies, commodities, alternative asset classes, and global equities.
Latest news and analysis


Advertisement