
Advertisement
Advertisement
Ethereum Is Mirroring 2019 Fractal That Preceded 430% Boom Versus Bitcoin
By:
Key Points:
- ETH/BTC is mirroring its 2019 bottom, suggesting a potential 60% upside toward 0.041.
- ETH/USD must break above the $2,575–$2,900 resistance zone to confirm a bullish reversal.
- Failure to reclaim key resistance levels could lead to renewed downside toward $2,100 or lower.

Ethereum’s native token, Ether (ETH), is showing signs of a potential bullish reversal against Bitcoin (BTC), with its ETH/BTC pair painting a price structure similar to the 2019 bottom that preceded a 430% rally.
ETH Eyes 60%-Plus Price Boom Versus BTC
On the 2-week chart, ETH/BTC has bounced off a parabolic resistance curve that has defined its downtrend since mid-2022.
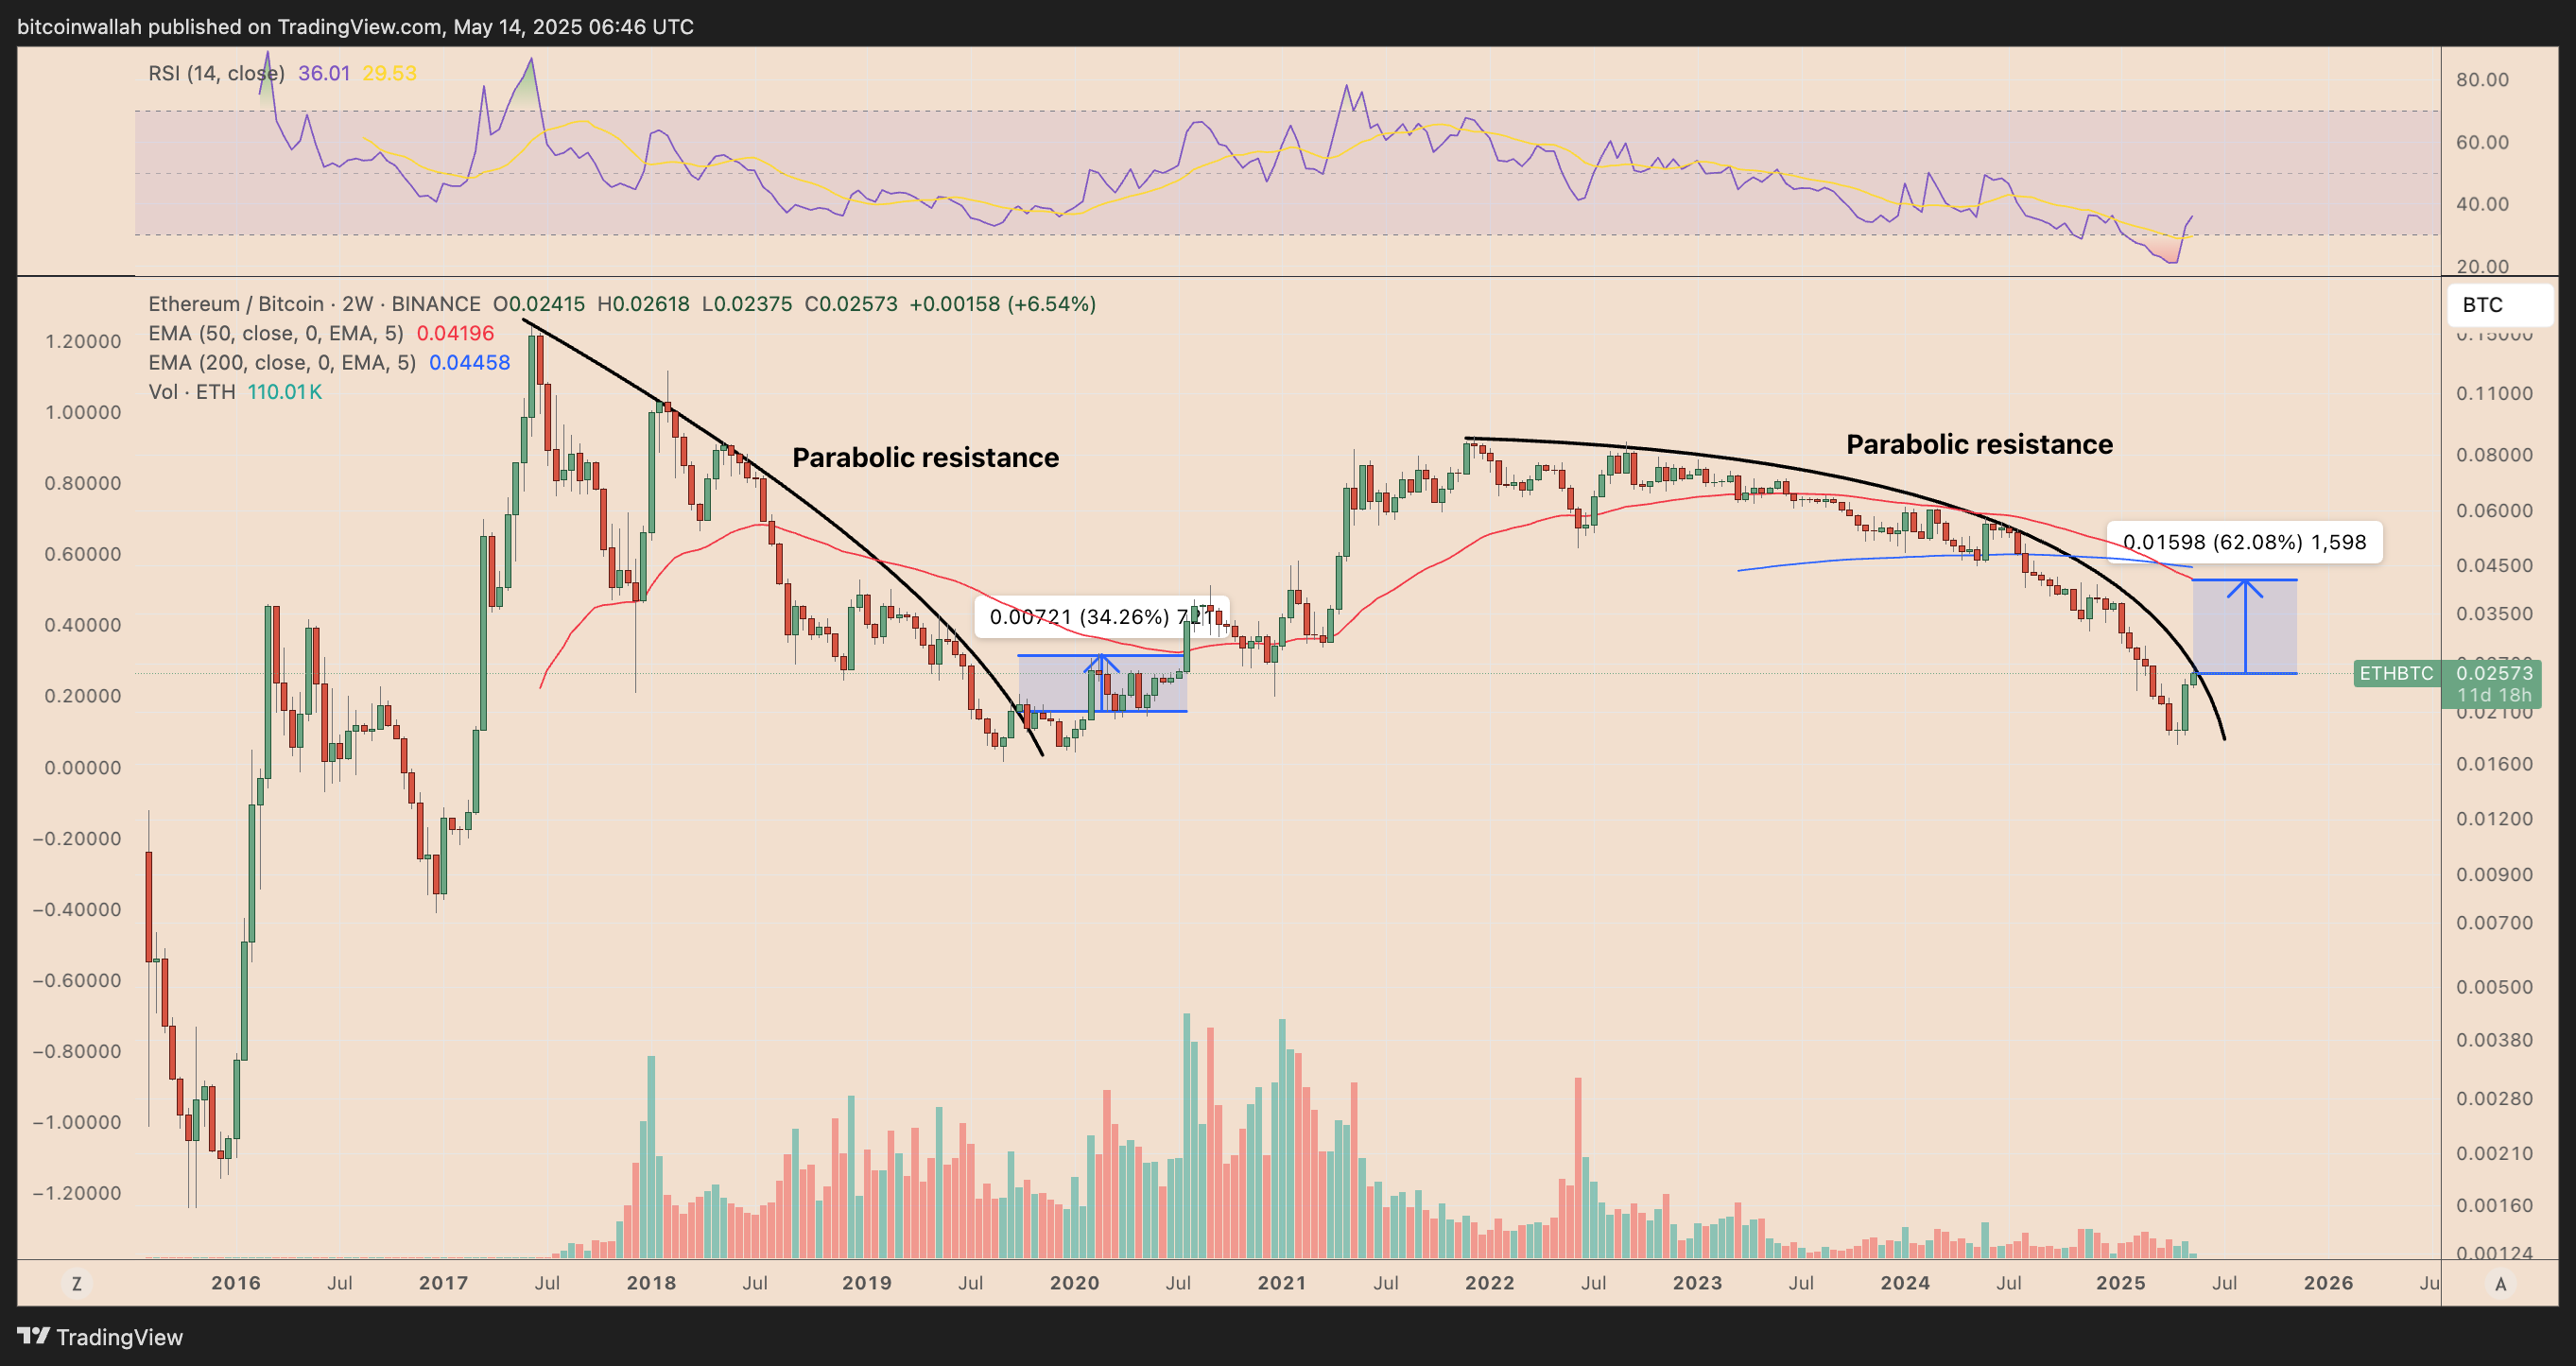
The latest rebound comes after ETH/BTC dropped to a multi-year low near 0.021.
The pair has since climbed over 6%, mirroring the early stages of the 2019 breakout. Back then, a modest 34% rally from the bottom preceded a much larger upside move of over 430%.
Ethereum has not yet reclaimed its 200-period exponential moving average (EMA) on the 2-week timeframe—a level currently near 0.0446—its recent price action suggests a possible retest in the coming weeks.
A 62% rally from the current level would bring ETH/BTC back to the 0.041 area, a horizontal resistance level that aligns with the measured move target shown on the chart.
Adding strength to the setup, the 2-week relative strength index (RSI) has bounced from oversold territory, indicating potential bullish divergence.
Still, the fractal’s validation depends on whether ETH/BTC can break and hold above the parabolic resistance. Failure to do so could prolong the bearish trend, initially toward 0.0176.
Ethereum Faces Crucial Resistance Test Near $2,900
The ETH/USD 2-week chart is testing a key resistance zone between $2,575 and $2,900.
This area includes the 50-period EMA, a long-standing horizontal resistance, and the ascending triangle’s lower trendline, now acting as resistance after a breakdown. This confluence makes it a critical level for determining ETH’s next move.
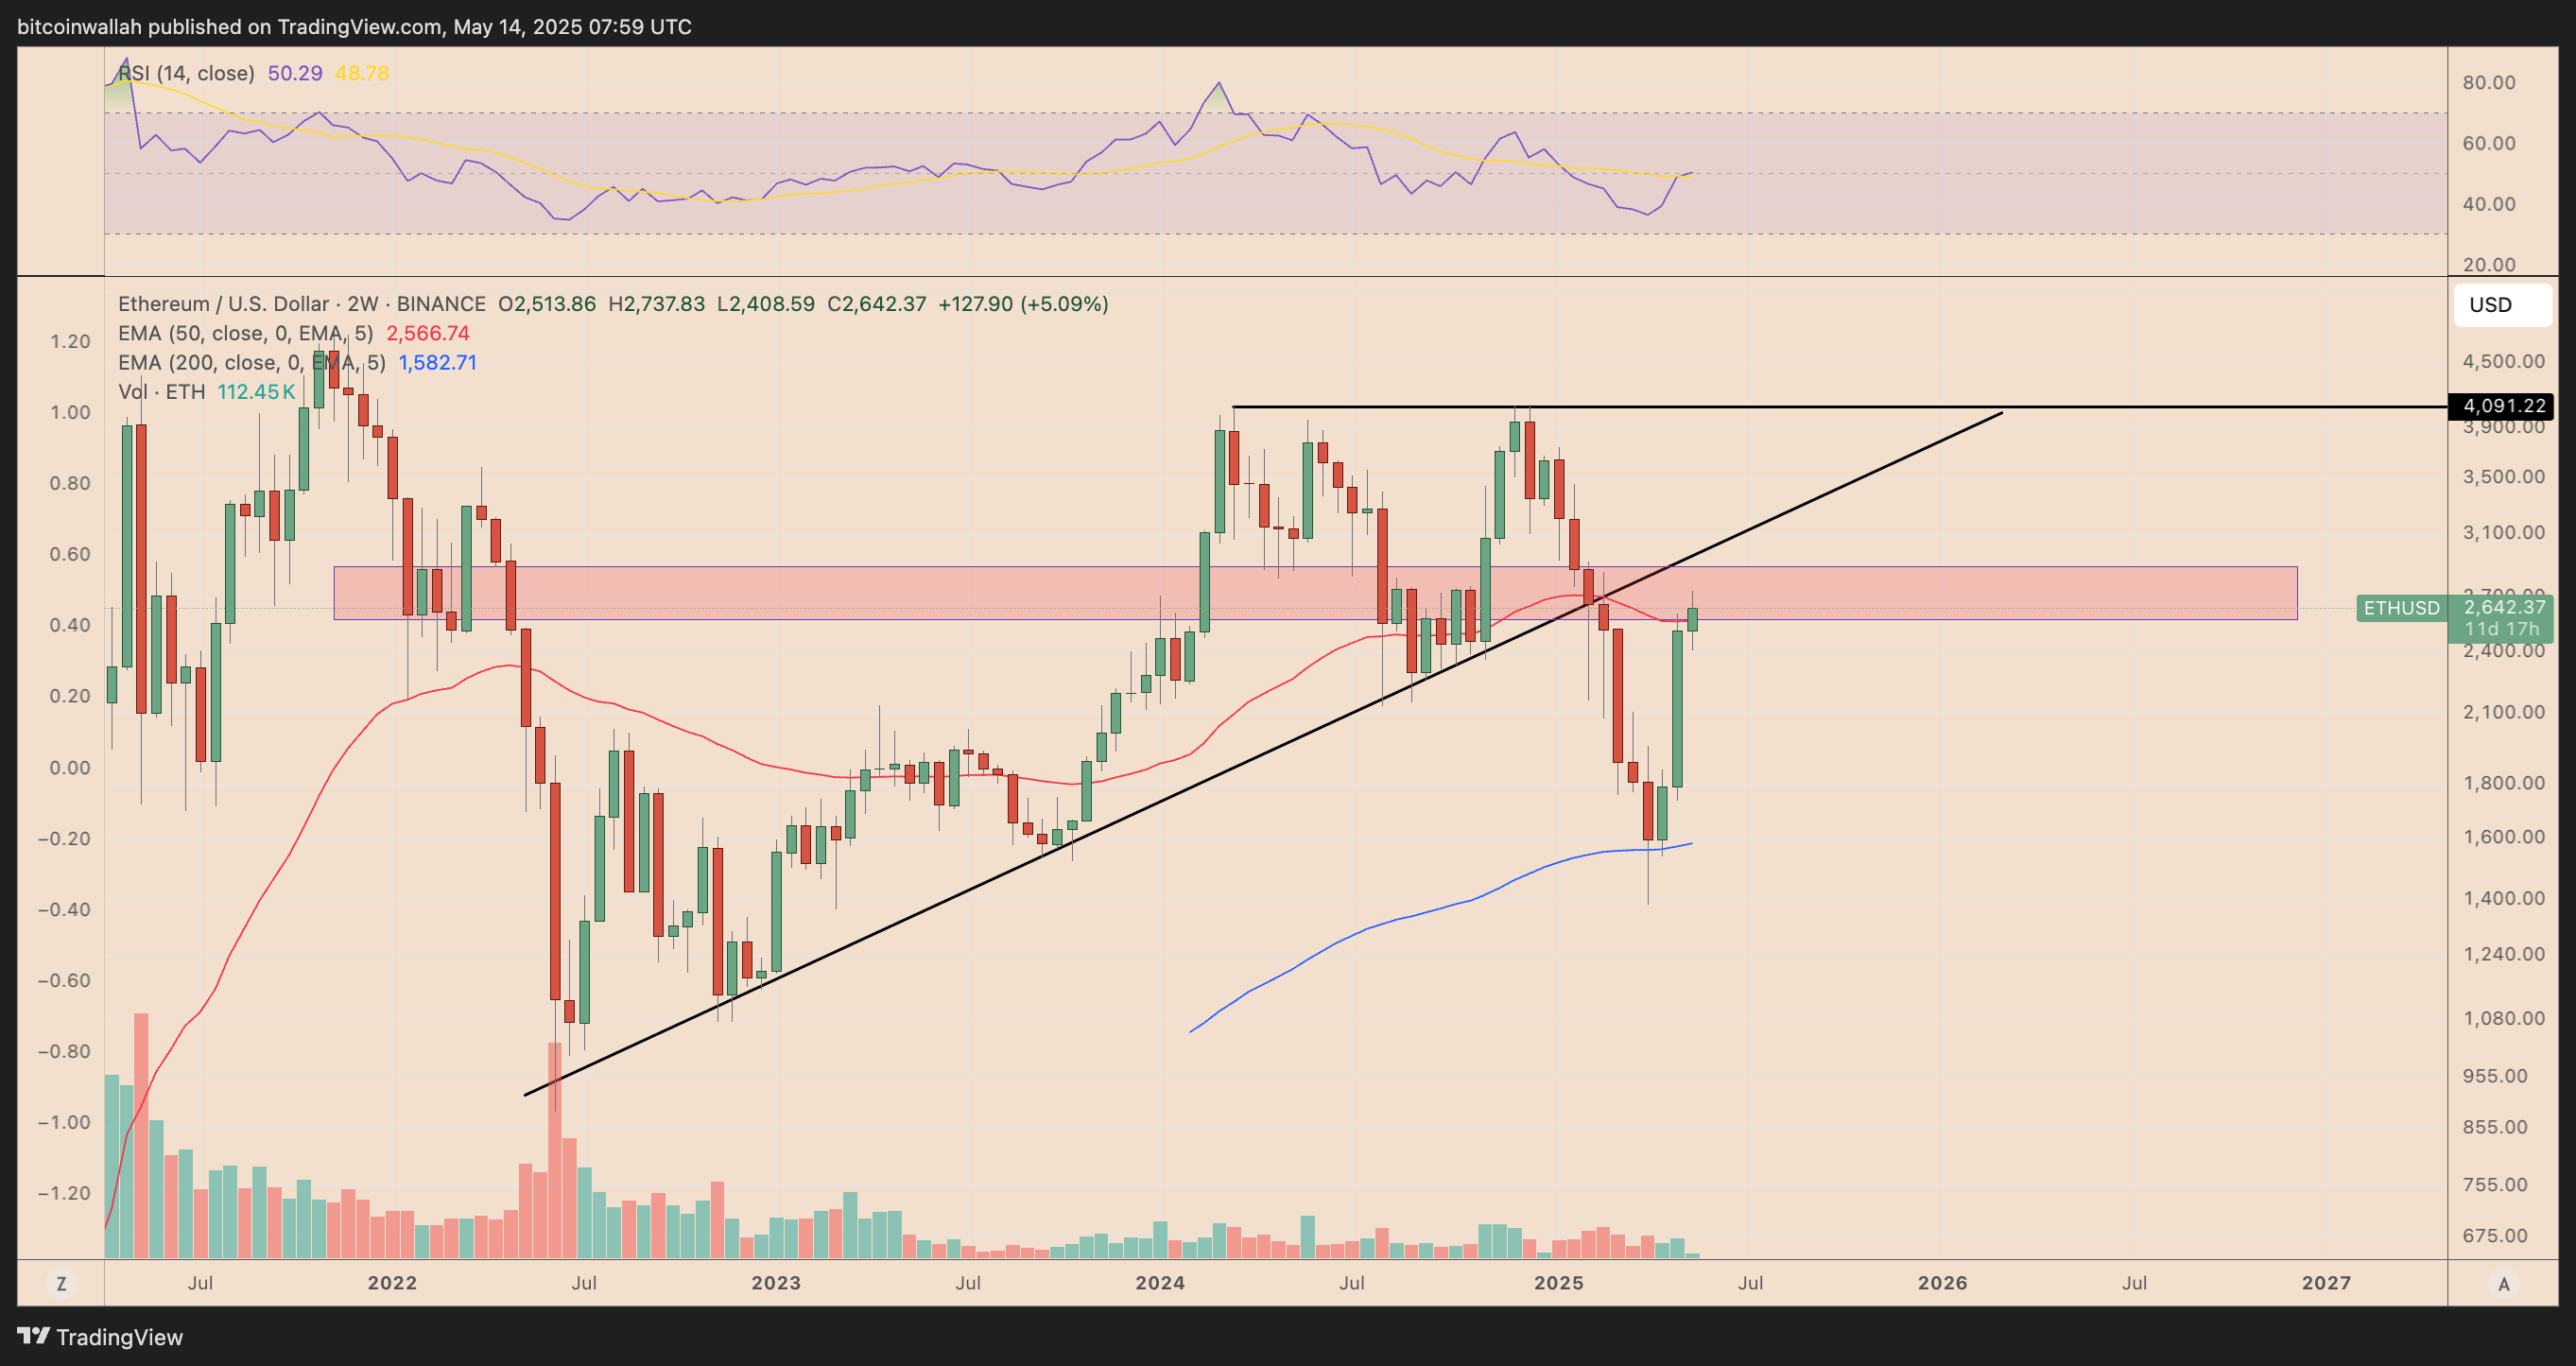
ETH recently bounced from the 200-period EMA (~$1,582), signaling potential bullish momentum. However, unless ETH breaks and closes above $2,900, this rebound risks being a failed retest of broken support.
A breakout above $2,900 could flip the structure bullish and pave the way toward $4,000, matching the triangle’s former top and a historical resistance level near $4,091. This would likely trigger renewed buying interest.
Failure to break above the resistance zone could lead to a correction, with initial support near $2,100, and deeper downside risk toward the 200-EMA if selling pressure returns.
The RSI has bounced to 50, indicating neutral momentum. Ethereum’s next few candles will be key to confirming either a breakout or another leg down.
About the Author
Bob MasonChief Crypto Boss
123456789 30 He has written extensively for a broader audience and his current focus is on developments relating to the financial markets including, but not limited to currencies, commodities, alternative asset classes, and global equities.


Advertisement