
Advertisement
Advertisement
Ethereum Price Forecast: ETH Needs to Stay Above $2,300 to Maintain Bullish Outlook
By:
Key Points:
- Ethereum (ETH) has dropped sharply after news of Israel’s attack on Iran.
- ETH was on pace to a bullish breakout above a key resistance before the news broke.
- The token’s cup and handle pattern has not been invalidated yet unless the price drops below $2,300.

The meltdown started yesterday afternoon when the news broke. The Israeli army confirmed that they struck a nuclear facility where Iran was allegedly performing uranium enriching operations.
The head of the Iranian Armed Forces was killed as a result of this attack and the market was rattled by the possibility that the military conflict in the region could be aggravated by these events.
Most crypto assets experienced a significant drop alongside Ethereum. Bitcoin (BTC) and Solana (SOL) have gone down by 1.8% and 7.8% respectively in the past day as well while XRP (XRP) has booked a 3% loss.
ETH Liquidations Hit $250M in 24 Hours
Crypto liquidations have neared the $1 billion mark in the past 24 hours as a result of this decline, with Ethereum currently accounting for roughly a quarter of that total.
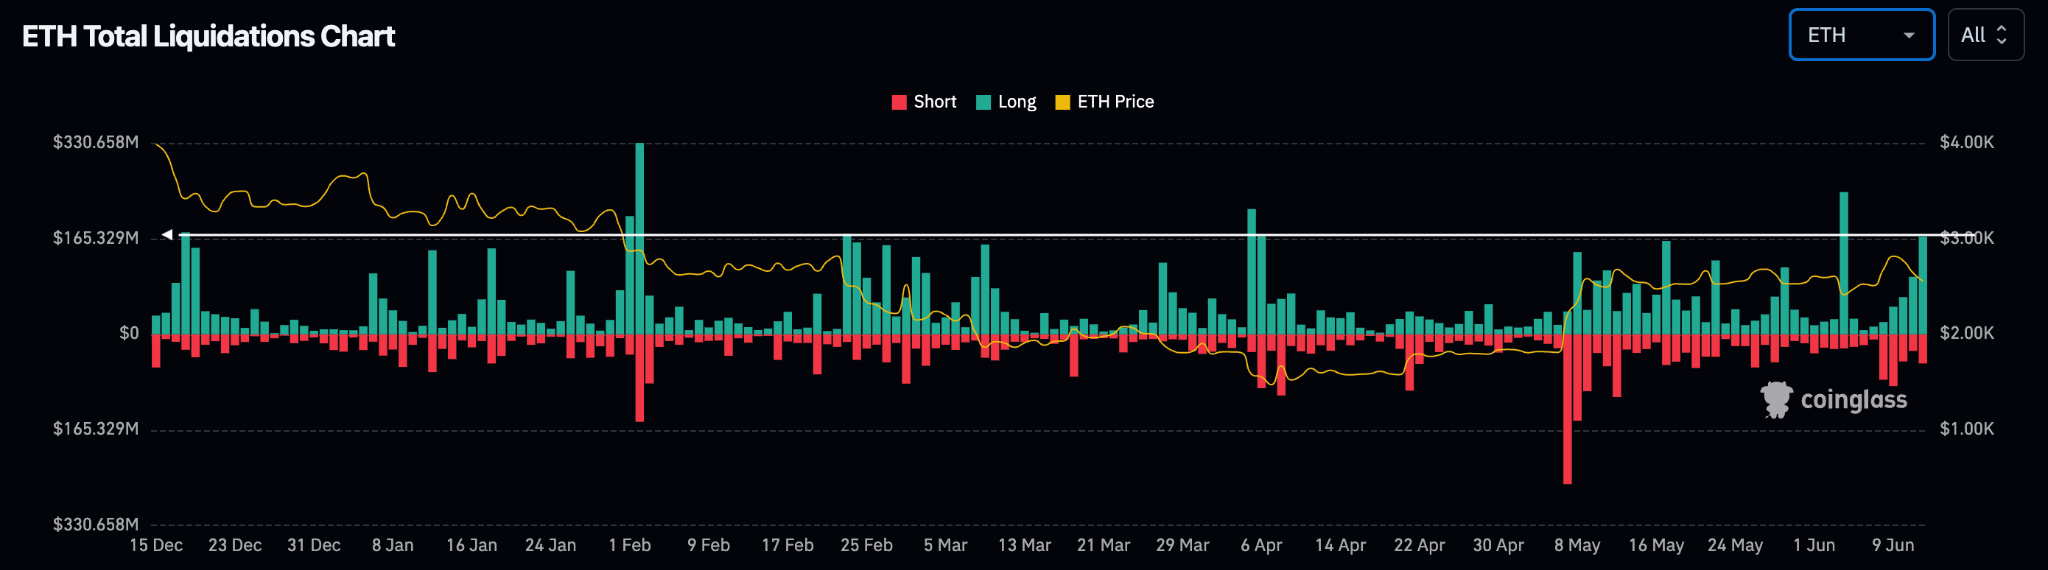
Meanwhile, ETH trading volumes during this period have gone up by 55% and currently sit at nearly $40 billion, accounting for 14% of the token’s total circulating supply. This is a huge volume spike and one that suggests that selling pressure has accelerated.
This amount of liquidation has prompted a long squeeze that has probably contributed to push trading volumes higher as a significant number of stop orders for ETH – an asset that had been performing quite well in the past month or so – were triggered amid the decline.
We recently shared a price prediction that anticipated a big surge to $4,100 for ETH as long as it consolidated a bullish breakout above the $2,750 level.
The token rose above that marker four days ago but was met by significant selling volumes, partially amid failed negotiations between the U.S. and China on the trade front after a week of discussions and now due to this military development in the Middle East.
Key Levels to Watch During the Weekend
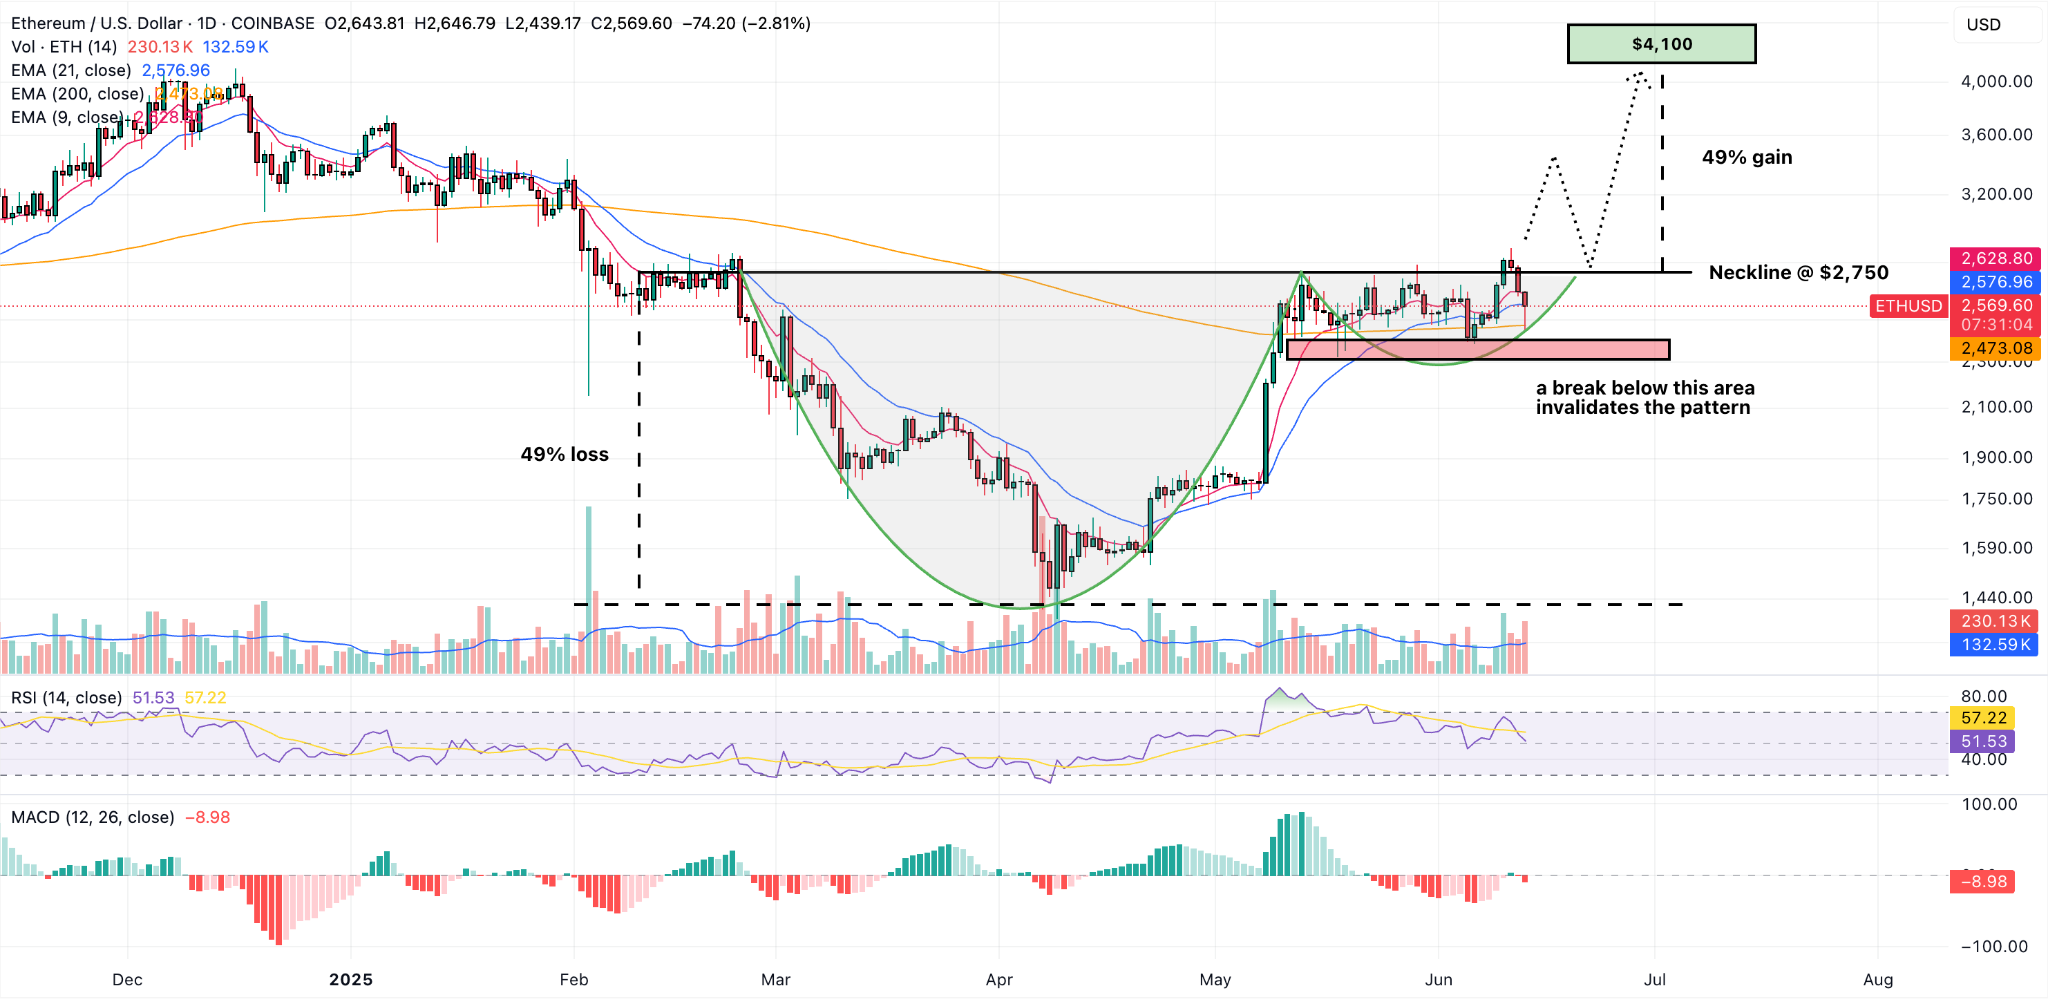
Our $4,000 prediction is based on a cup and handle pattern that has been forming for months in the daily chart and that could produce an estimated gain of 50% as long as the price breaks out above that $2,750 resistance.
Although it appears that the pattern has been invalidated after a failed breakout, that will only be the case if it drops below $2,300. In that case, the handle will no longer be such a thing.
This kind of movement is not uncommon in patterns that promise huge upside potential and around key resistances and they typically signal that the market is in a phase of accumulation ahead of what participants believe could be a significant move.
The 9-day and 21-day exponential moving averages (EMAs) favor a bullish outlook at the moment after they posted a ‘golden cross’ upon surging above the 200-day EMA
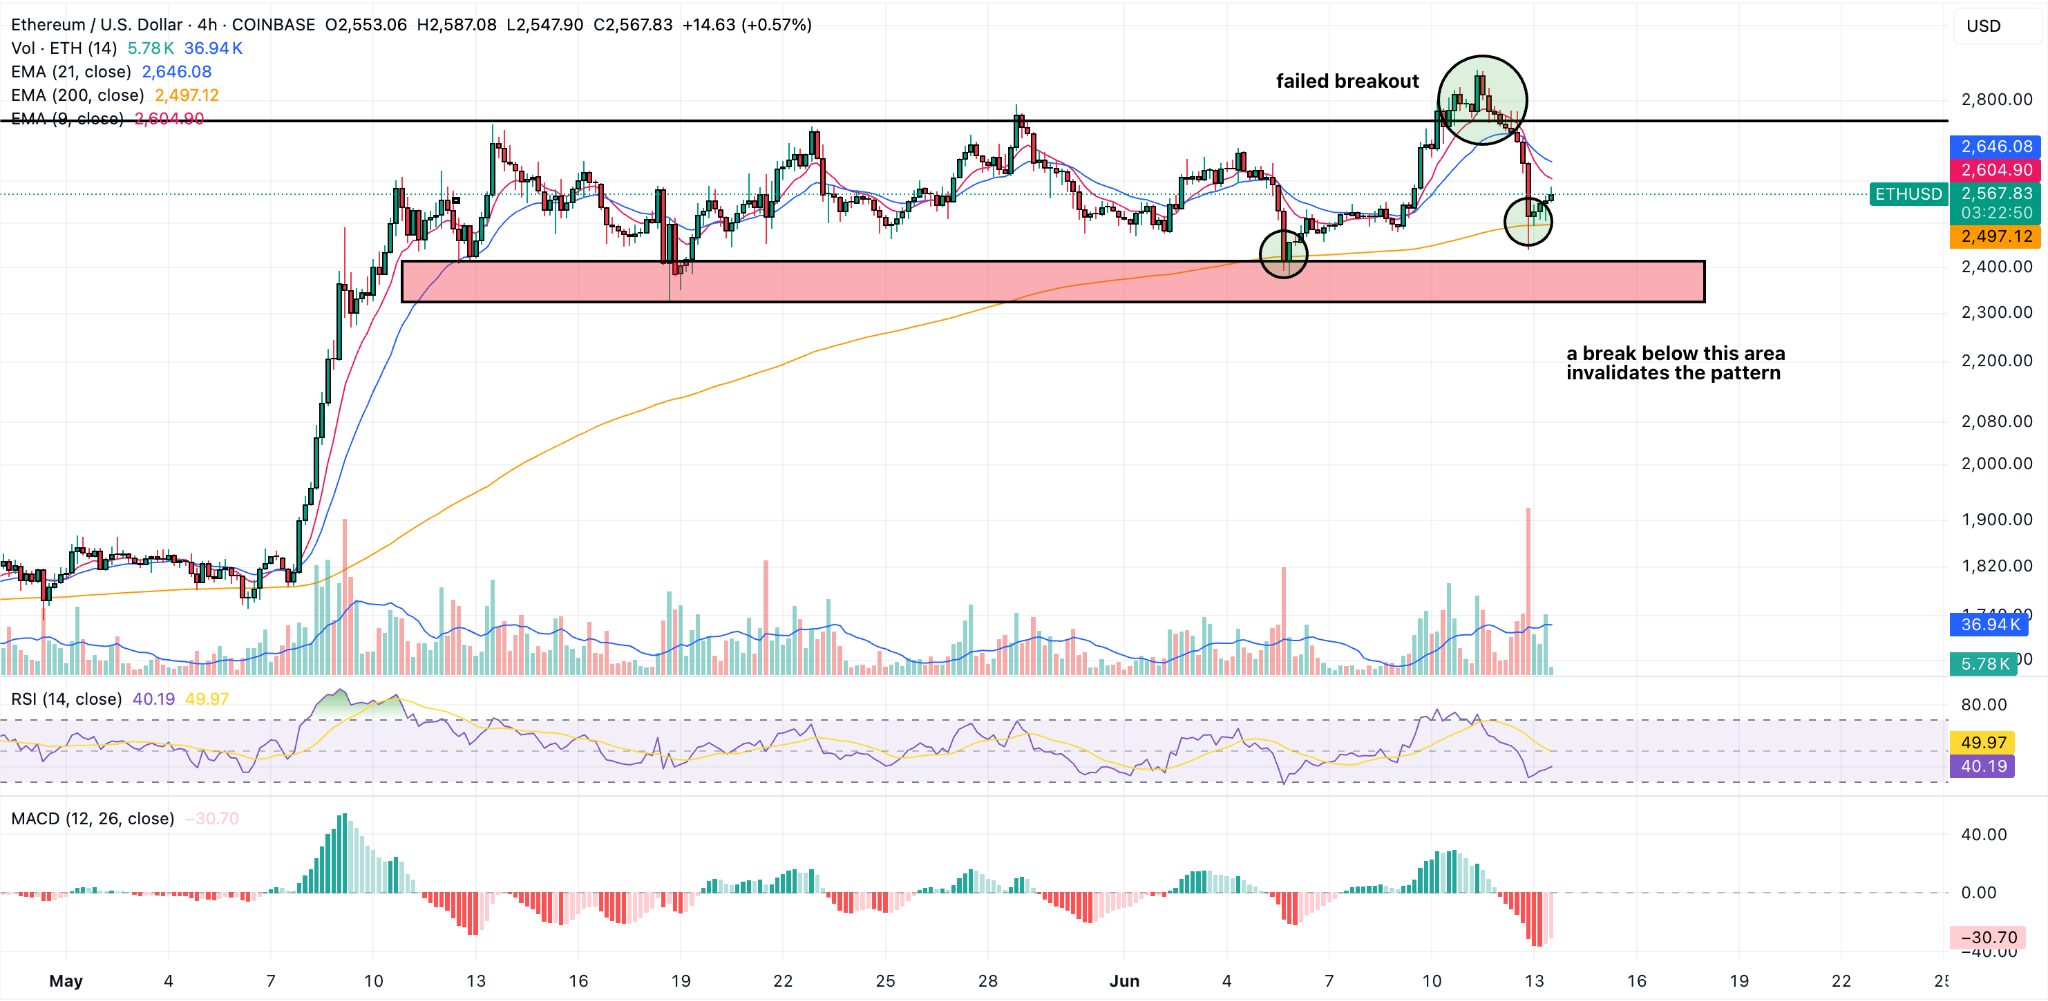
Heading to a lower time frame to have a closer look at this zone, we can see how the market has bounced off the $2,300 – $2,400 mark two times already.
This is a zone where there has been some strong buying interest and could be where the market is heading now to find the necessary liquidity for its next leg up.
If buying pressure is strong enough, this could trigger ETH’s next move to retest the $2,750 resistance.
About the Author
Bob MasonChief Crypto Boss
123456789 30 He has written extensively for a broader audience and his current focus is on developments relating to the financial markets including, but not limited to currencies, commodities, alternative asset classes, and global equities.


Advertisement