
Advertisement
Advertisement
Ethereum Price Prediction: 4 Exclusive ETH Price Charts Signaling Selloffs Ahead
By:
Key Points:
- Ethereum’s rising Binance reserves and netflows signal increasing sell-side pressure despite price stability.
- A failed breakout above $2,700 could invalidate the bullish inverse head-and-shoulders setup.
- Weekly chart warns of a potential 60% drop toward $1,075 if resistance holds.

Ethereum’s native token, Ether (ETH), has almost doubled in price since bottoming out in April at around $1,385. But while price action appears stable on the surface, onchain data from Binance suggests mounting downside pressure.
Several key metrics, as highlighted by CryptoQuant-based onchain analyst BorisVest, are flashing signs of distribution and potential capitulation risk. Let’s examine.
Binance ETH Reserves Rise Sharply
One of the clearest warning signs is the sustained rise in Ethereum reserves on Binance.
Since December, ETH reserves have increased from around 3.78 million to over 4.21 million, marking a seven-month high. This trend typically signals growing sell-side interest, as large holders transfer coins to exchanges in preparation to liquidate.
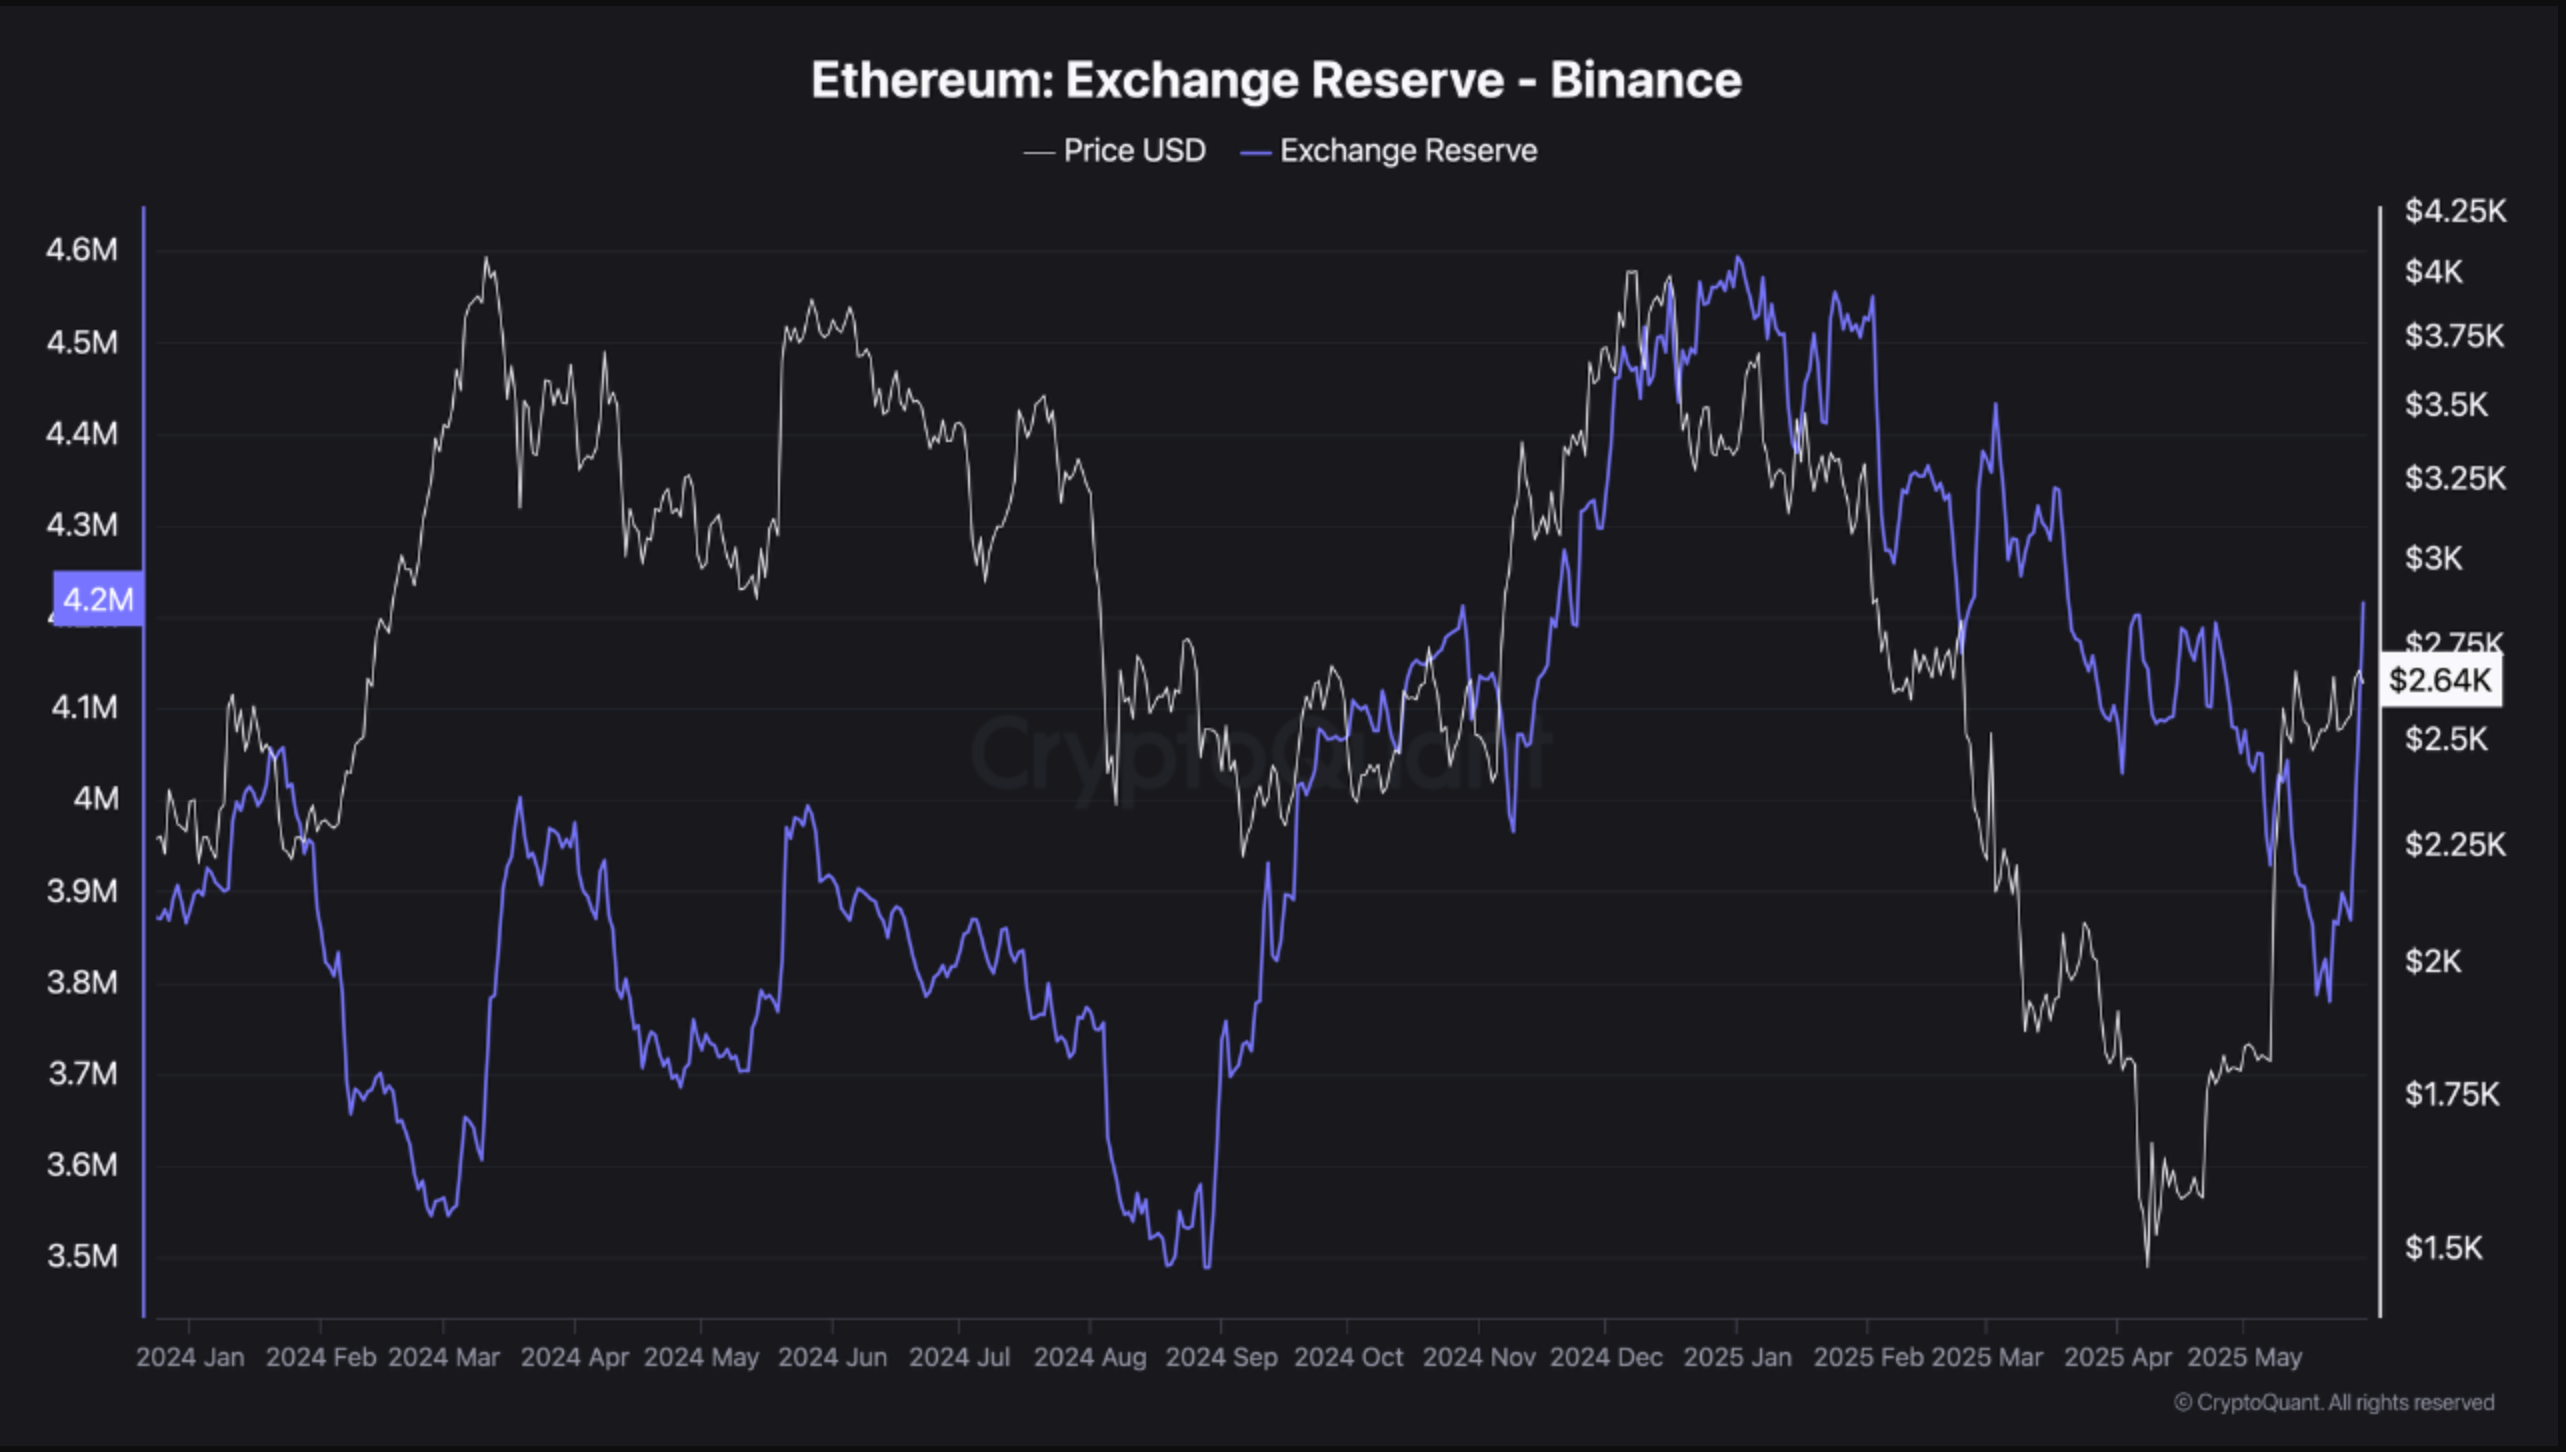
When traders anticipate a bullish continuation, they tend to withdraw ETH to self-custody or stake. Conversely, surging exchange reserves imply a readiness to sell, particularly when price rallies coincide with inflows.
It shows that traders are opting to capitalize on local highs, suggesting they do not expect a breakout above the $2,700 resistance to hold.
Massive Ethereum Netflows Signal Distribution
The exchange netflow chart further confirms this bearish shift.
Over just three trading sessions, Binance has received a combined net inflow of more than 346,000 ETH. This occurred precisely as ETH attempted to rally toward the upper end of its current range.
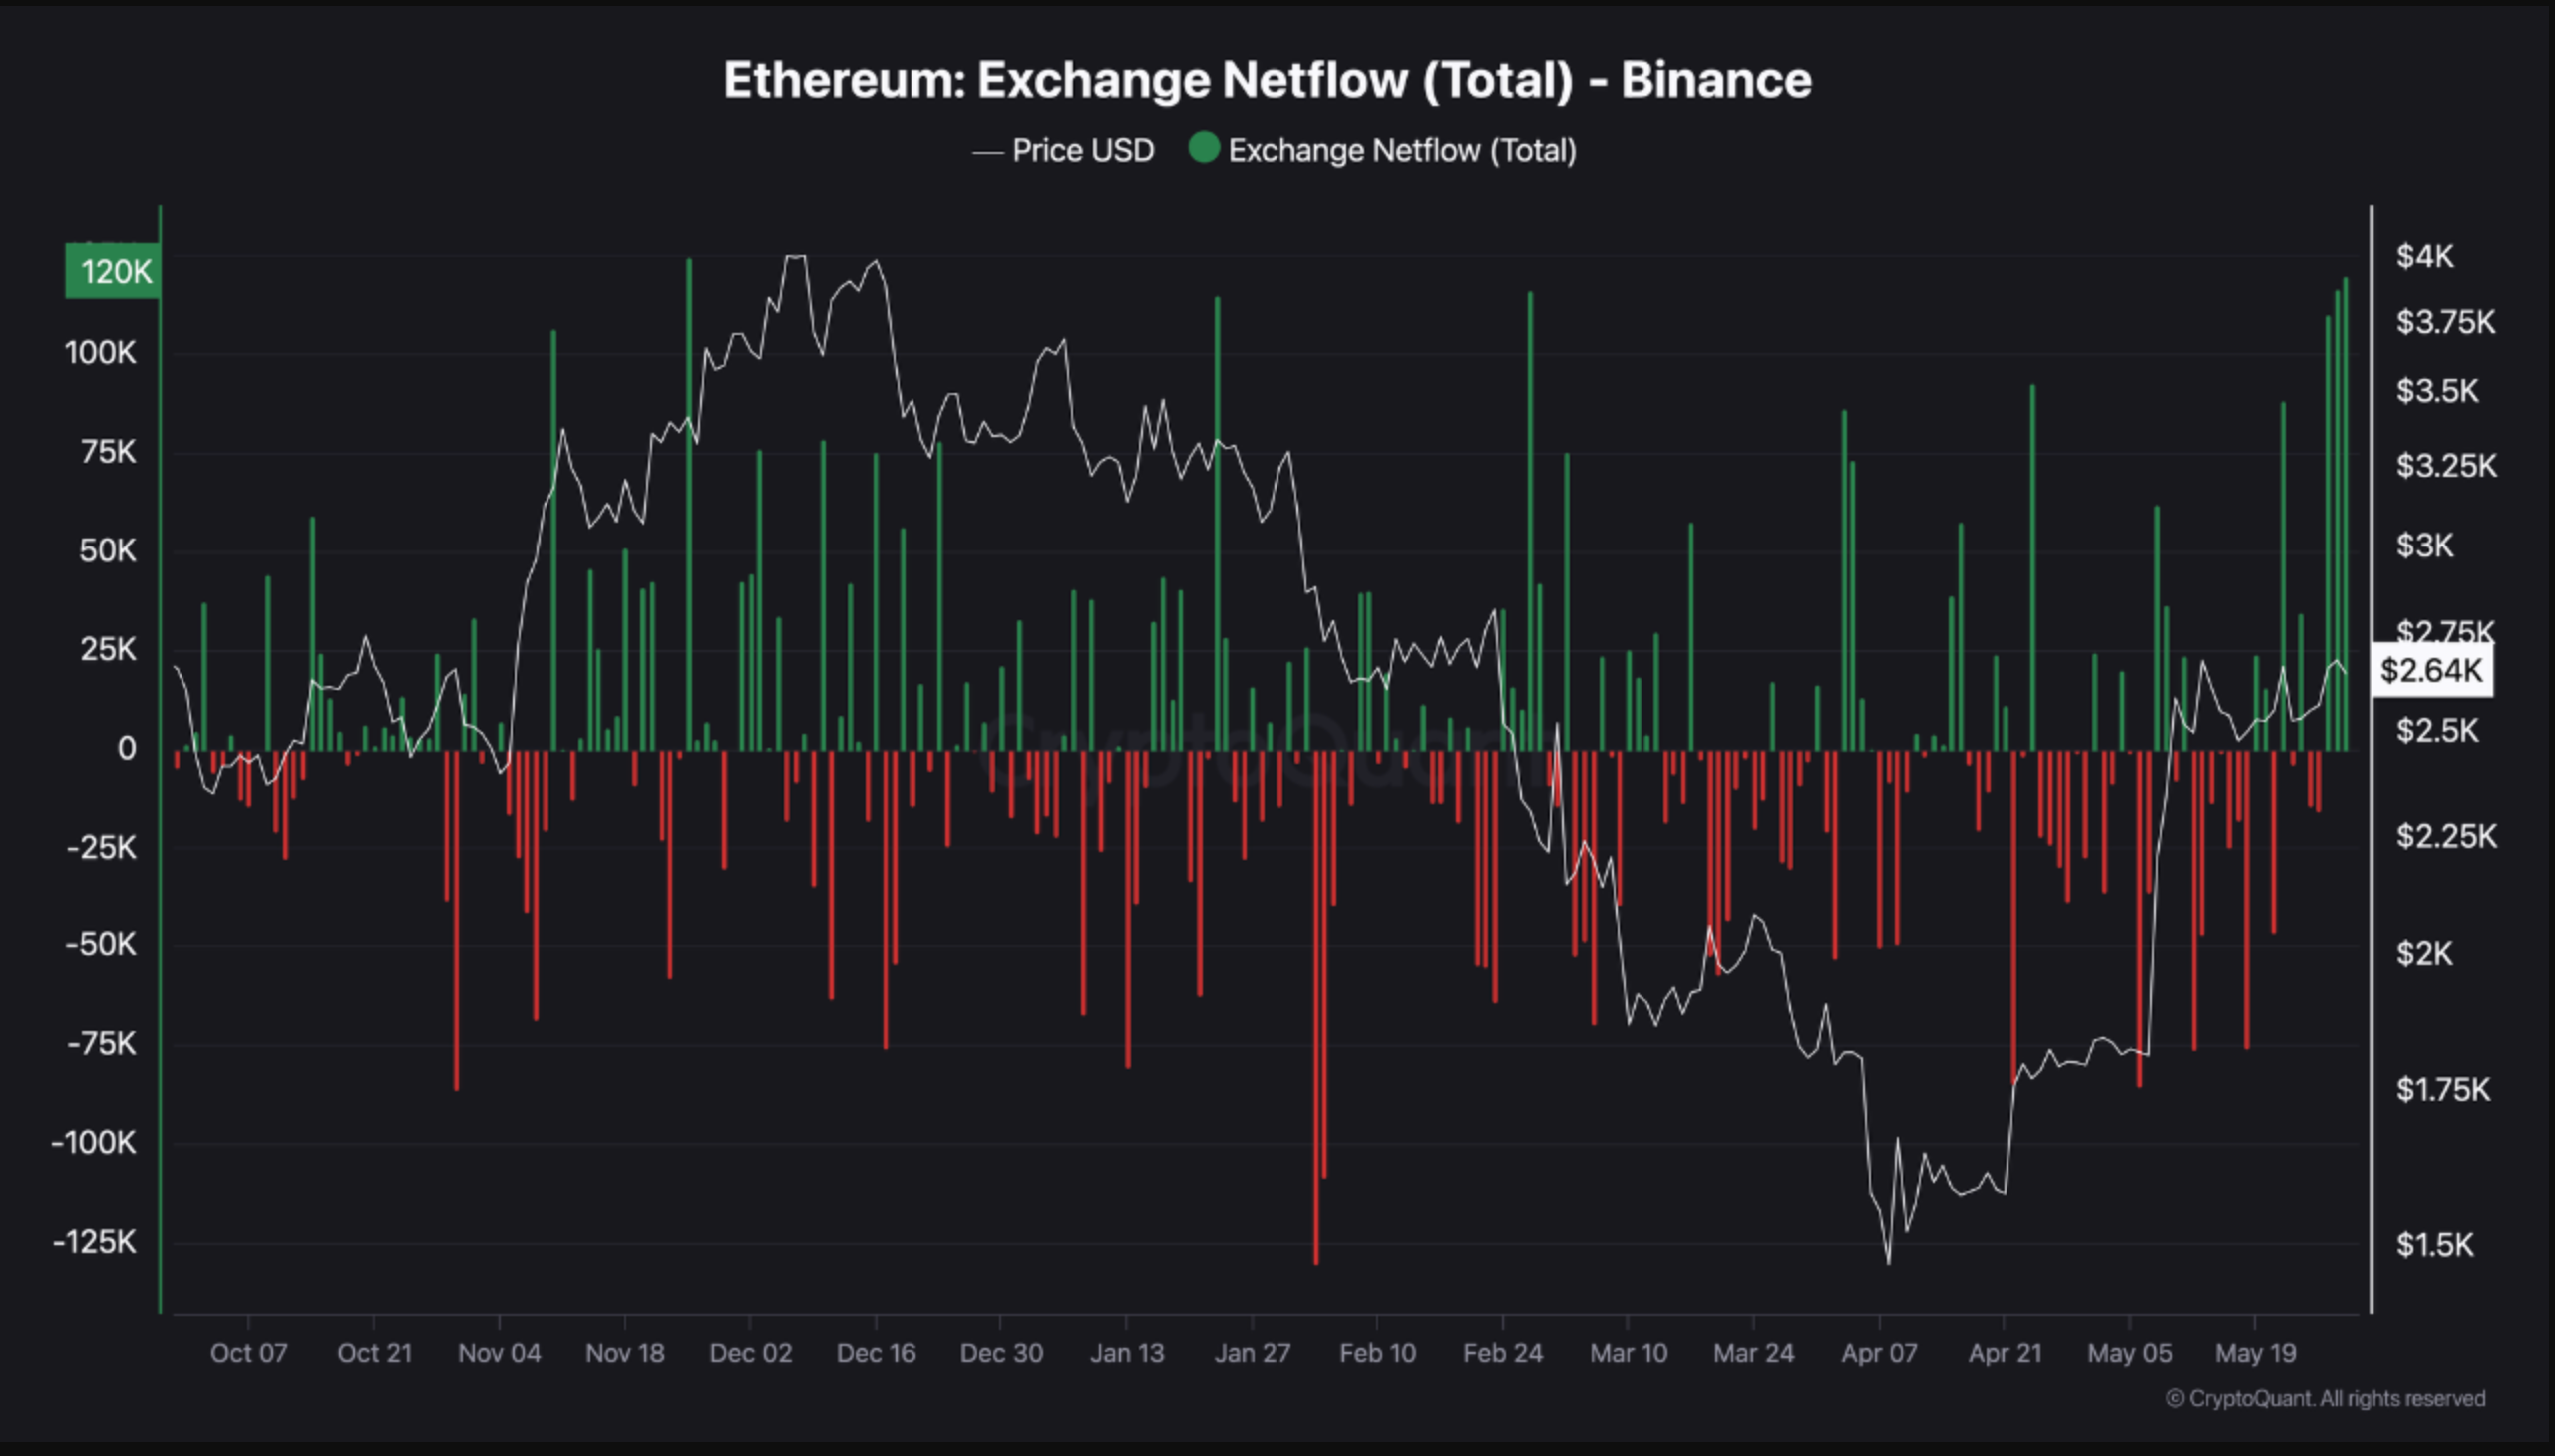
Netflow measures the difference between ETH deposits and withdrawals from an exchange. Positive values reflect net deposits—typically associated with increased selling pressure—while negative values suggest accumulation.
These large daily inflows, paired with a lack of significant price follow-through, indicate that whales used the recent bounce as an exit. The lack of upward continuation reinforces that demand was insufficient to absorb the supply.
Exchange Supply Ratio Climbs with Ethereum Price — What Does It Mean?
The Ethereum Exchange Supply Ratio—which tracks the share of ETH’s total supply held on Binance—also rose during the recent rally. As of late May, the ratio climbed back toward 0.034, up from near-yearly lows in March.
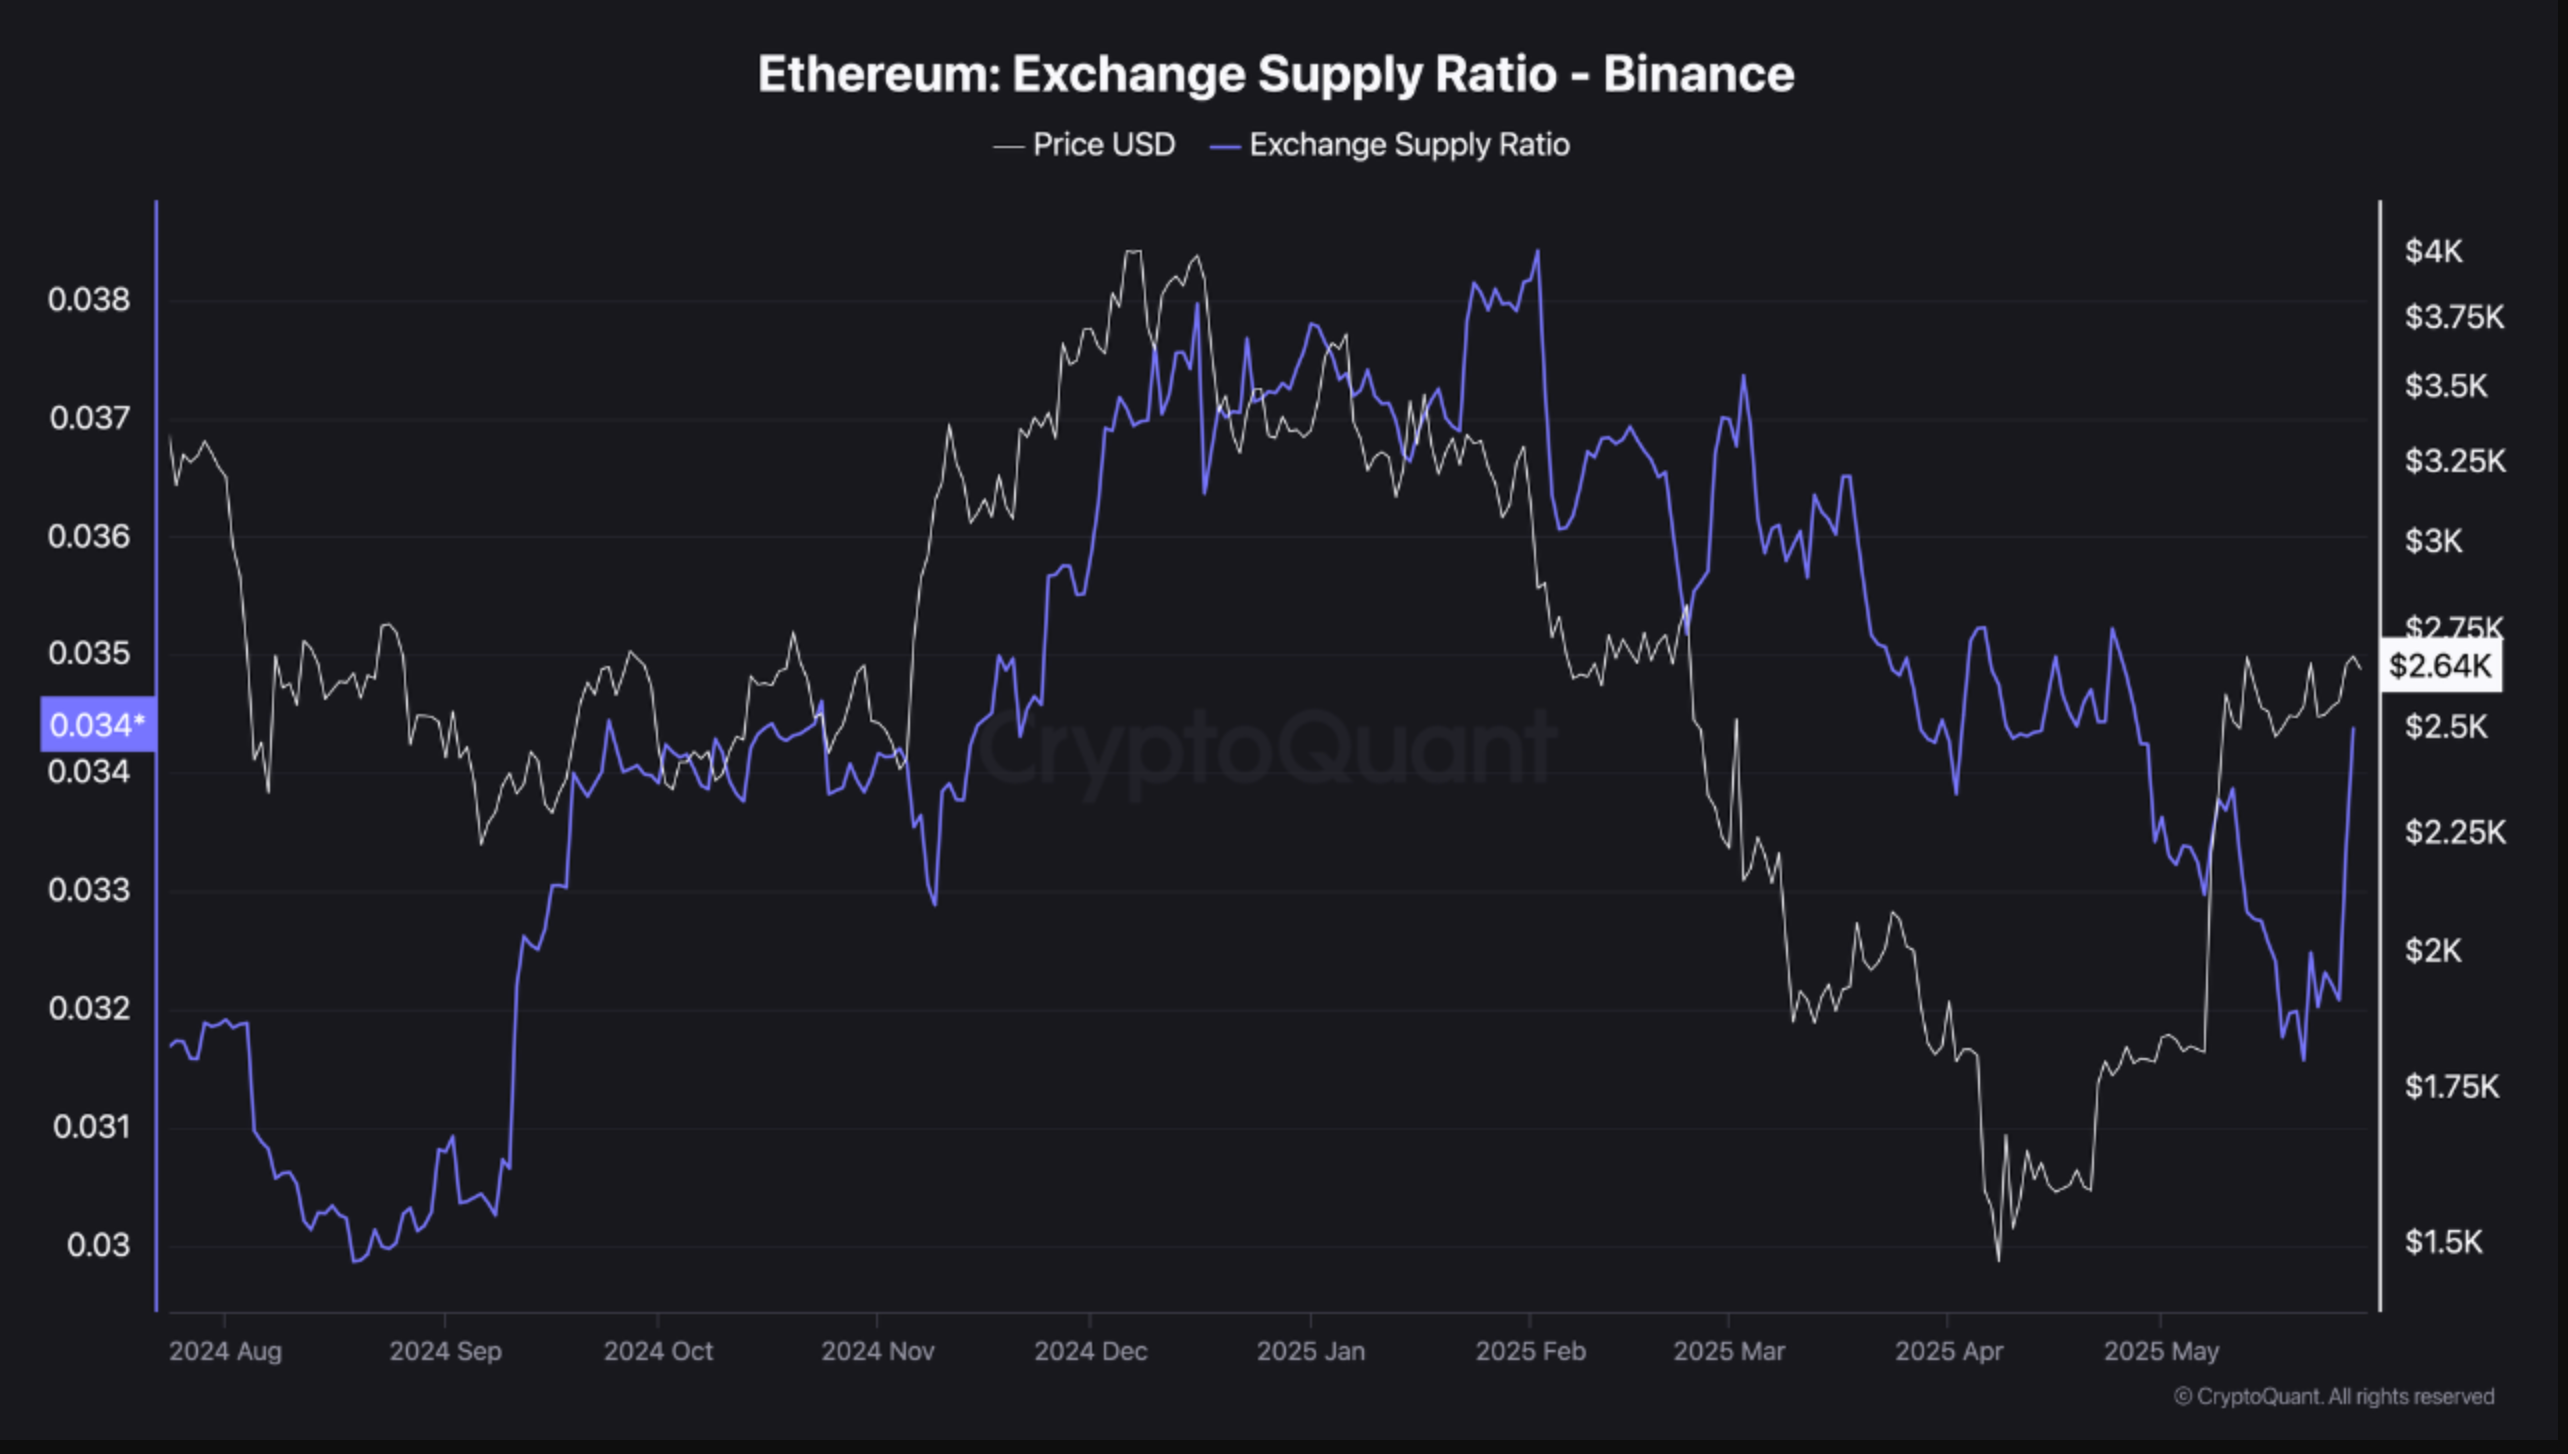
This indicator adds another layer to the bearish picture. More supply moving onto exchanges means greater potential sell pressure in the near term. As this ratio increases while price consolidates or trends higher, it suggests that sellers are becoming more active than buyers.
The alignment of a rising supply ratio with increasing reserves and net inflows strongly implies a coordinated distribution phase. Bulls may interpret stability as strength, but the underlying metrics contradict that view.
Taker Buy/Sell Ratio Hints at Ethereum Absorption
Finally, the Taker Buy/Sell Ratio reveals a critical dynamic: while ETH saw aggressive market buying during its most recent bounce, it failed to generate momentum. The ratio jumped above 1.0 on several days in late May, signaling that buyers were initiating trades at market price.

Ordinarily, such taker activity is bullish—it reflects conviction and urgency from buyers. However, when a surge in market buys fails to push the price higher, it suggests that sellers are using the demand as exit liquidity.
In essence, the rally created the illusion of strength, while whales and institutional traders sold into it. This absorption of buying power without upside follow-through typically precedes a breakdown, especially when confirmed by rising exchange reserves and netflows.
Ethereum Price Prediction/Forecast — What Do Technical Indicators Say
Ethereum has formed a clear inverse head-and-shoulders pattern on the daily chart, pointing to a potential breakout toward $4,150 if the neckline at $2,700 is breached. The structure, coupled with a recent golden cross, suggests bullish momentum could build—if confirmed.
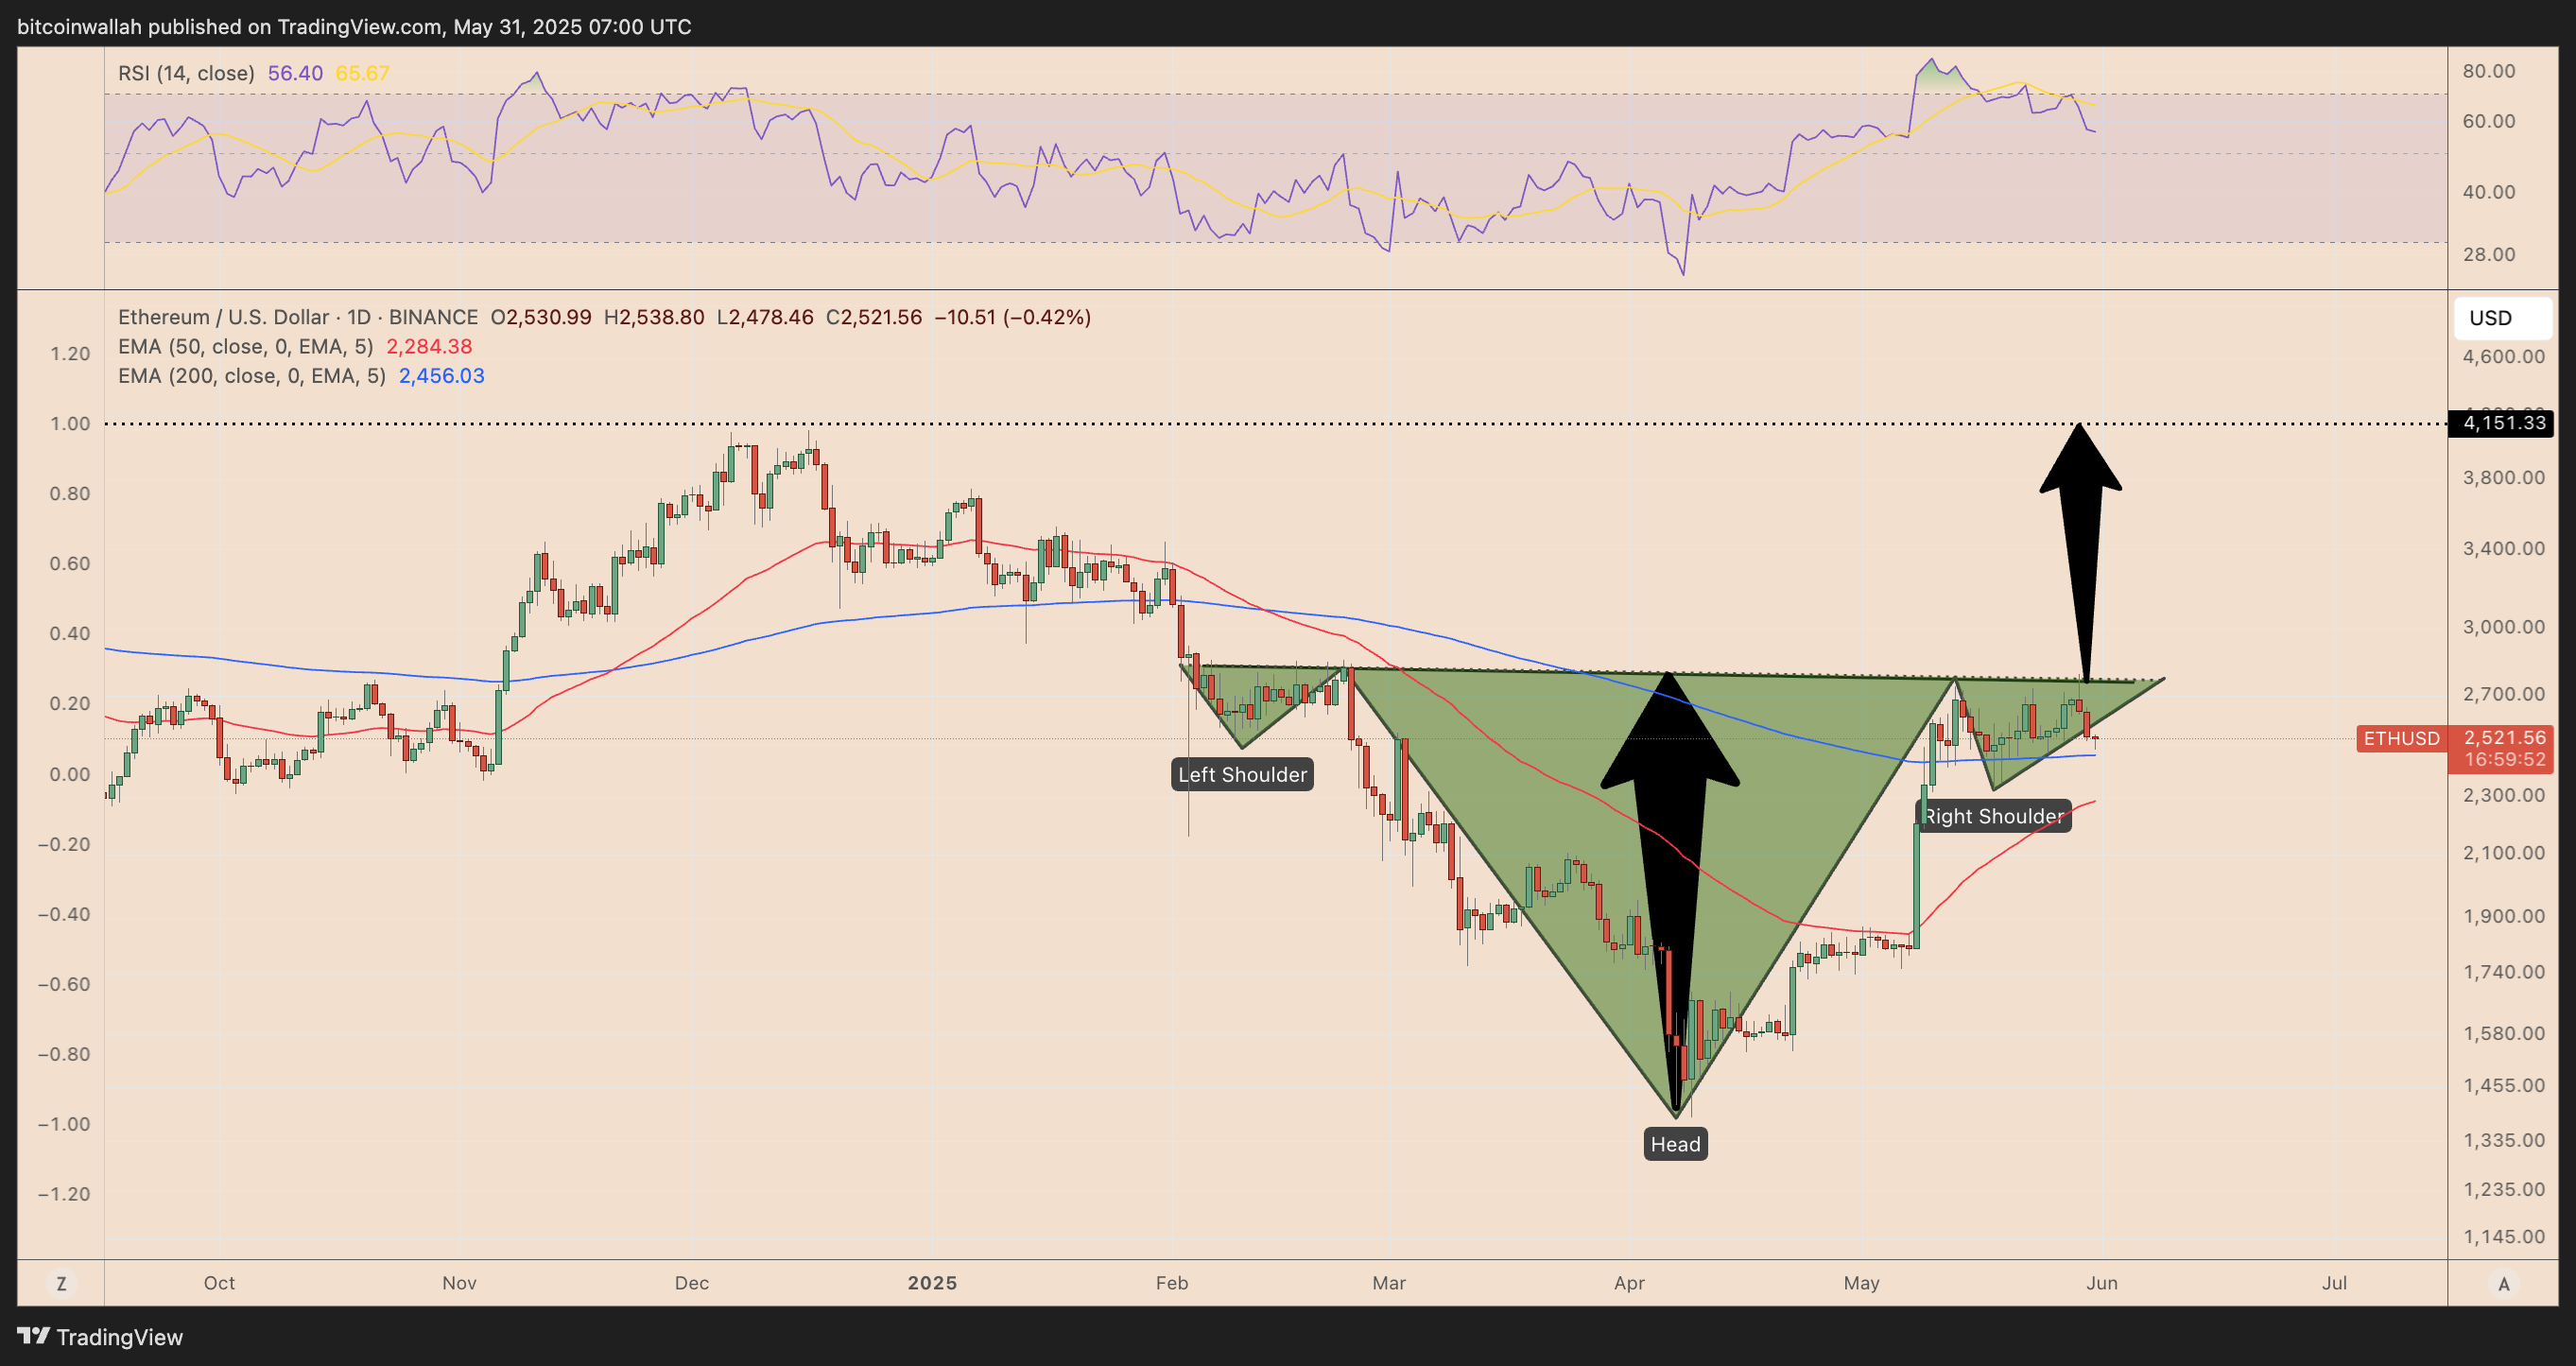
ETH continues to face rejection near the neckline, and volume remains weak. The relative strength index (RSI) is correcting after breaching the overbought threshold of 70. At 56, it shows room for further downside.
A decisive close above $2,700 is needed to validate the breakout. Failure to do so risks a drop toward $2,300 or lower, invalidating the bullish setup.
Ethereum Price Forecast on Weekly Chart Indicates ~60% Crash Next
Ethereum is testing a critical resistance confluence near $2,530, formed by a flipped multi-year ascending trendline, the upper boundary of a descending wedge, and the 0.382 Fib level. So far, ETH has failed to break above this zone.
Adding pressure is the 50-week EMA near $2,575, which ETH has not decisively closed above. This keeps the broader trend bearish.
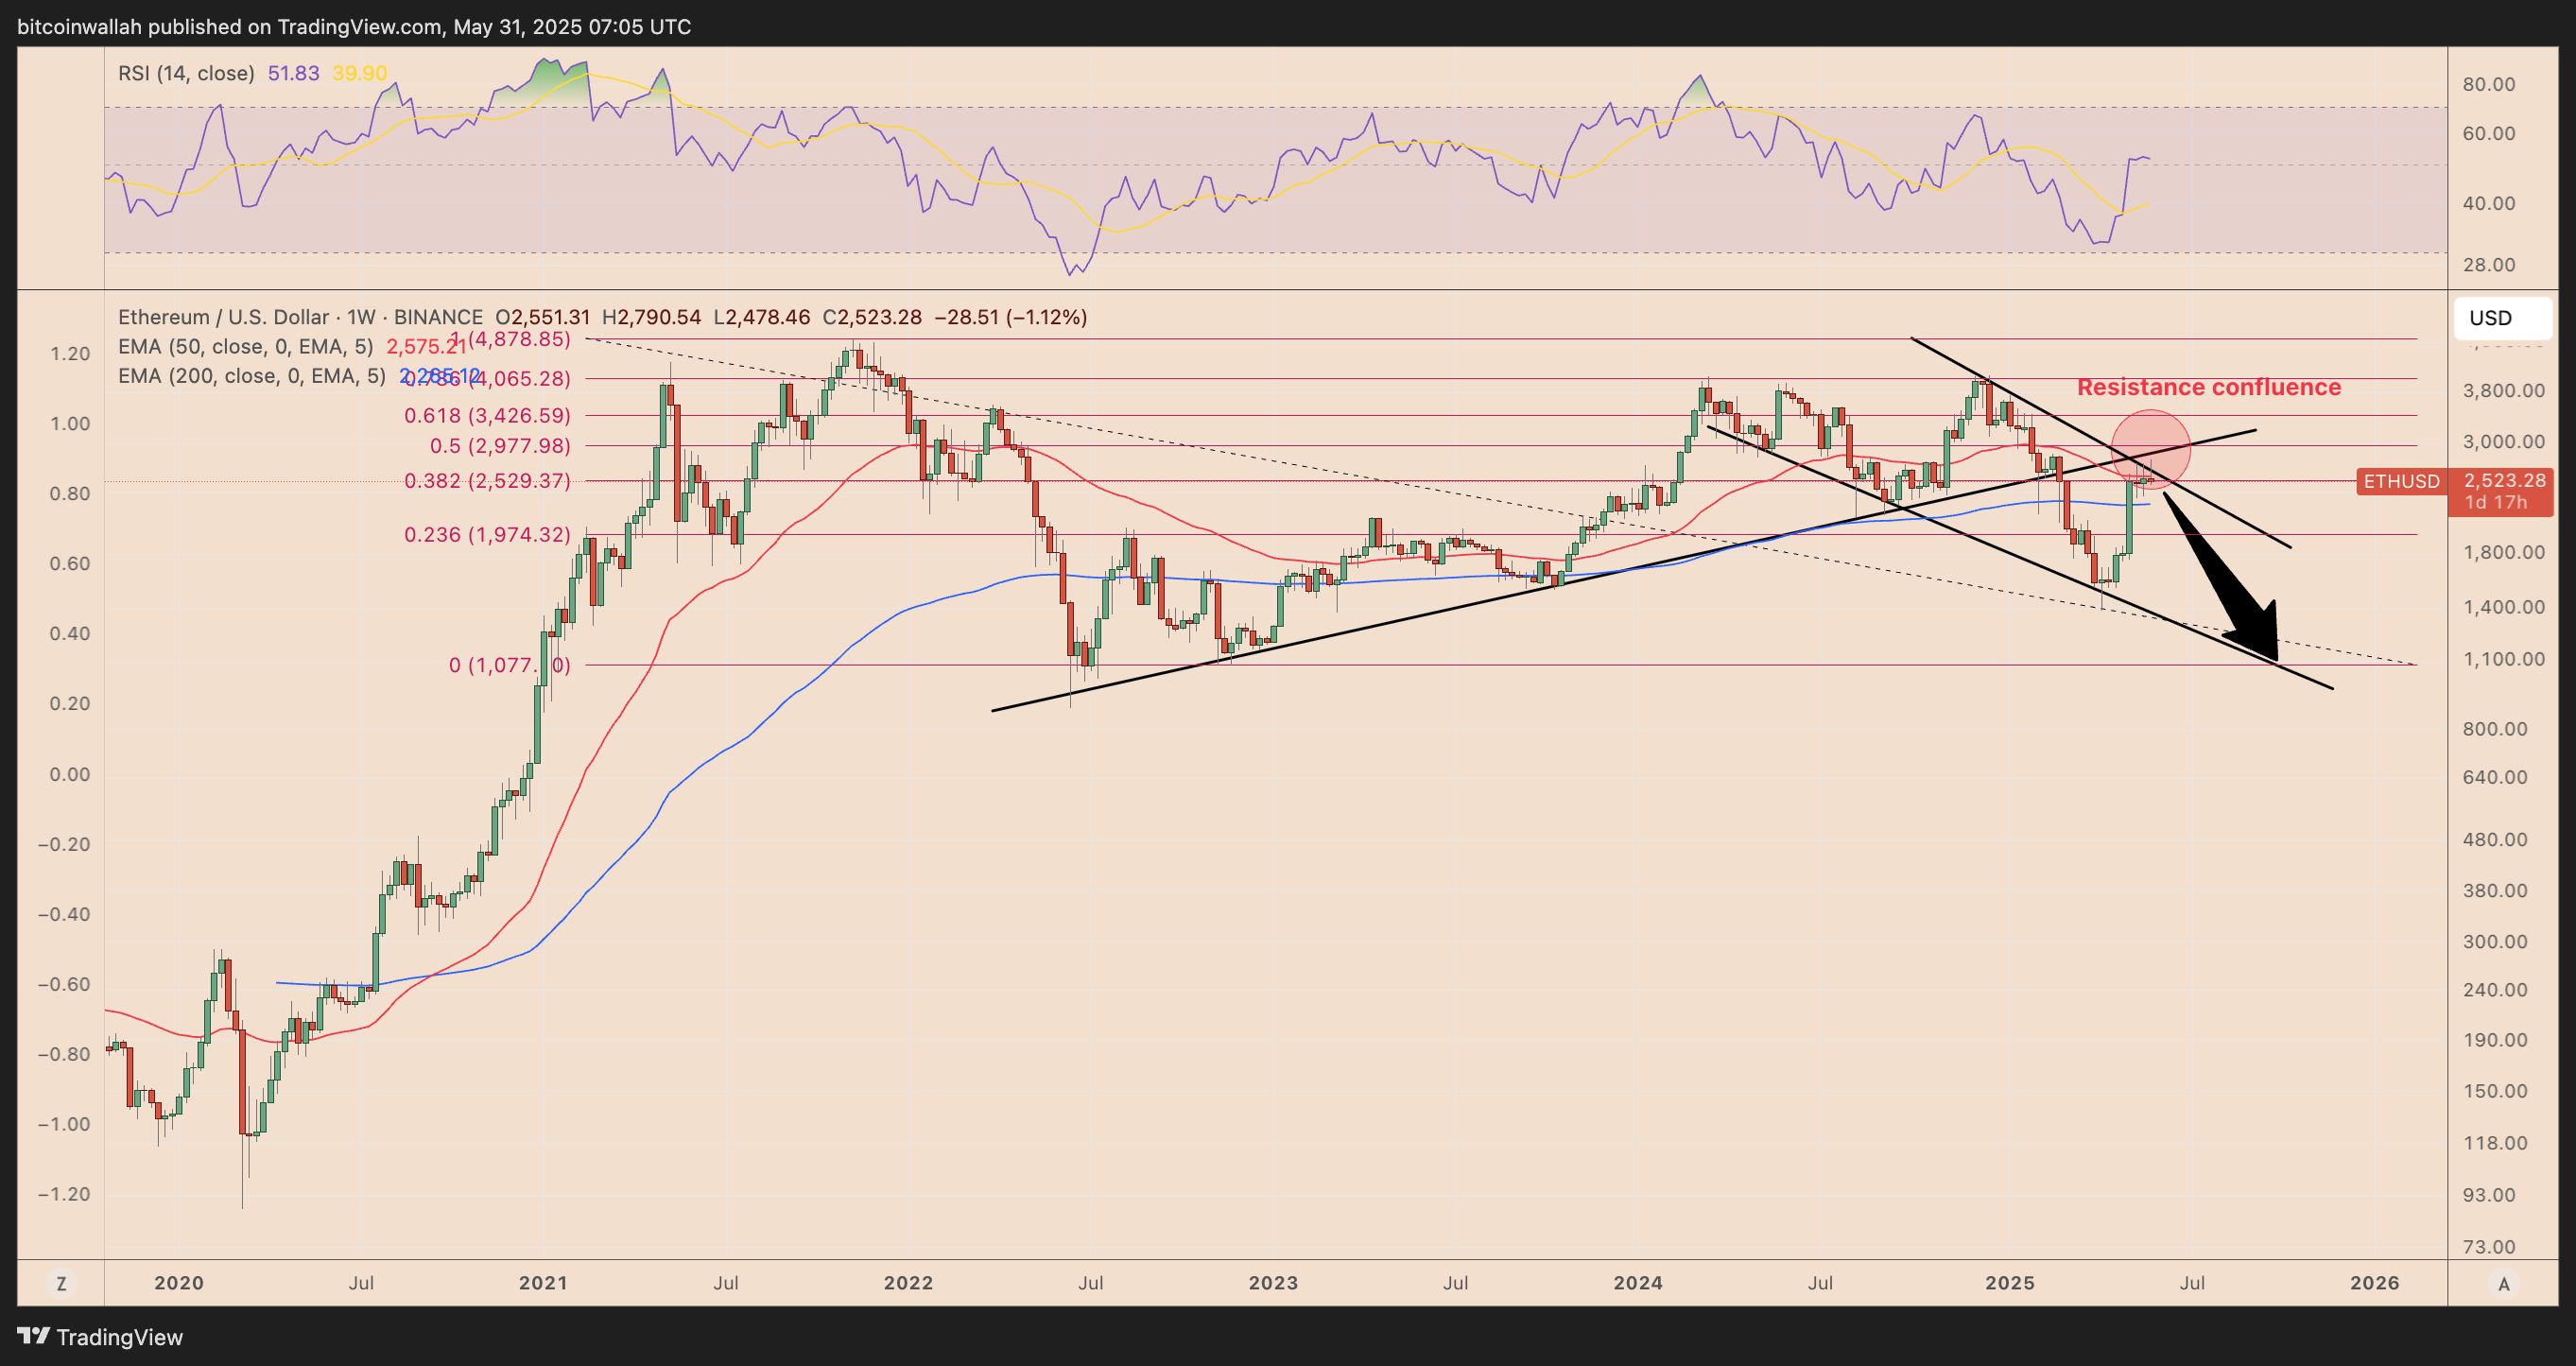
A rejection from this confluence could trigger a drop to the wedge’s lower boundary near $1,975, with extended downside toward the 0.0 Fib level at $1,075. The risk of breakdown remains high unless ETH reclaims $2,575 with strong volume.
About the Author
Bob MasonChief Crypto Boss
123456789 30 He has written extensively for a broader audience and his current focus is on developments relating to the financial markets including, but not limited to currencies, commodities, alternative asset classes, and global equities.


Advertisement