
Advertisement
Advertisement
EUR/USD, GBP/USD, DXY Forecast: Dollar Slips Below 105.500; More Selling Ahead?
By:
Key Points:
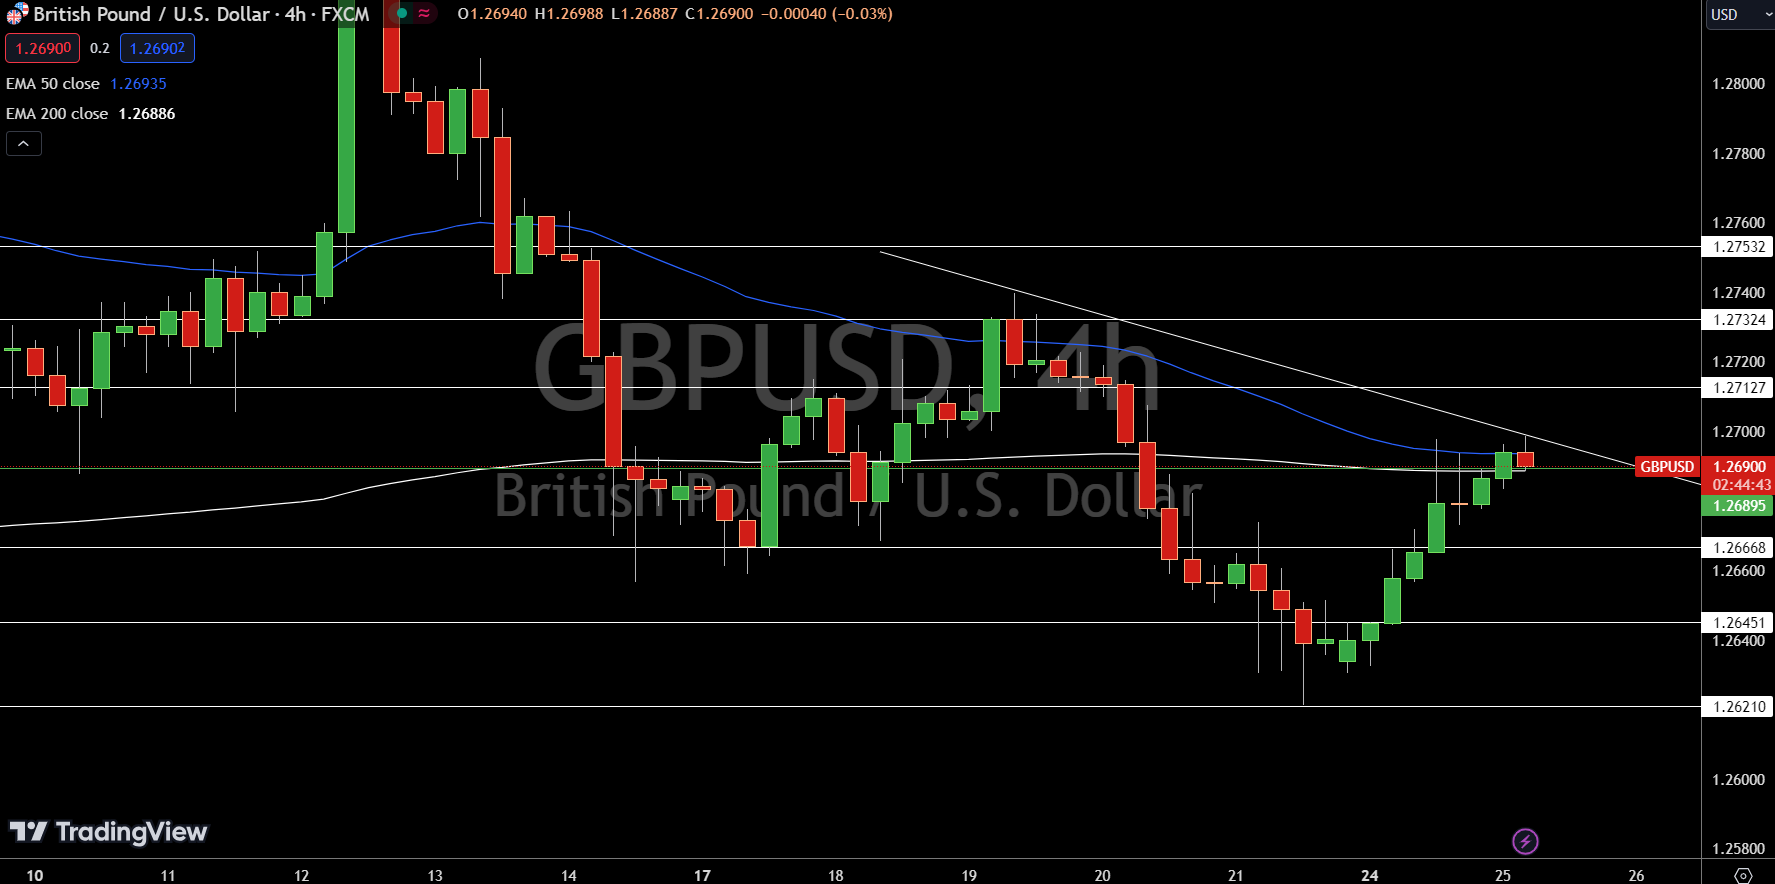
- UK CBI Industrial Order Expectations improved, boosting GBP/USD to 1.26900, up 0.15%.
- Dollar Index slipped to 105.375 as traders awaited Fed rate guidance.
- US focus on FOMC speeches and S&P/CS Composite-20 HPI, CB Consumer Confidence data.

In this article:
Market Overview
Testing if the Script removes internal Article URL
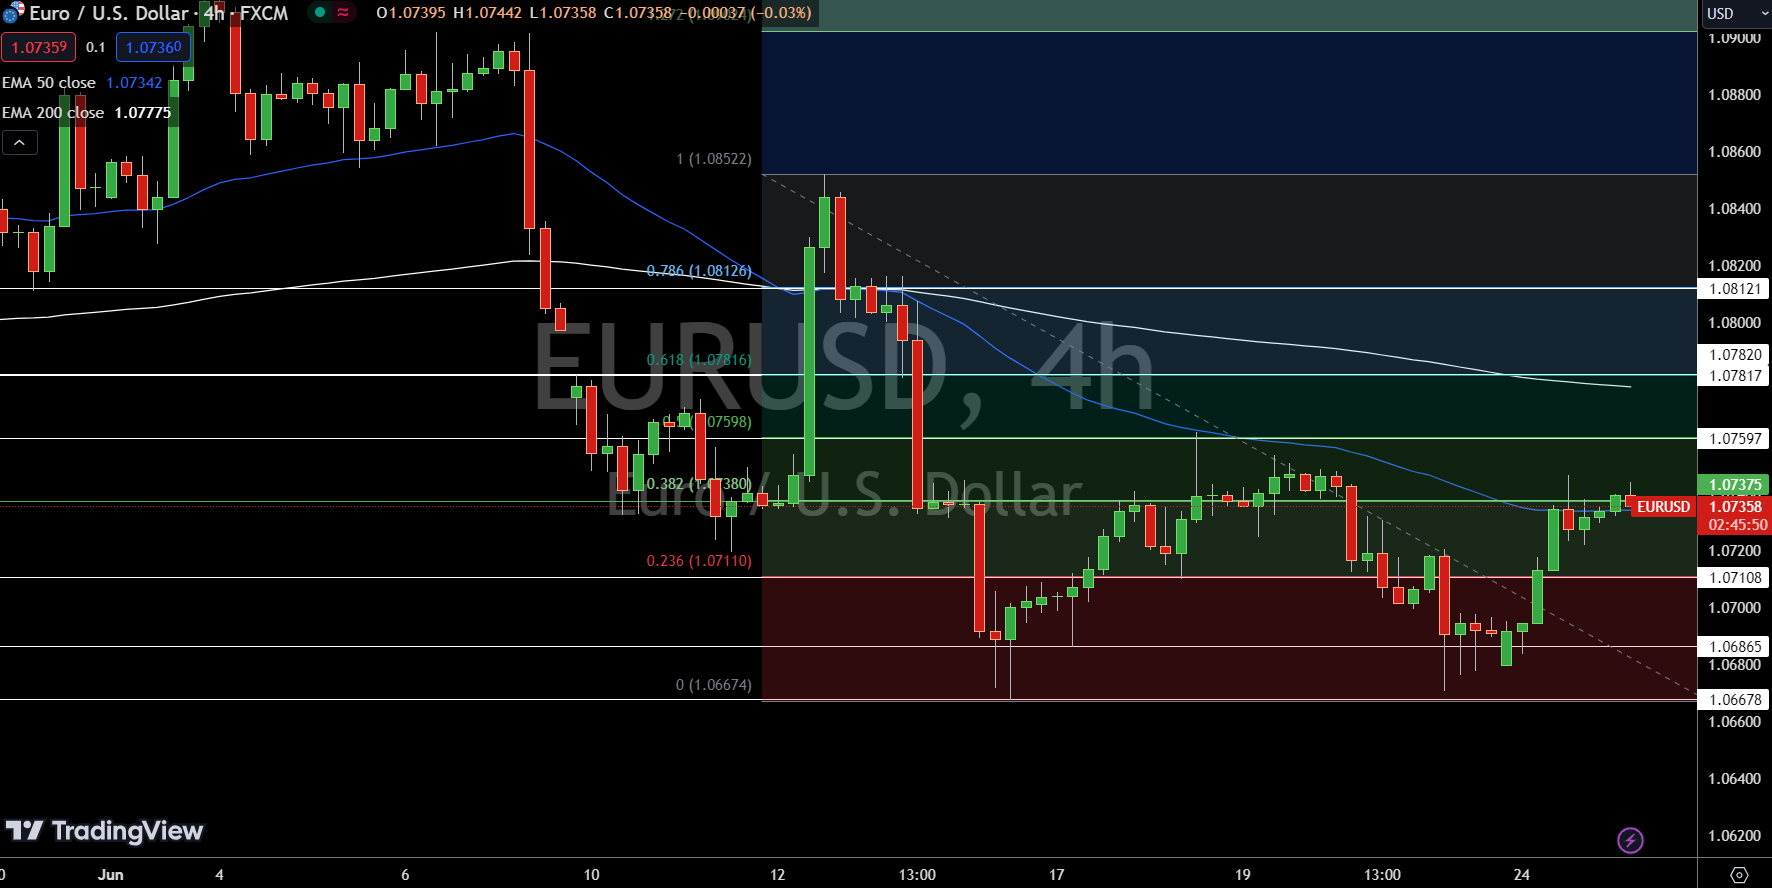
On Monday, the Eurozone faced mixed results with the German Ifo Business Climate Index slightly below forecast at 88.6, compared to the expected 89.4 and previous 89.3. This underperformance in German economic sentiment exerted downward pressure on EUR/USD.
Meanwhile, in the UK, the CBI Industrial Order Expectations showed a better-than-expected improvement, rising to -18 from -33, supporting a mild gain in GBP/USD to 1.26900, up 0.15%.
For the US, FOMC Member Waller’s speech and the anticipation of Member Daly’s evening address kept the Dollar Index under scrutiny. The index was slightly down at 105.375, reflecting a 0.09% drop, as traders awaited further clarity on the Federal Reserve’s interest rate trajectory.
Events Ahead
Looking ahead to Tuesday, several key events are likely to shape market dynamics. Early in the day, Australia’s Westpac Consumer Sentiment report is expected, followed by Japan’s BOJ Core CPI year-on-year, forecasted at 2.1%. In the US, speeches from FOMC members Bowman and Cook will be crucial.
Additionally, the S&P/CS Composite-20 HPI year-on-year is anticipated at 7.0%, alongside the CB Consumer Confidence index, projected to drop to 100.0 from 102.0.
Market participants will be closely watching the outcomes to adjust their strategies accordingly, particularly in response to any signals from the Federal Reserve regarding future rate changes.
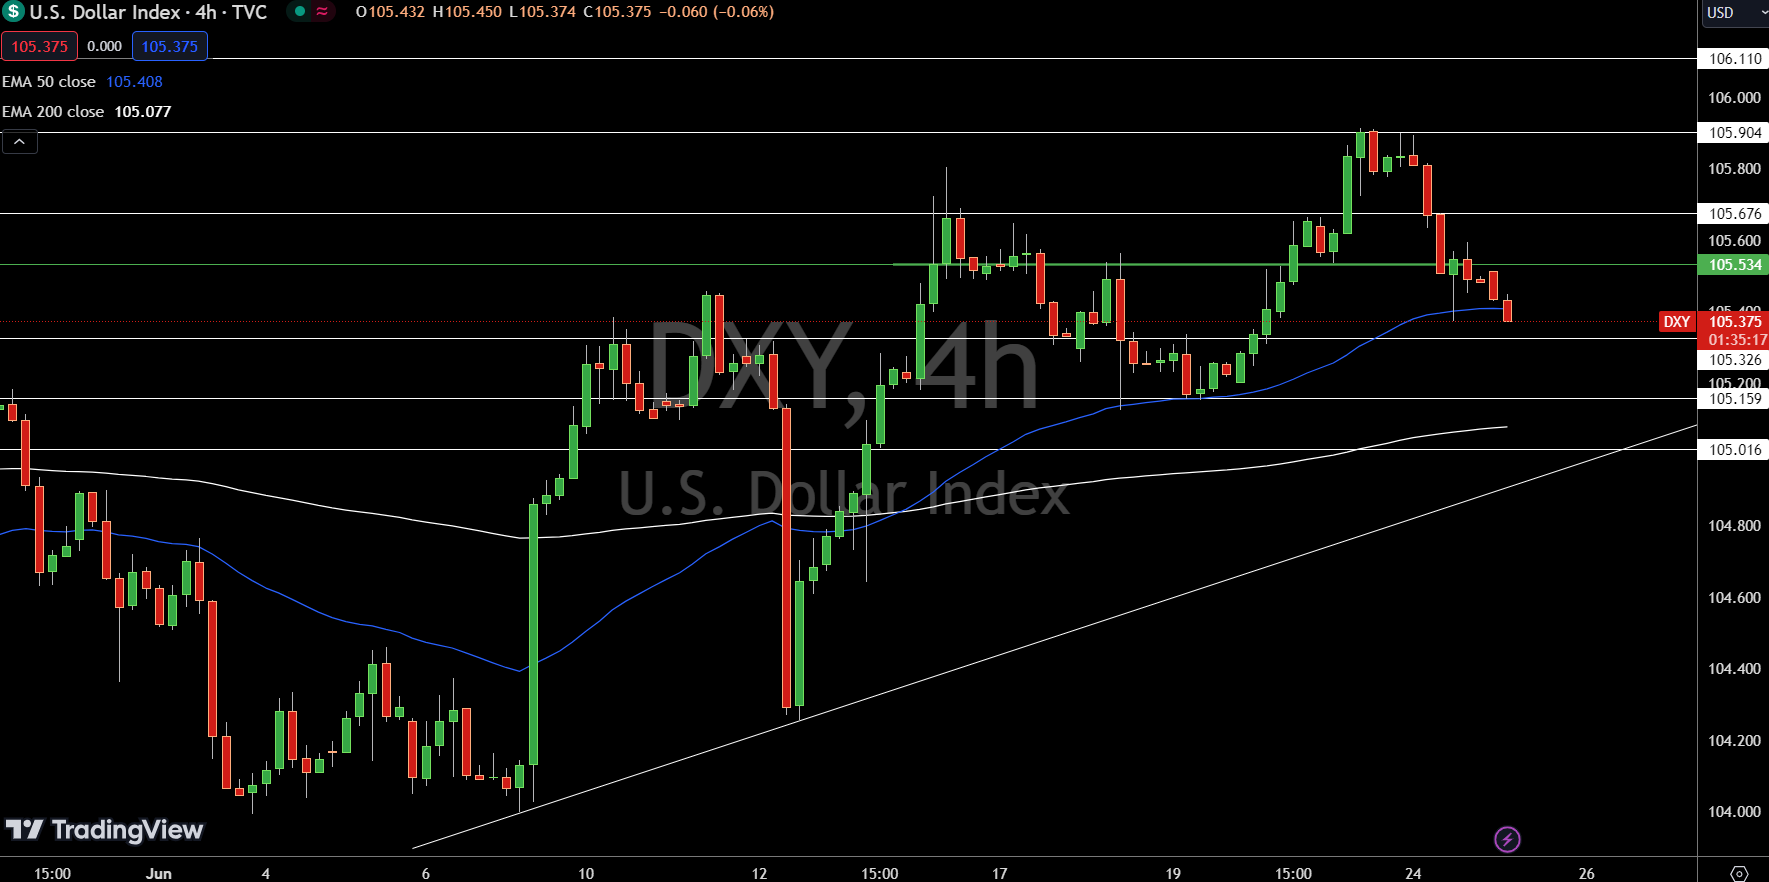
The Dollar Index is trading at $105.375, down 0.09%. On the 4-hour chart, the pivot point is at $105.534. Immediate resistance levels are at $105.676, $105.904, and $106.110. Support levels are $105.326, $105.159, and $105.016.
The 50-day Exponential Moving Average (EMA) is at $105.408, and the 200-day EMA is at $105.077, indicating short-term support.
The outlook remains bearish below the pivot point of $105.534. However, a break above this level could shift the bias to a bullish trend.
EUR/USD Technical Forecast
About the Author
Bob MasonChief Crypto Boss
TEST 30 He has written extensively for a broader audience and his current focus is on developments relating to the financial markets including, but not limited to currencies, commodities, alternative asset classes, and global equities.
Latest news and analysis


Advertisement