
Advertisement
Advertisement
Gold Corrects Lower as Markets Seek Safety in US Dollar
By:
Key Points:
- Gold (XAU) corrects lower from the strong resistance zone of $2,900–$3,000.
- US Treasury Yield (TNX) hits support at 4.24%.
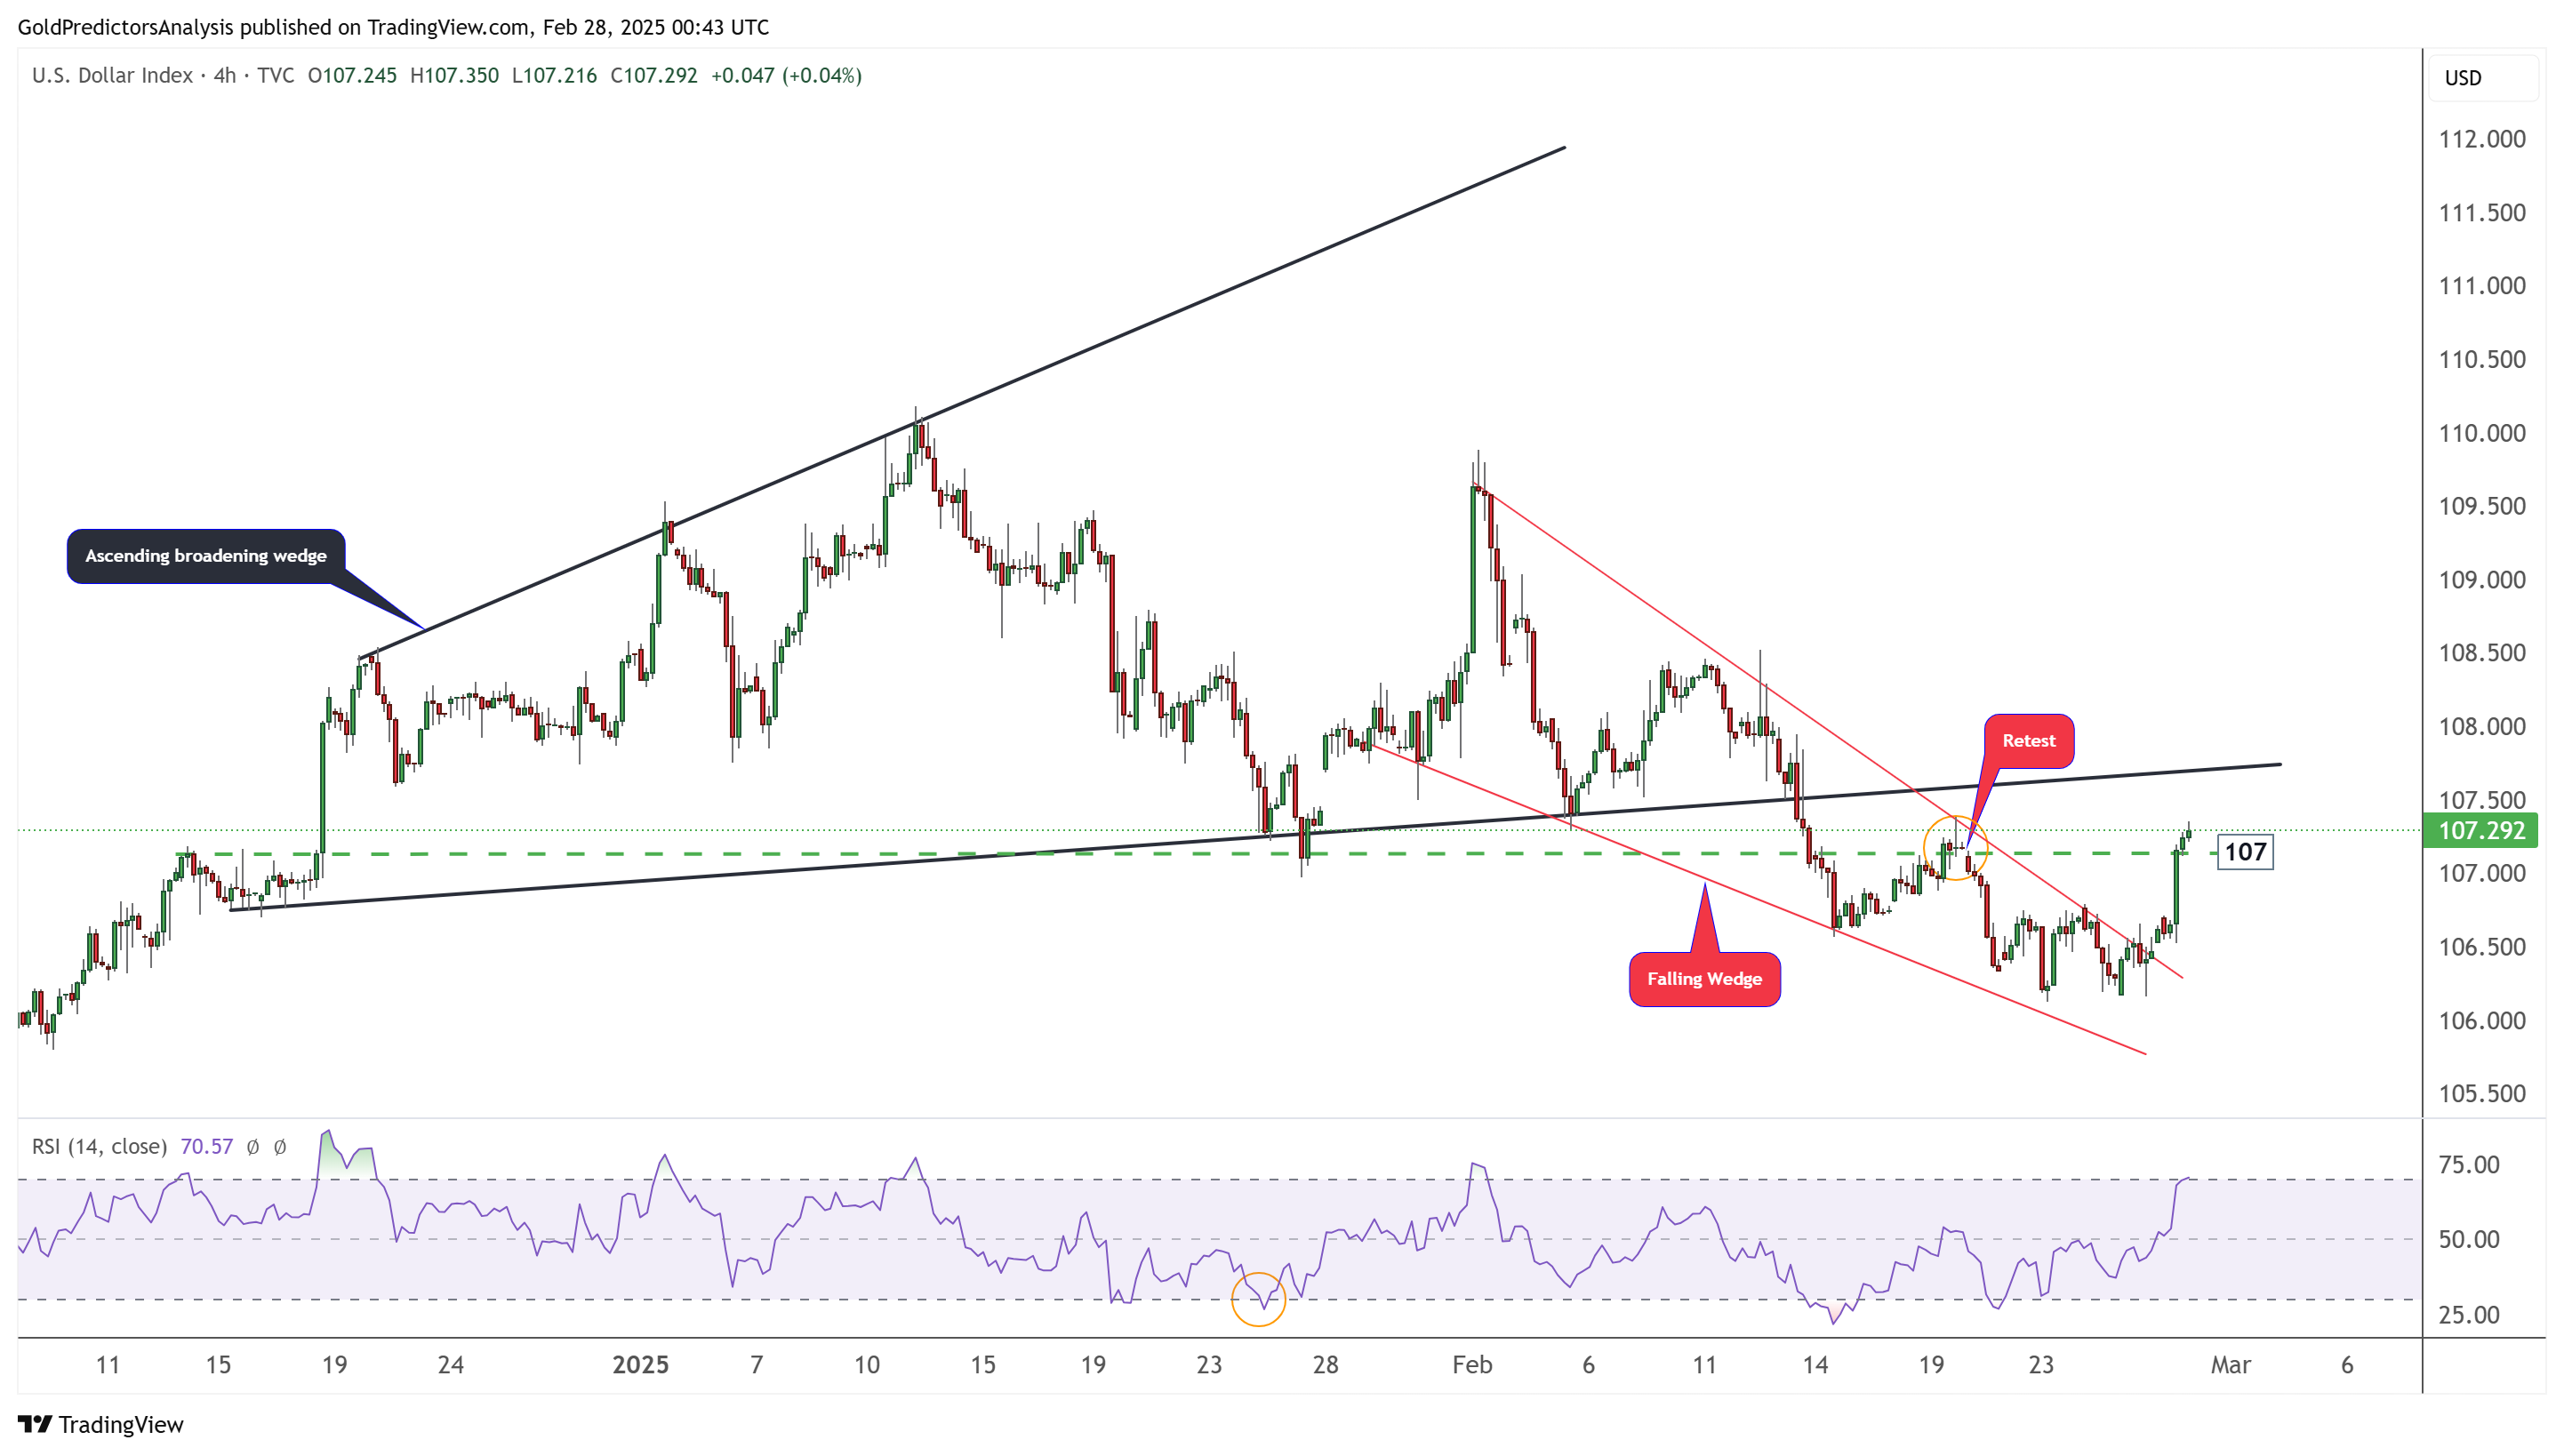
- US Dollar Index rebounds from strong support and rises above 107.

Gold (XAU) prices drop after hitting the strong resistance band of $2,900–$3,000 as the US Dollar rebounds due to increased risk aversion. US economic data is mixed. GDP growth remains stable at 2.3%, but inflation indicators show an uptick. Core PCE prices rise to 2.7%, indicating concerns about persistent inflation. These figures strengthen the case for the Federal Reserve to maintain a cautious stance, supporting the US Dollar and pressuring gold.
On the other hand, labour market data shows weakness, with Initial Jobless Claims rising to 242K, surpassing expectations. However, Durable Goods Orders exceed forecasts, growing by 3.1% in January. Meanwhile, a steep drop in Pending Home Sales indicates a potential economic slowdown. Despite mixed data, market sentiment leans toward risk aversion, boosting the US Dollar as a safe-haven asset. This shift weighs on gold prices, pushing them toward a weekly low.
Moreover, geopolitical concerns also impact gold’s momentum. US President Donald Trump confirmed new tariffs on Canada, Mexico, and China, with implementation dates moved forward. The uncertainty surrounding trade tensions increases volatility in financial markets. However, investors seek refuge in the US Dollar instead of benefiting from gold as a traditional safe haven. With the upcoming release of the PCE Price Index, gold may remain under pressure if inflation data supports a stronger dollar.
Gold (XAU) Technical Analysis
Gold Daily Chart – Correction
The daily chart for gold shows that the price has started to correct lower from the resistance area of $2,900–$3,000. Strong support lies around $2,865; a break below this level could trigger a move toward the $2,800 zone. However, a break above $2,950 will indicate further upside. The RSI is correcting from the overbought region, suggesting further downside. However, the price structure within the ascending broadening wedge and the ascending channel suggests that this correction will likely create another buying opportunity, targeting the $3,000 and $3,200 regions.

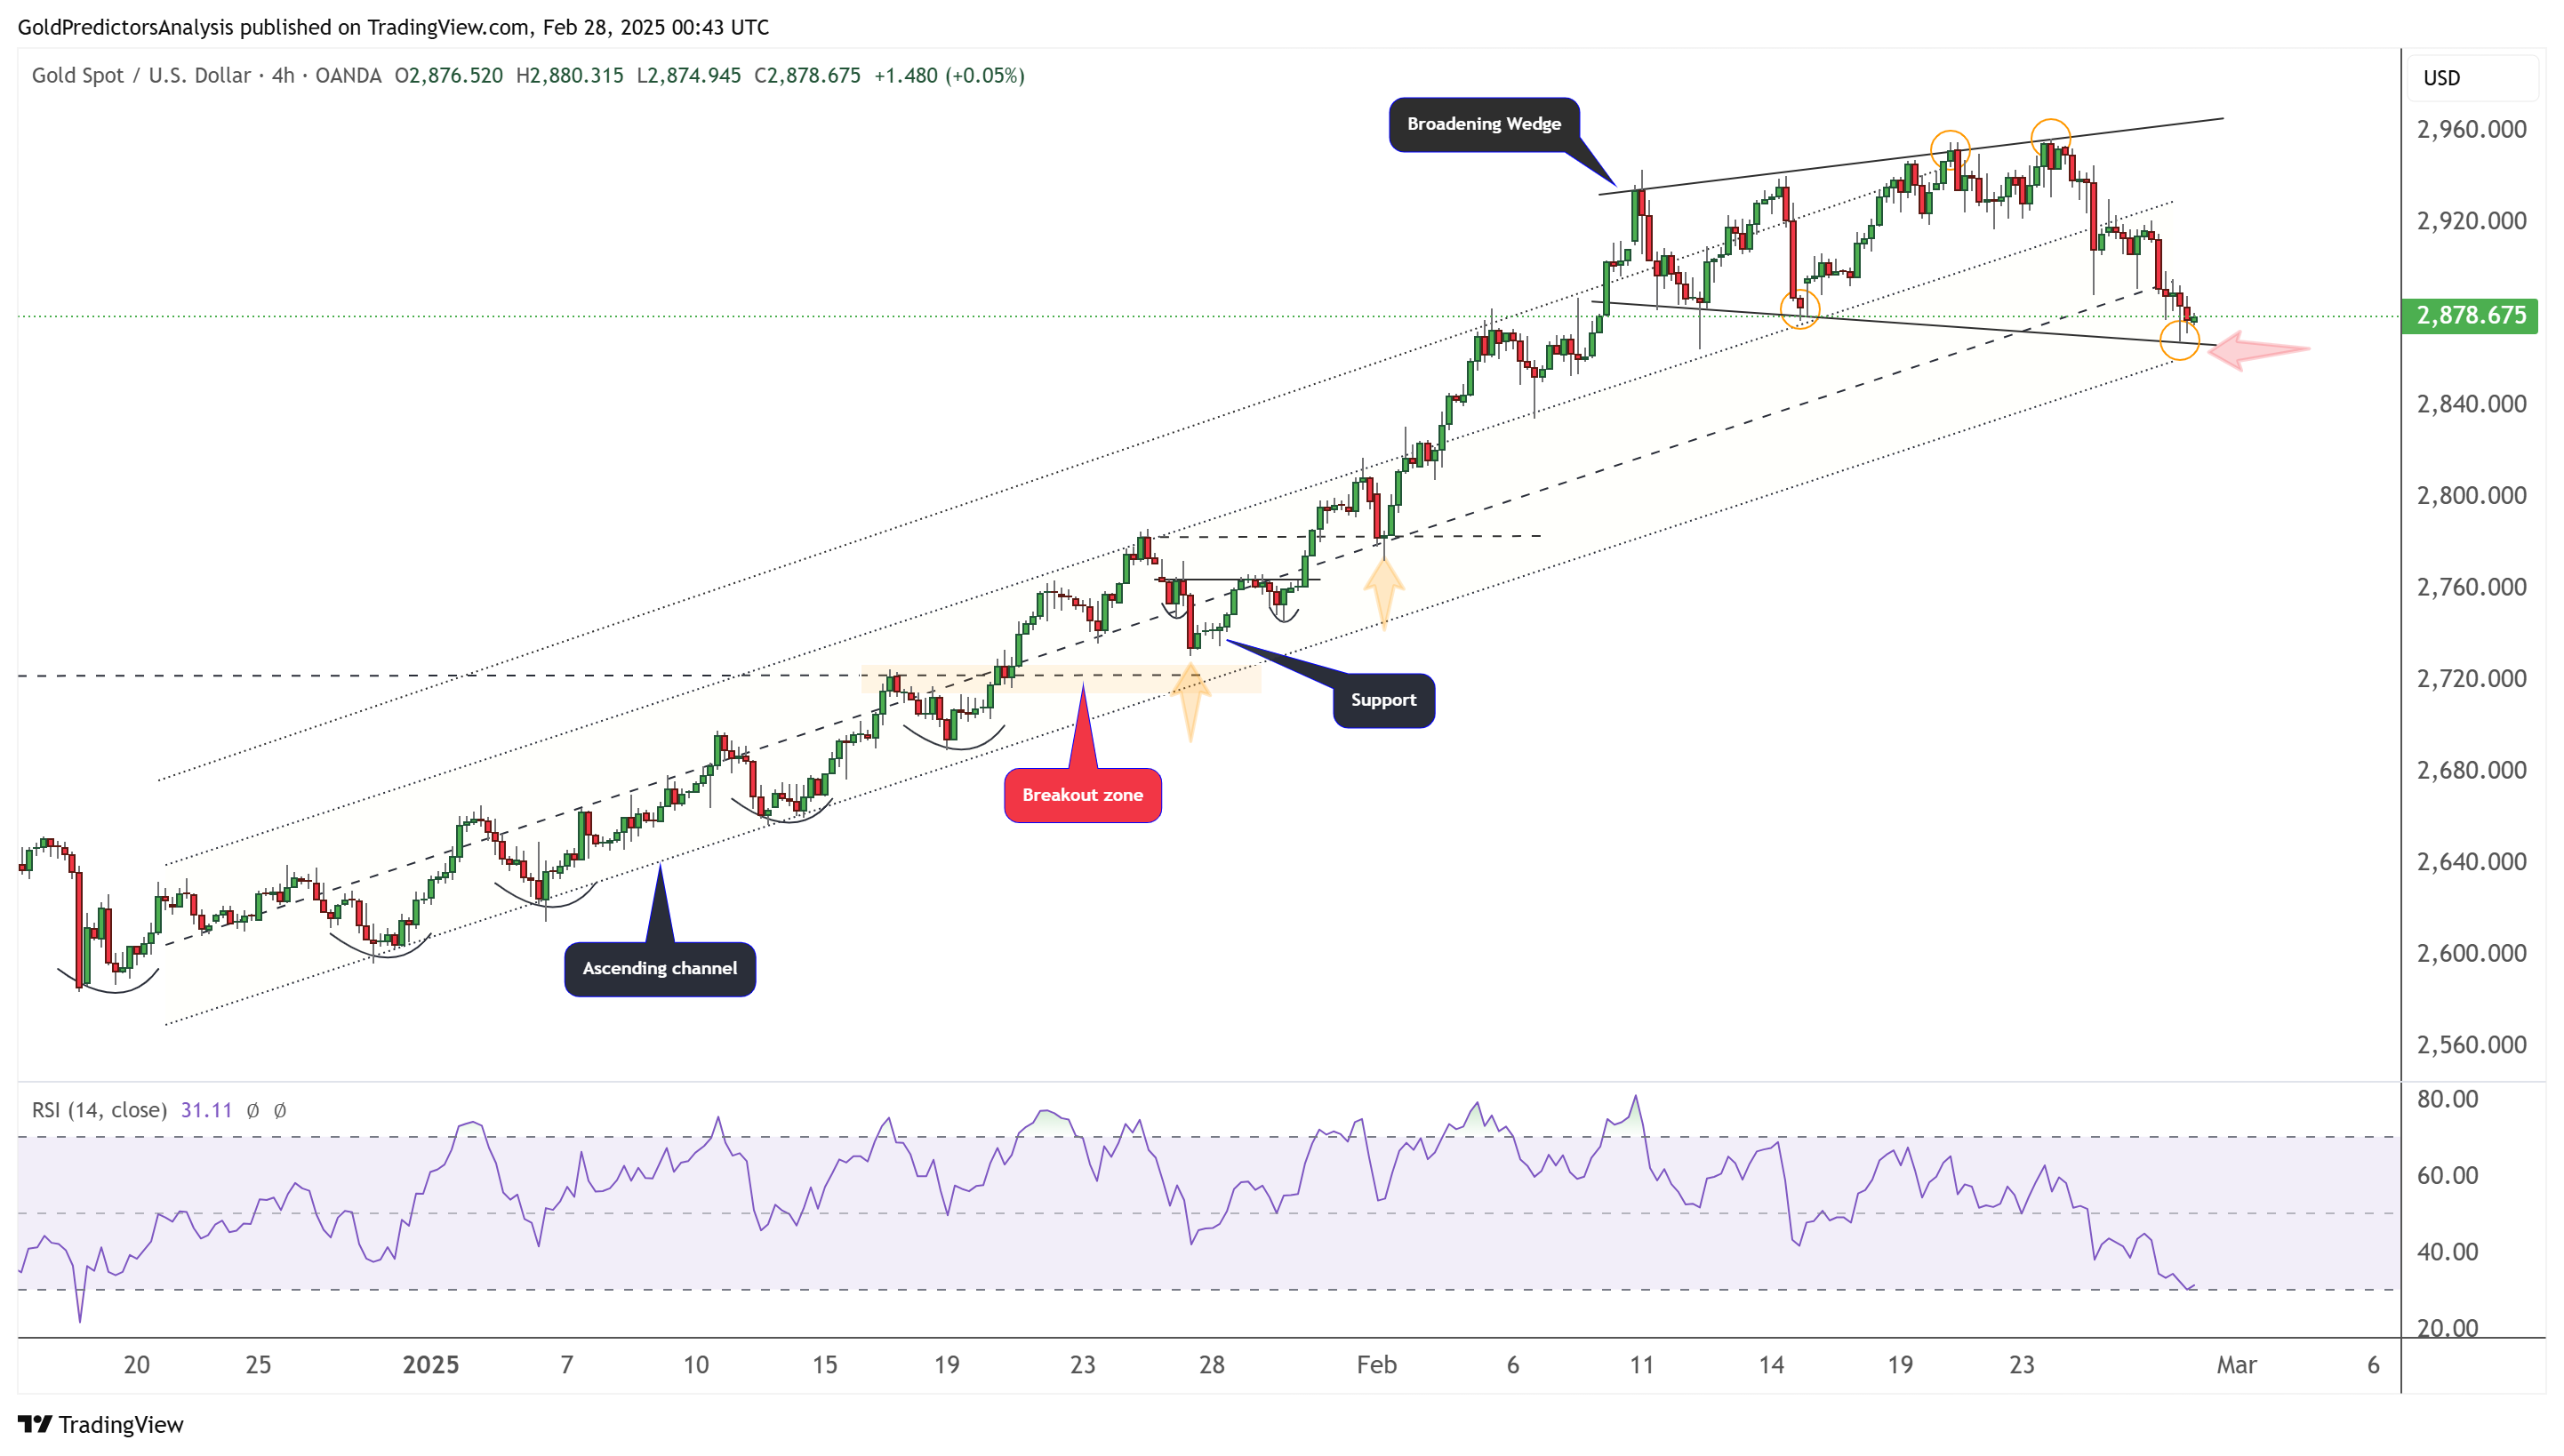
Gold 4-Hour Chart – Broadening Wedge
The 4-hour chart shows that the price has been trading within a broadening wedge pattern and is approaching the support level of this wedge. The immediate support lies around $2,865; a break below this level will open the door for further downside. The RSI is approaching oversold levels, indicating a potential rebound.
Treasury Yields (TNX) Technical Analysis
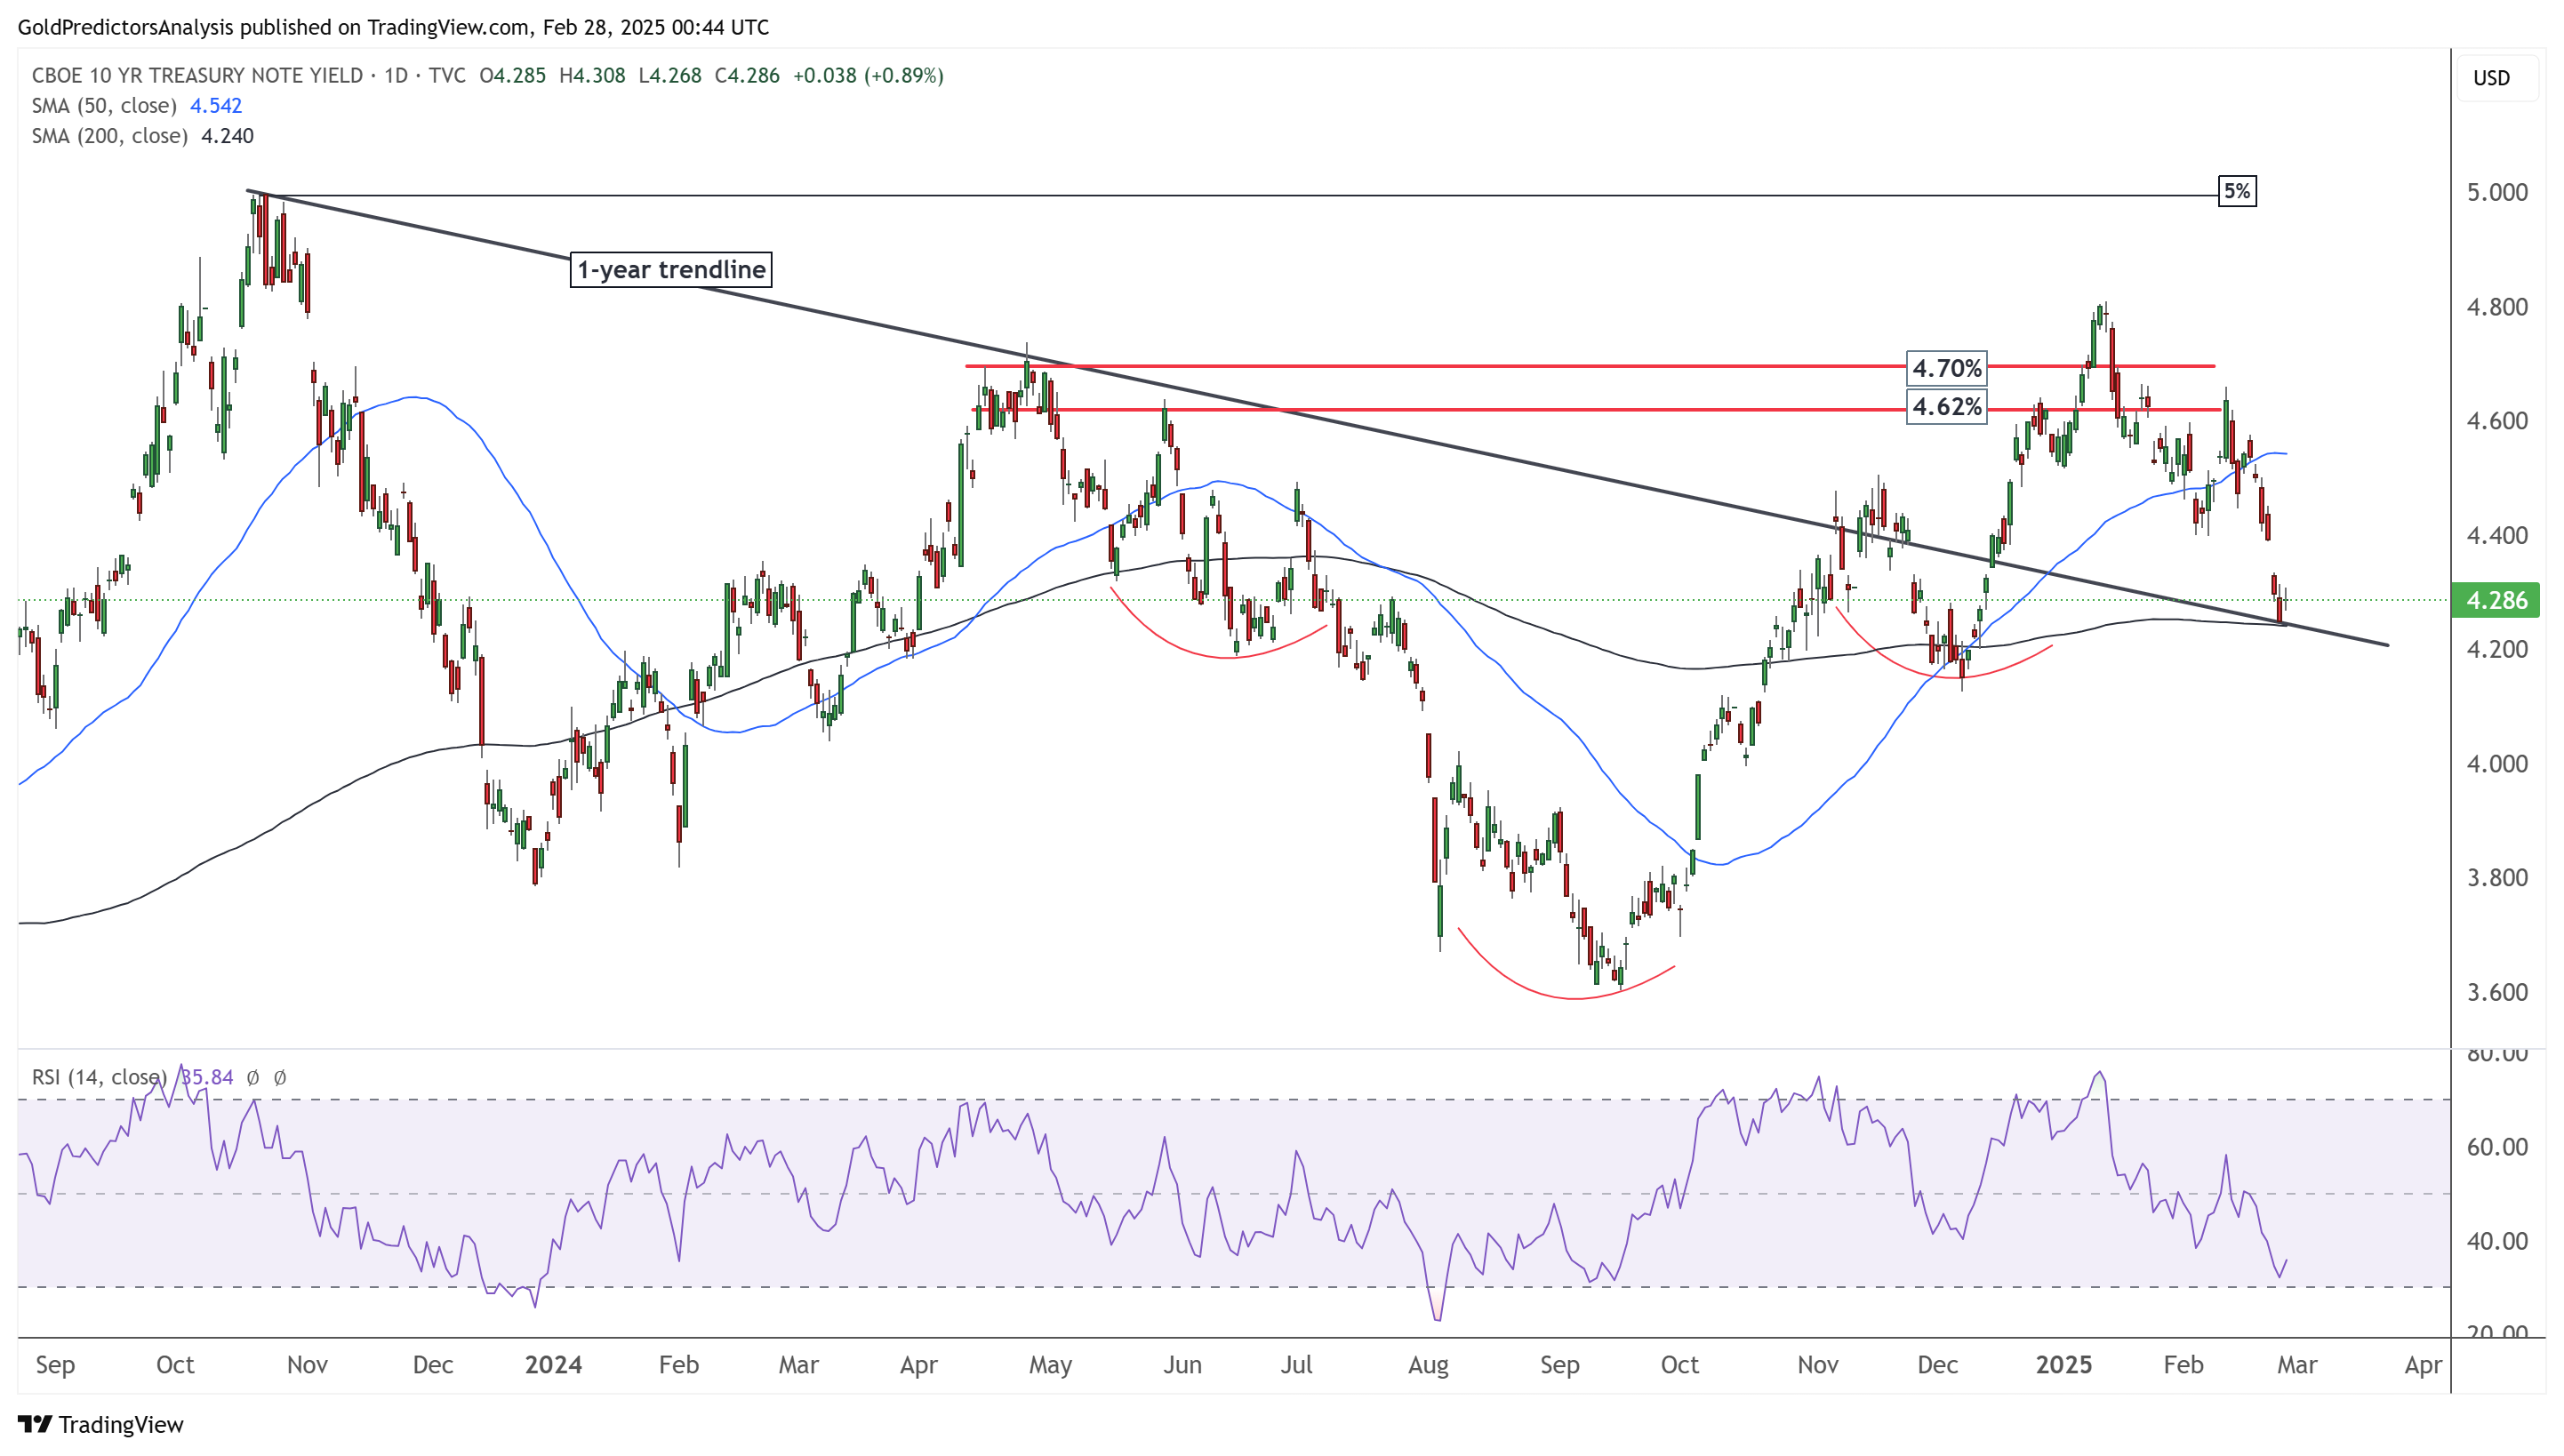
10-Year Treasury Note Yield Daily Chart – Support
The daily chart of US Treasury yields shows that the correction has reached the black trendline’s support, representing the one-year trend. This support level also intersects with the 200-day SMA, around 4.24%. US Treasury yields will likely stage a strong rebound from this level as the RSI, moving averages, and key support levels converge at 4.24%.
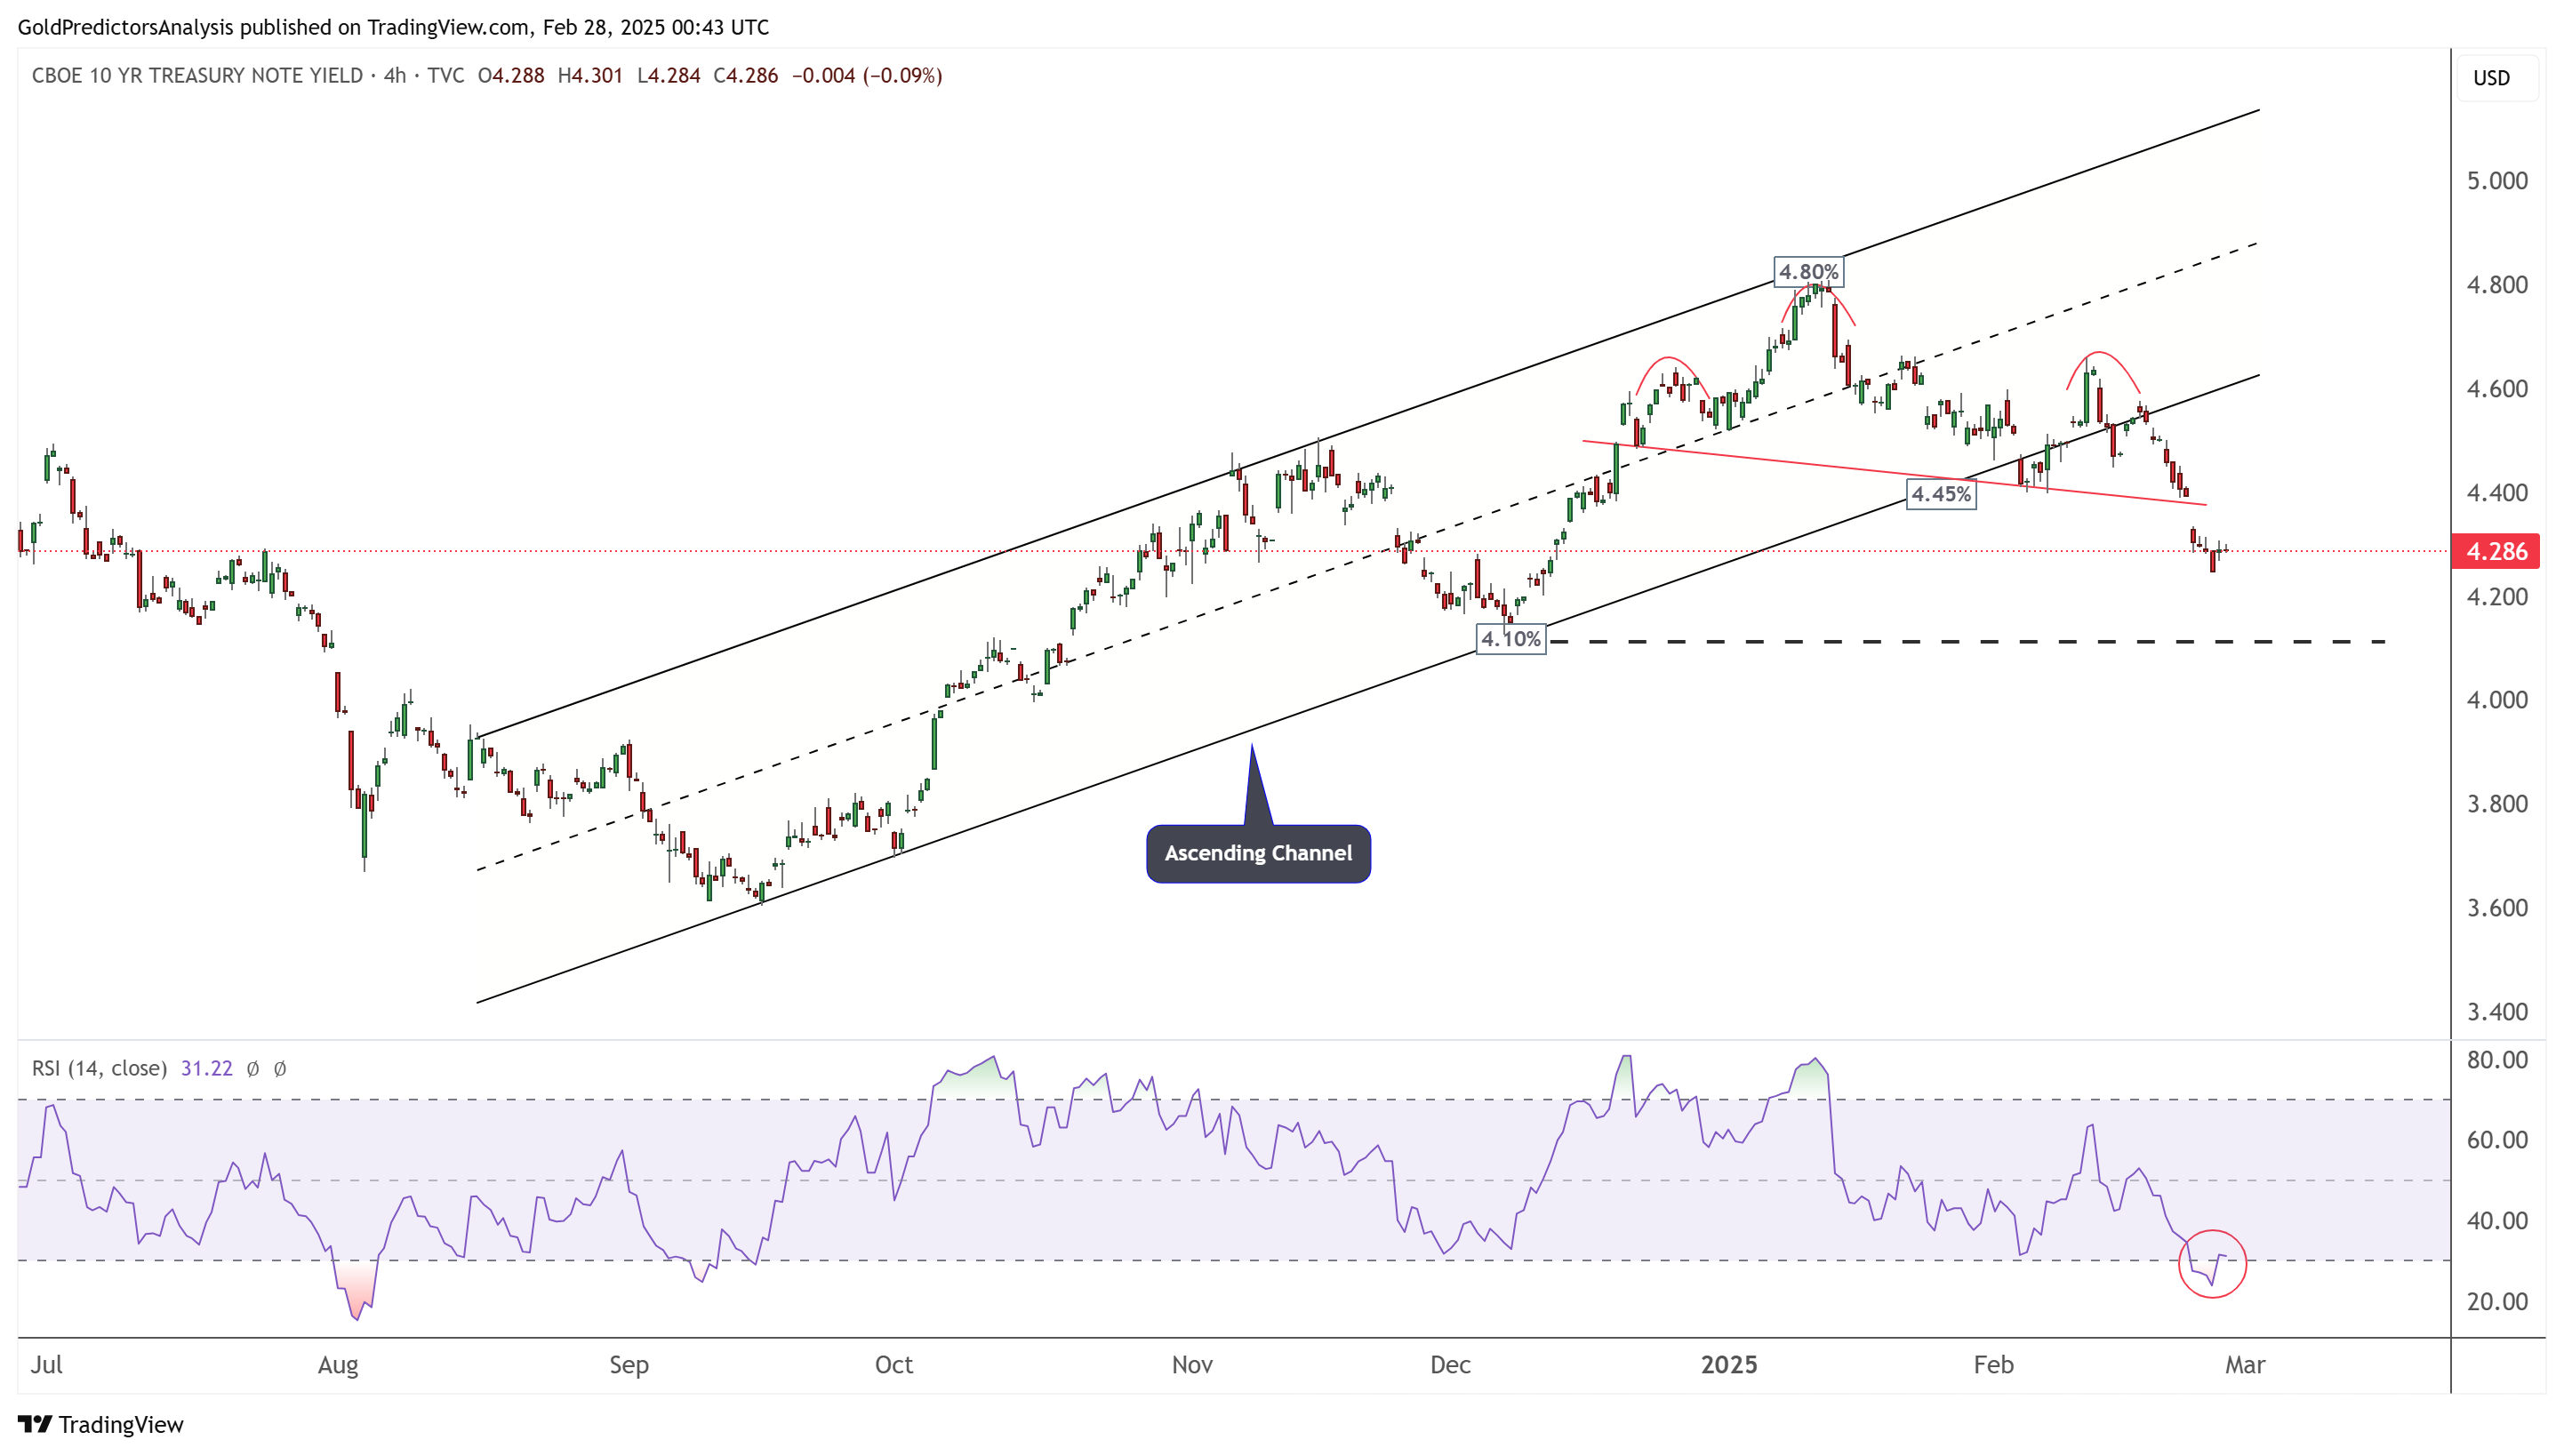
10-Year Treasury Note Yield 4-Hour Chart – Correction
The US Treasury yields break the ascending channel at 4.45% and corrected lower. The correction has reached the daily support at 4.24%, and a rebound is likely. A break below 4.24% will likely keep yields under bearish pressure toward 4.10%.
US Dollar (DXY) Technical Analysis
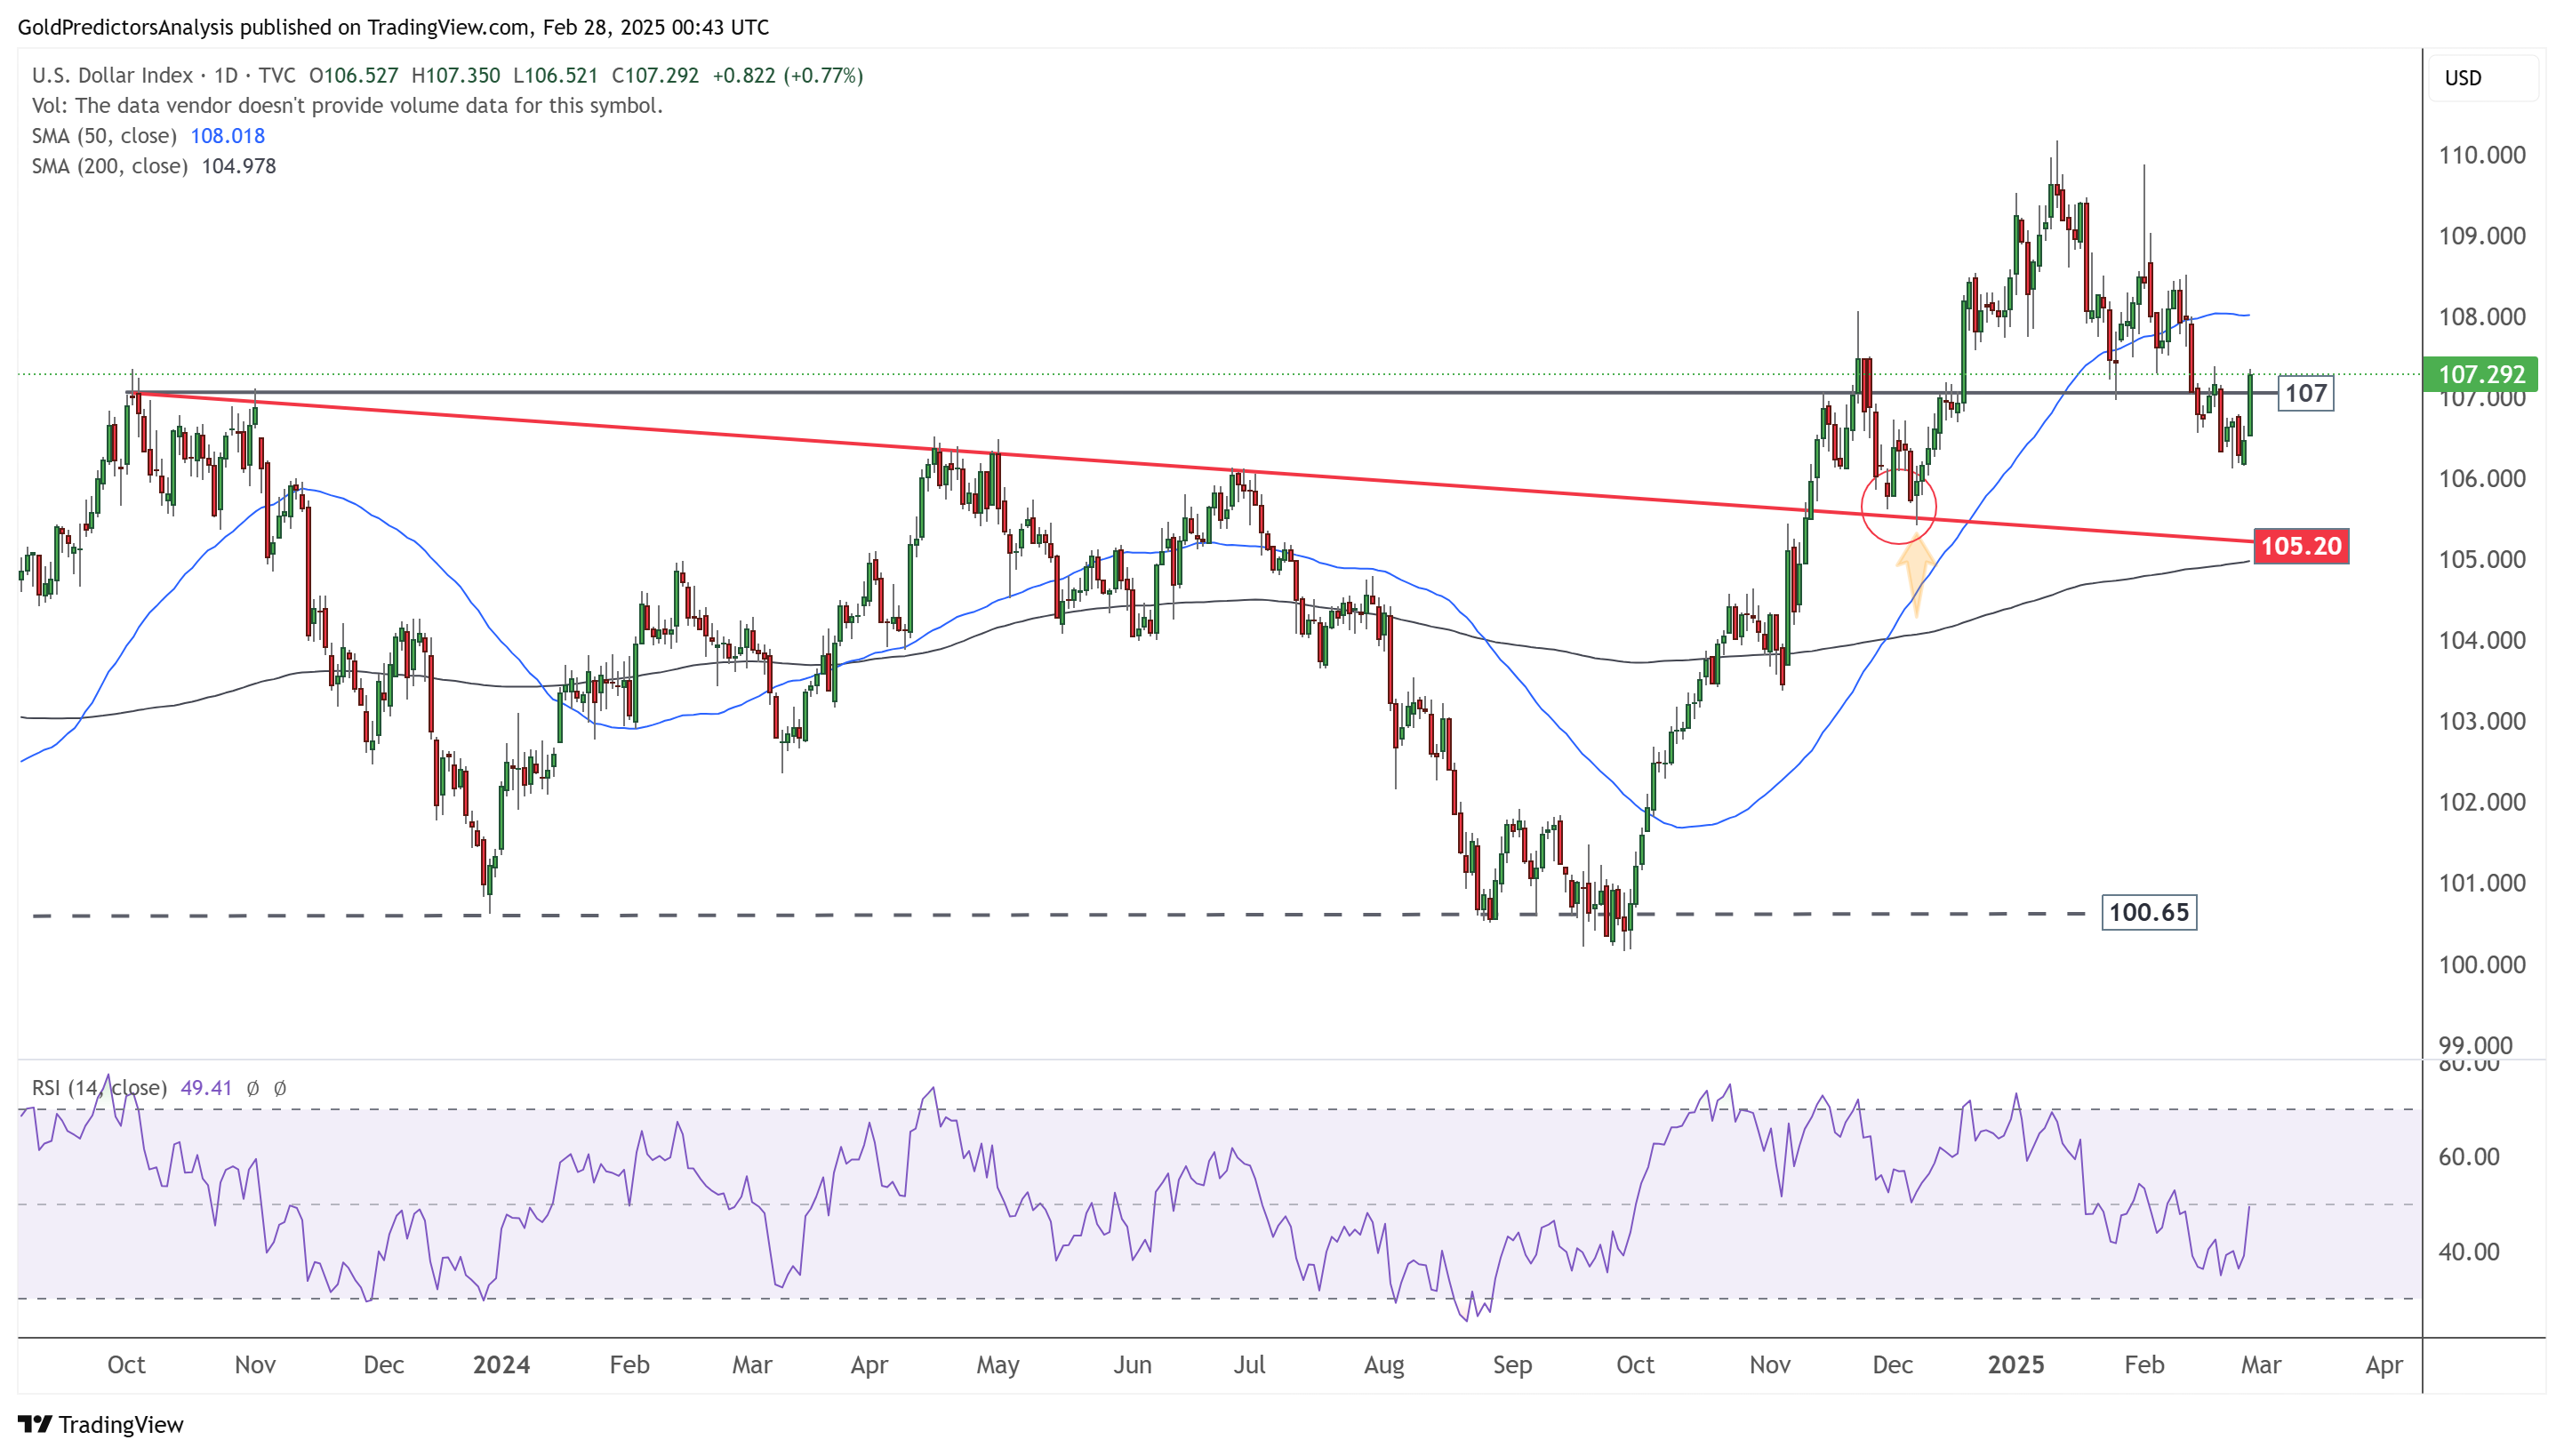
UD Dollar Daily – Price Rebound
The daily chart of the US Dollar Index shows that the index found support at 106.10 and rebounded higher. This rebound occurred as the index broke the falling wedge pattern on the 4-hour chart, which is strongly bullish in the short term. A daily close above 107 indicates further upside potential toward 108.
US Dollar 4-Hour Chart – Falling Wedge Breakout
The 4-hour chart of the US Dollar Index shows that the falling wedge pattern has broken, initiating a strong upward move. As the index has closed above 107, it will likely continue trading higher. The RSI rebounds from the bottom level, indicating a potential trend shift.
About the Author
Bob MasonChief Crypto Boss
TEST 30 He has written extensively for a broader audience and his current focus is on developments relating to the financial markets including, but not limited to currencies, commodities, alternative asset classes, and global equities.
Latest news and analysis


Advertisement