
Advertisement
Advertisement
Gold (XAUUSD) Price Consolidates Below $3,345 as US Budget and PMI Data Support US Dollar
By:
Key Points:
- Gold (XAU) consolidates after hitting strong resistance at $3,345.
- US Treasury yields (TNX) hit the key level of 4.60% and await the next direction.
- US Dollar Index (DXY) continues lower after touching the 50-day SMA.

Gold (XAUUSD) prices dropped on Thursday, retreating from a two-week high of $3,345. This drop followed the US House approval of Trump’s debt-heavy budget, which raised concerns over fiscal discipline. The budget is expected to add $4 trillion to the debt ceiling, increasing long-term financial risks but temporarily boosting market confidence. However, the passage of this budget also strengthened the US Dollar, which pressured gold by reducing its appeal as a safe haven.
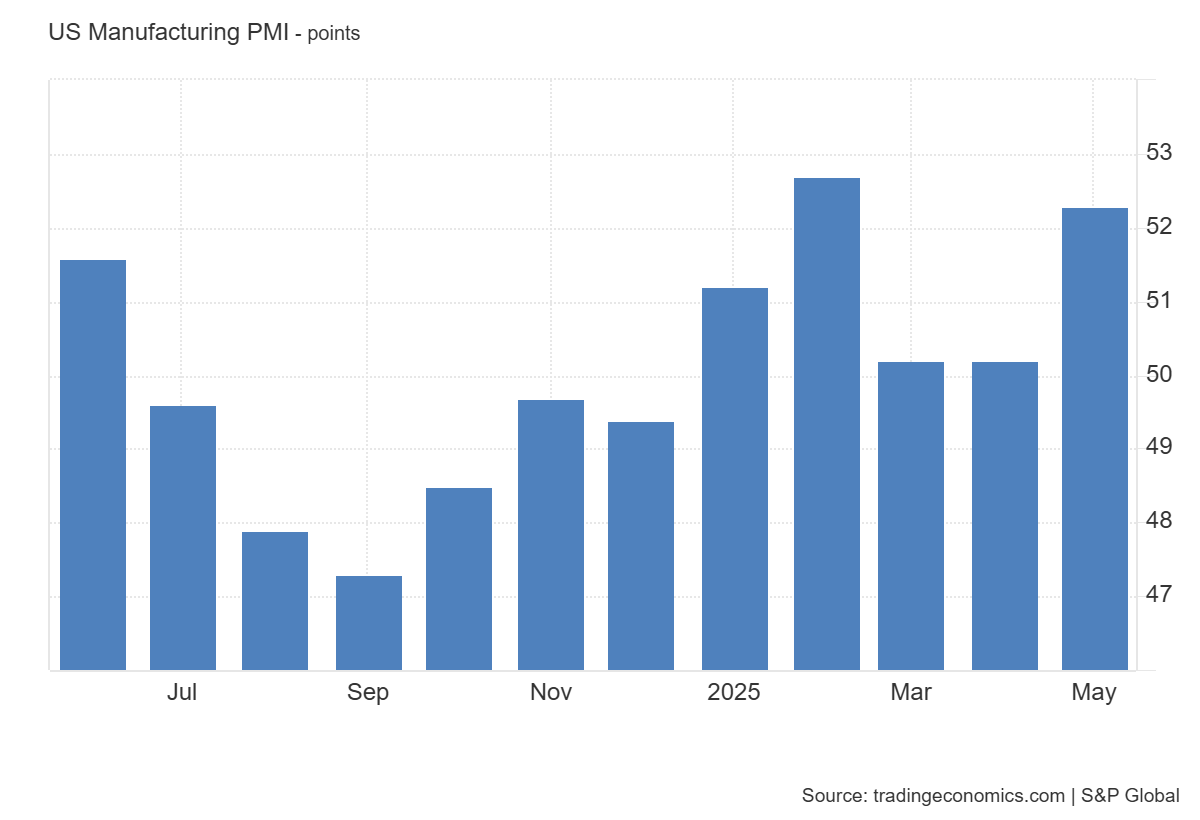
The stronger-than-expected S&P Global PMIs further weighed on gold. The Manufacturing PMI increased from 50.2 to 52.3, as shown in the chart below. Moreover, the Services PMI also increased from 50.8 to 52.3, exceeding expectations. These figures signaled economic resilience, reducing immediate recession fears and diminishing demand for gold.
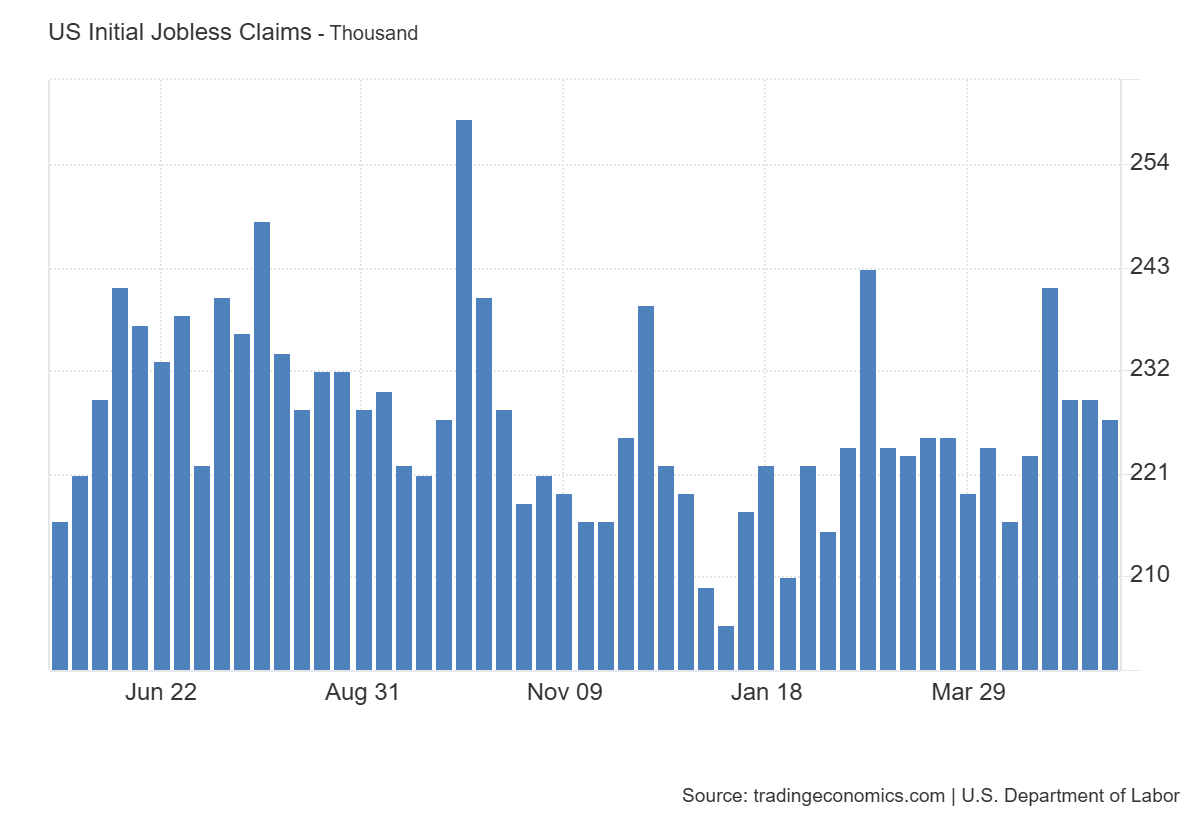
Meanwhile, US Initial Jobless Claims fell to 227K, lower than the previous 229K and below expectations of 230K, reinforcing the positive economic outlook.
Despite short-term weakness, gold’s longer-term bullish outlook remains intact due to geopolitical tensions. The tensions between Israel and Iran indicate intense geopolitical uncertainty. These rising risks support safe-haven demand for gold in the medium term.
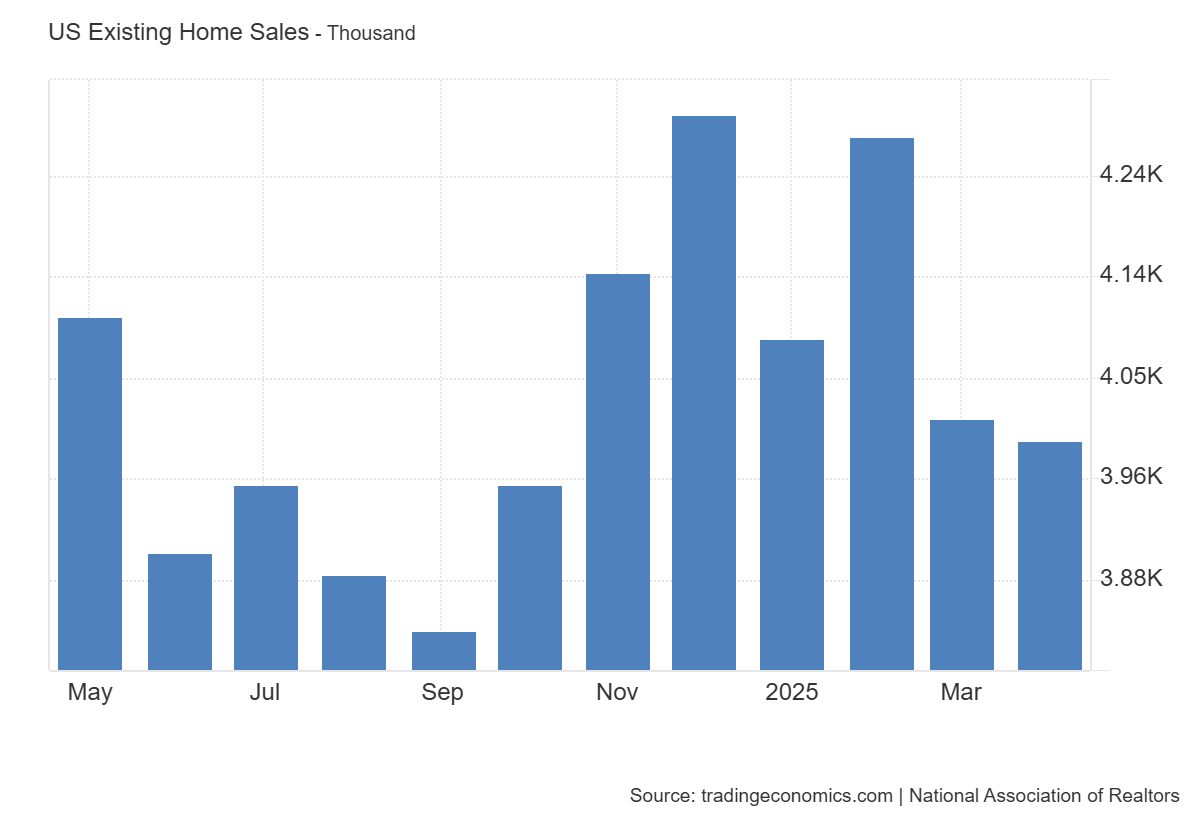
On the other hand, existing home sales declined to a seasonally adjusted rate of 4 million in April 2024, as shown in the chart below. High mortgage rates restrained this decline. Despite these economic data, the gold market continues to consolidate below the resistance at $3,345.
Gold (XAUUSD) Technical Analysis
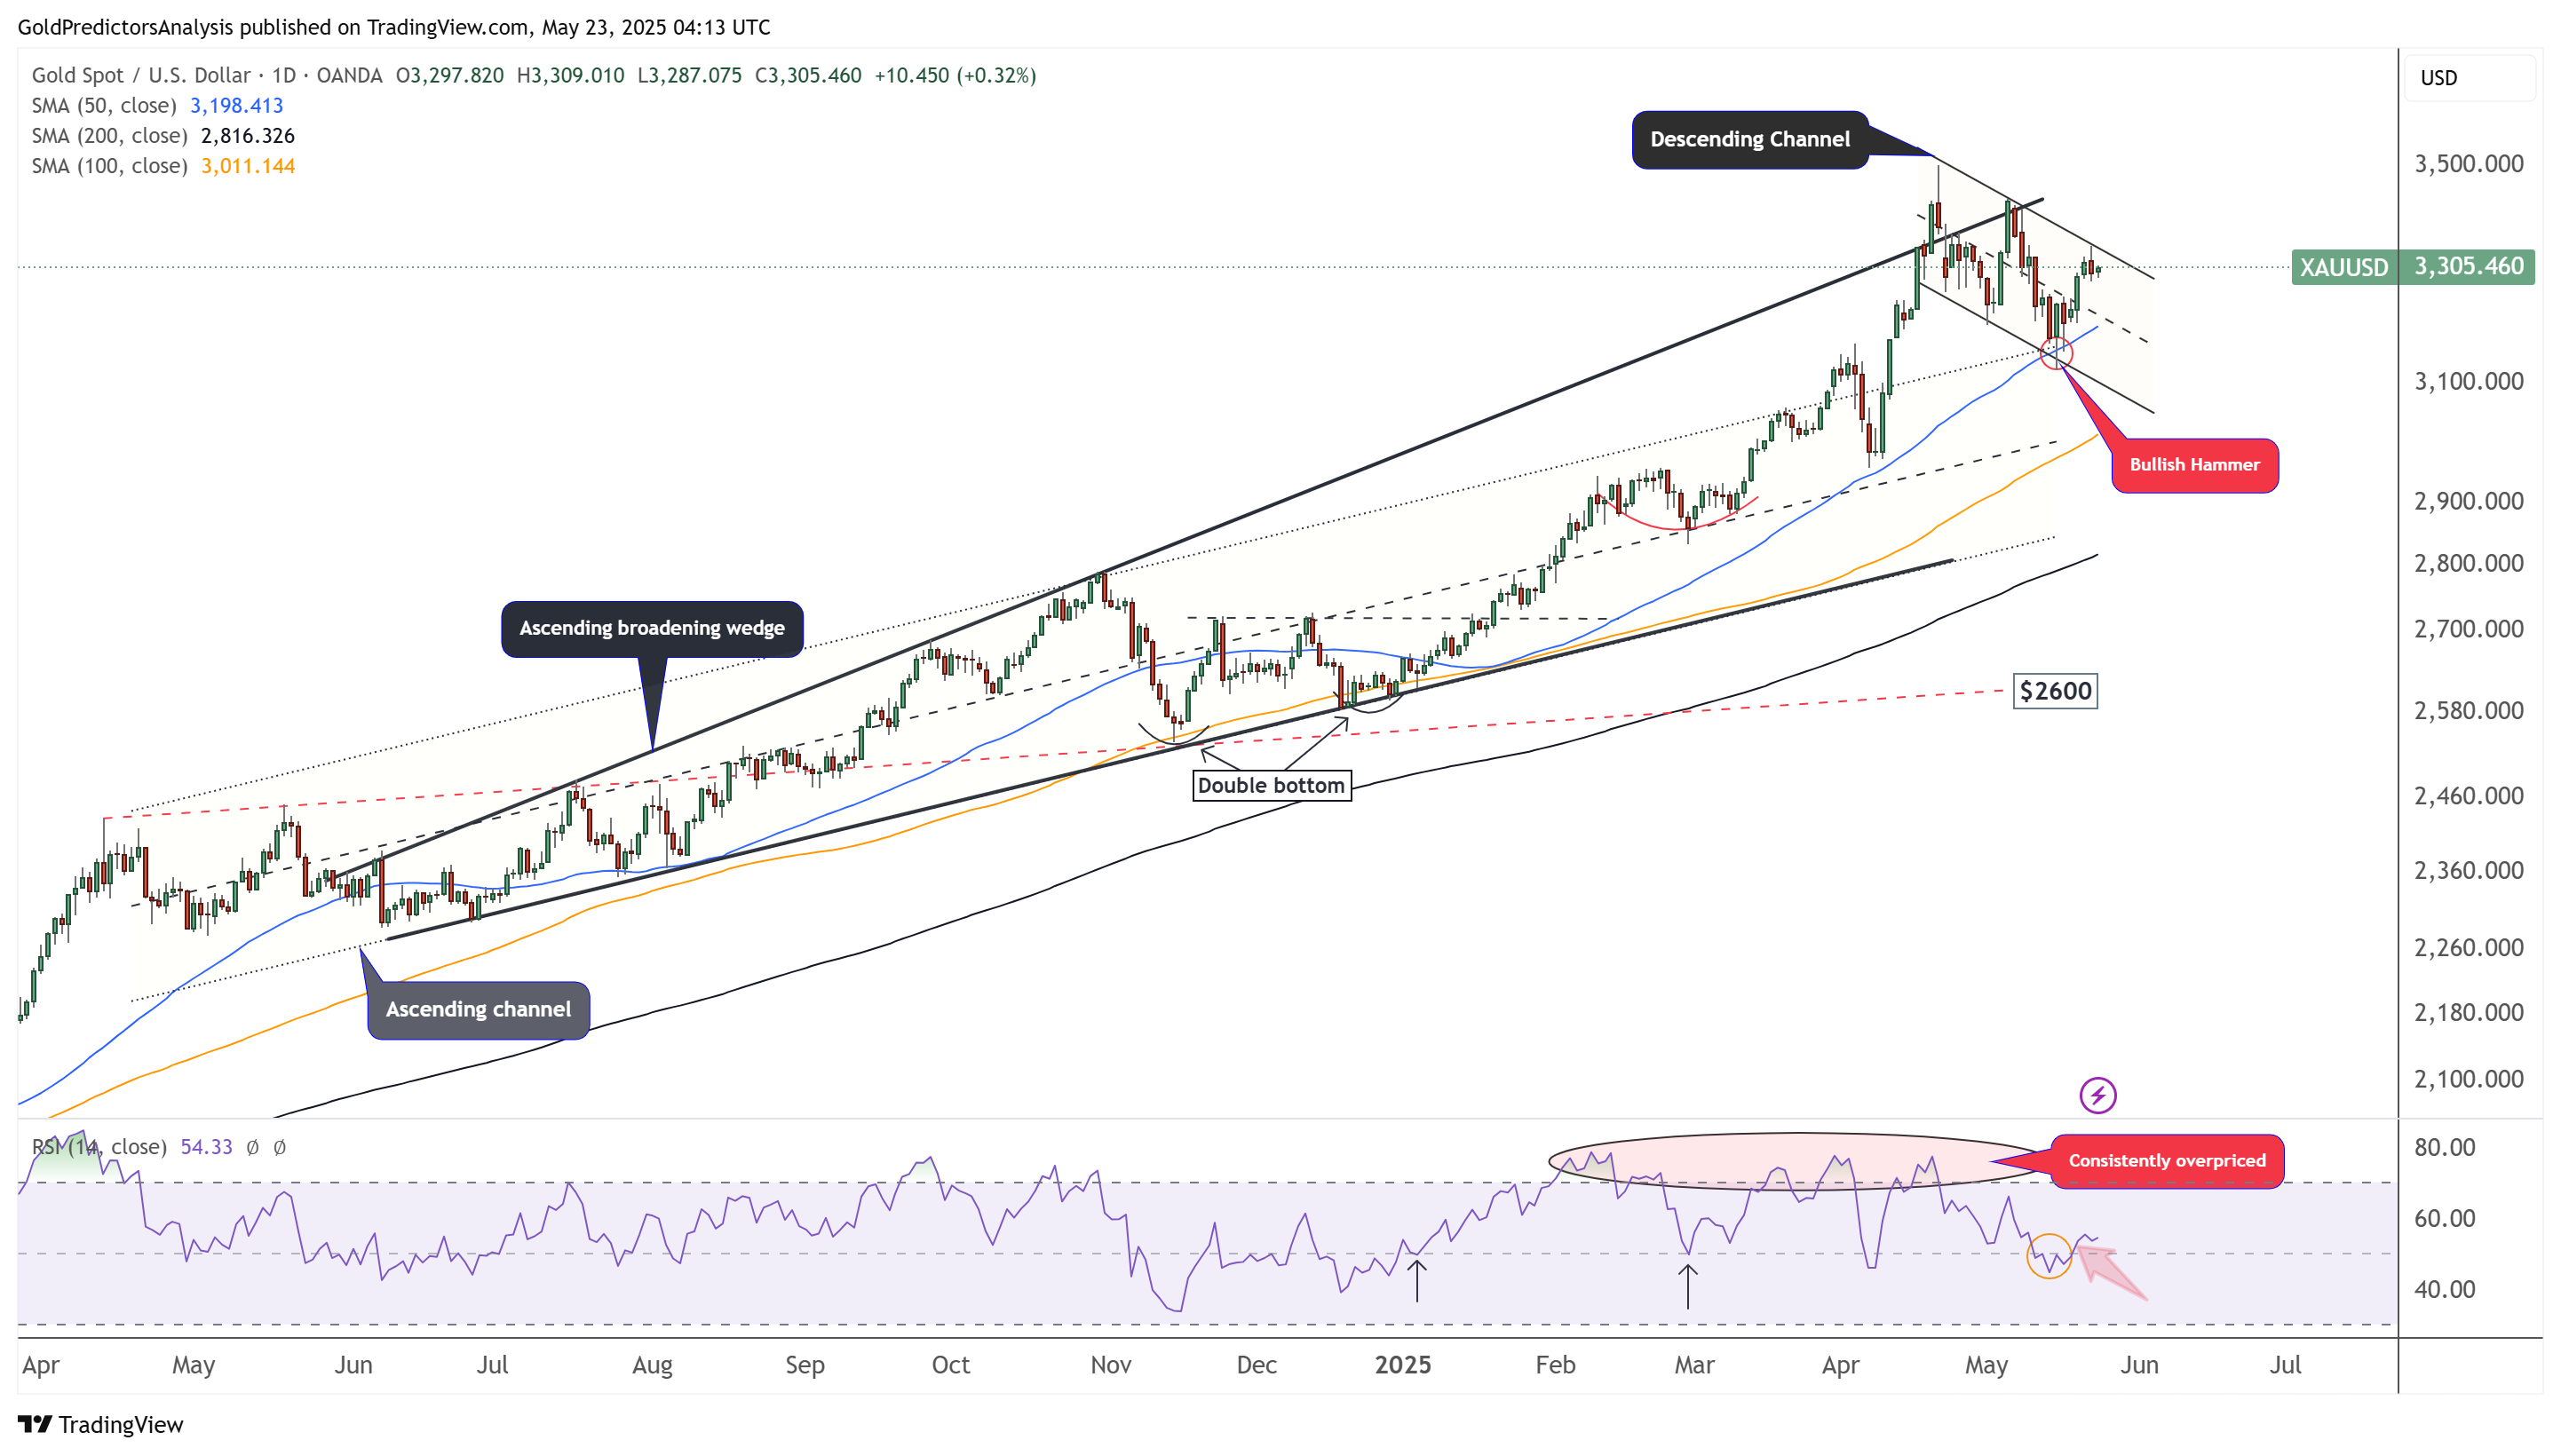
Gold Daily Chart – Descending Channel
The daily chart for gold shows that the price is trading within a descending channel. After rebounding from the 50-day SMA, the price has reached the resistance of the channel.
A break above $3,350 will indicate further upside toward the $3,400 and $3,500 levels. Moreover, the RSI is rebounding from the mid-level, which indicates positive momentum.
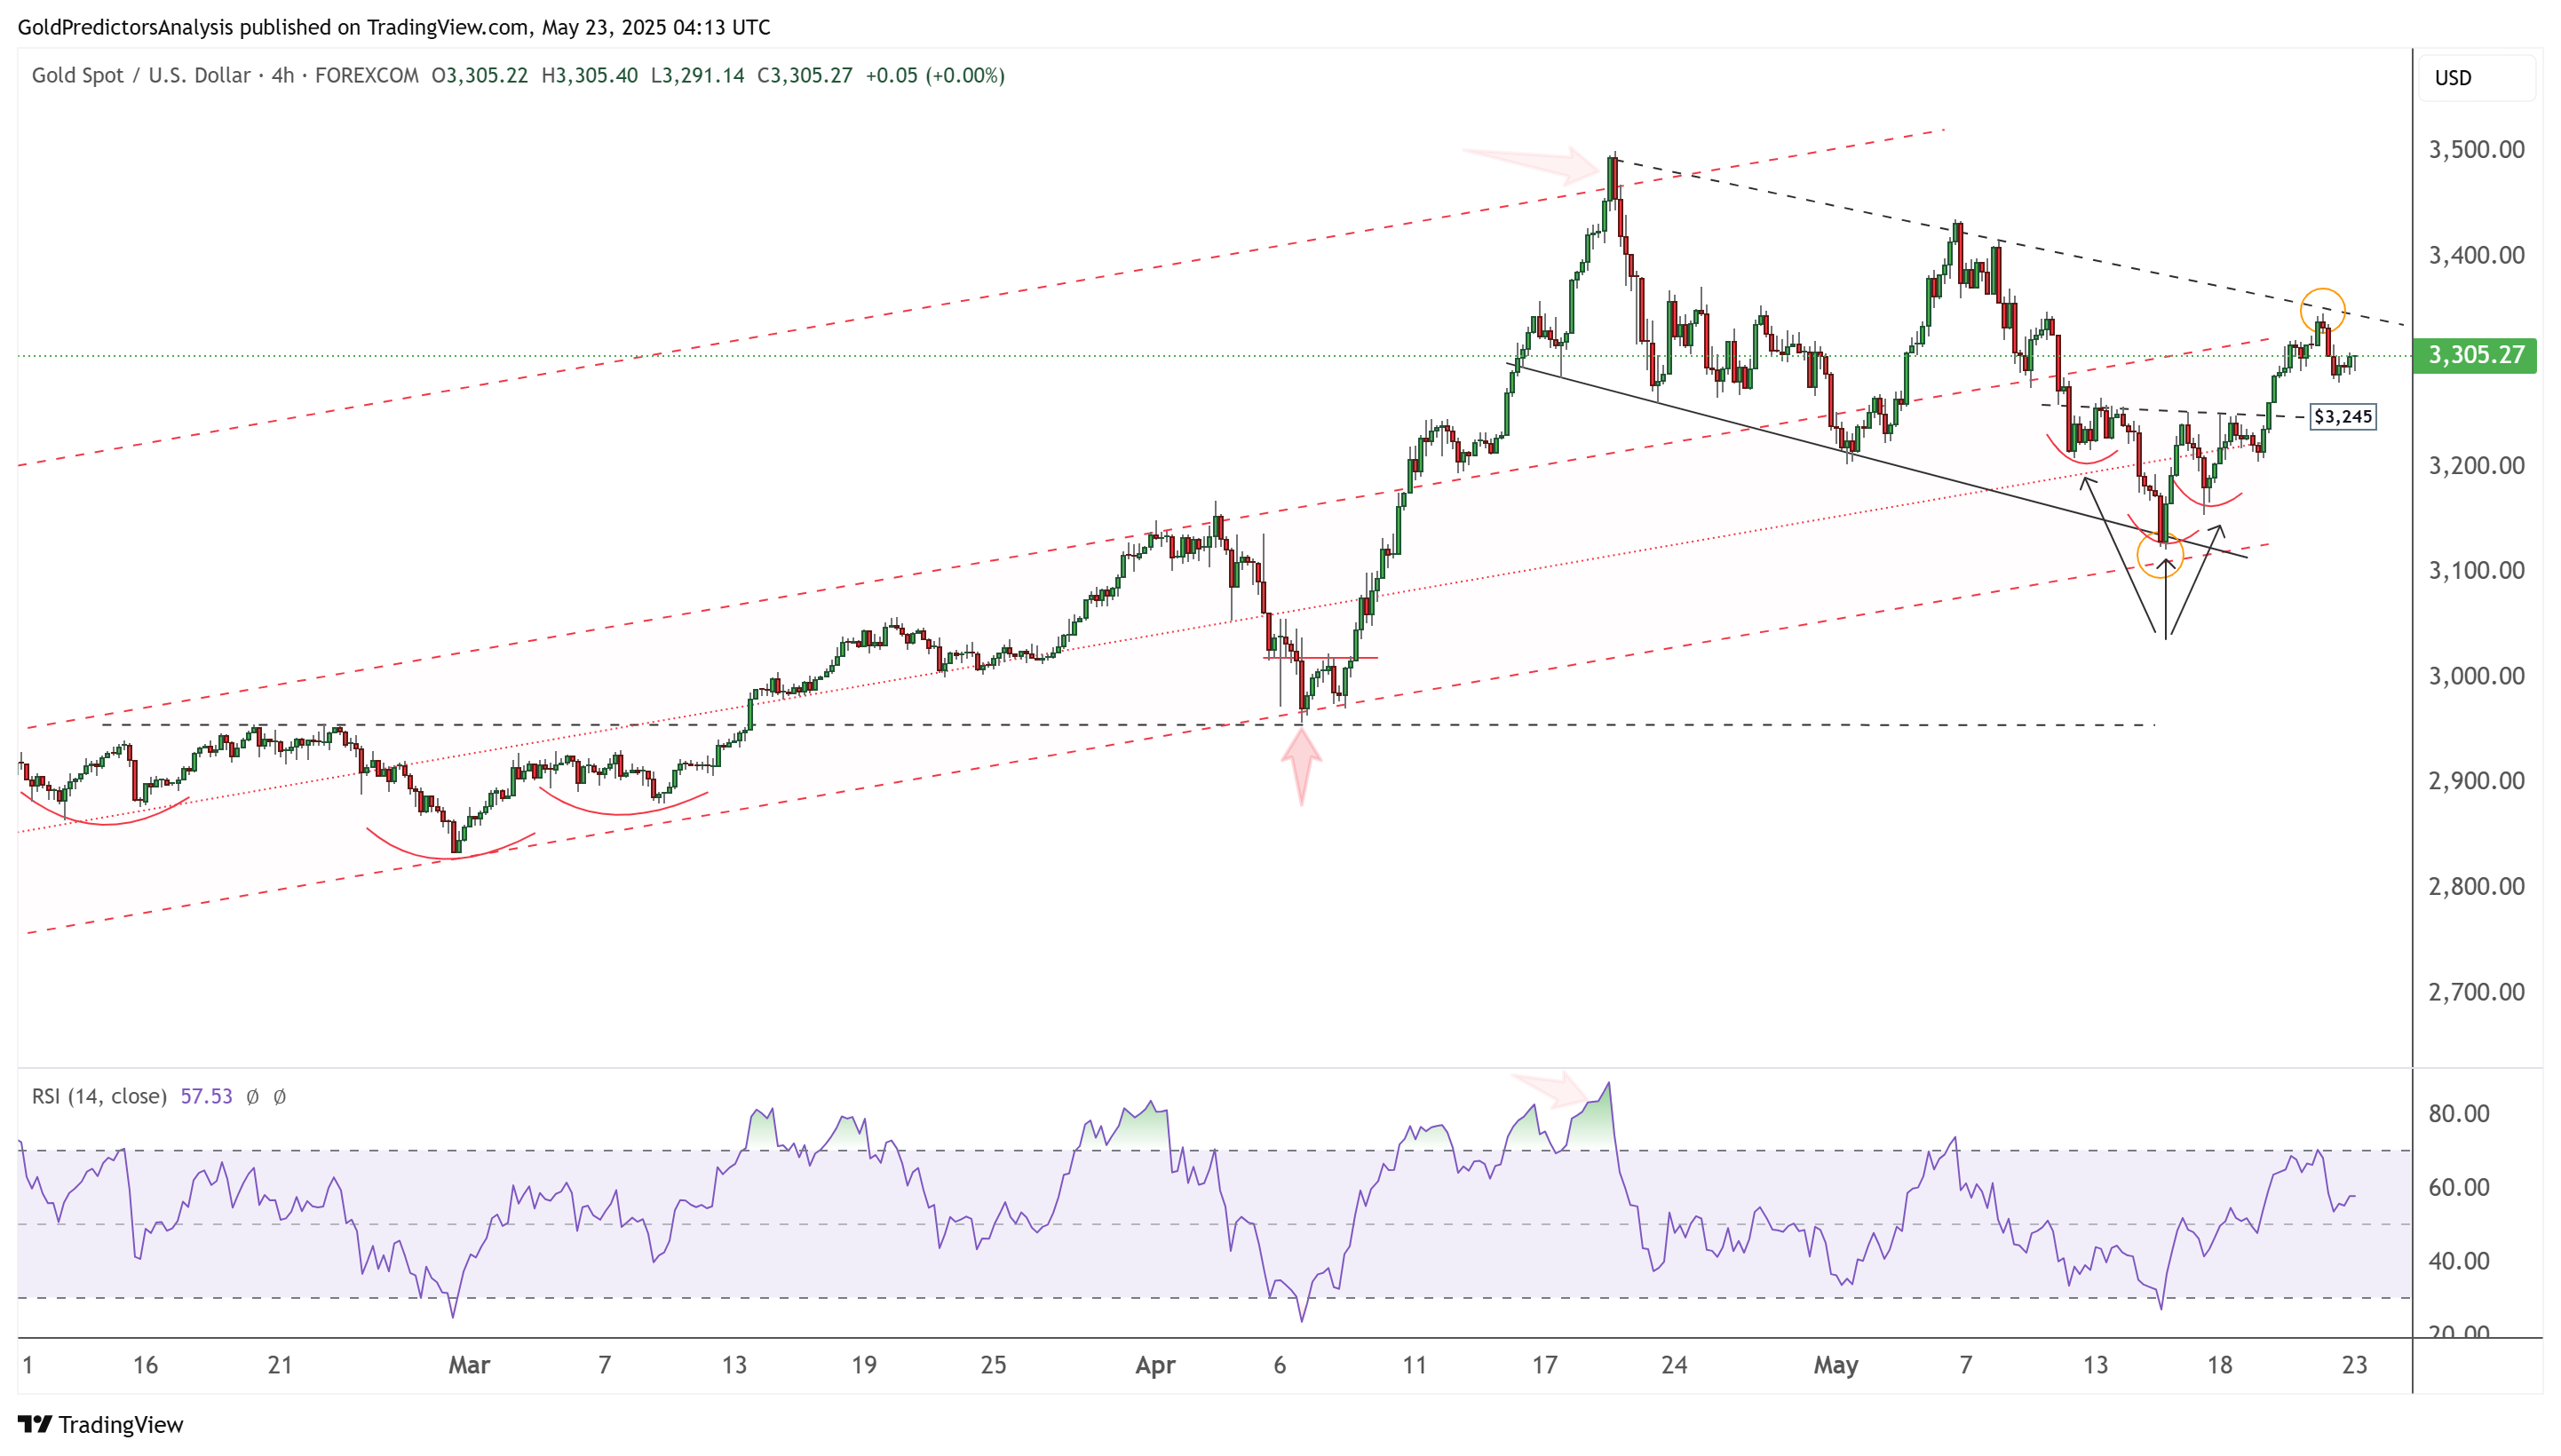
Gold 4-Hour Chart – Descending Channel
The 4-hour chart for gold shows that the price is trading within a descending channel and is testing the resistance area marked by the yellow circle. The rebound from the channel support was strongly bullish, confirmed by the formation of an inverted head and shoulders pattern. A break above the black dotted trendline will signal a strong move to the upside.
Treasury Yields (TNX) Technical Analysis
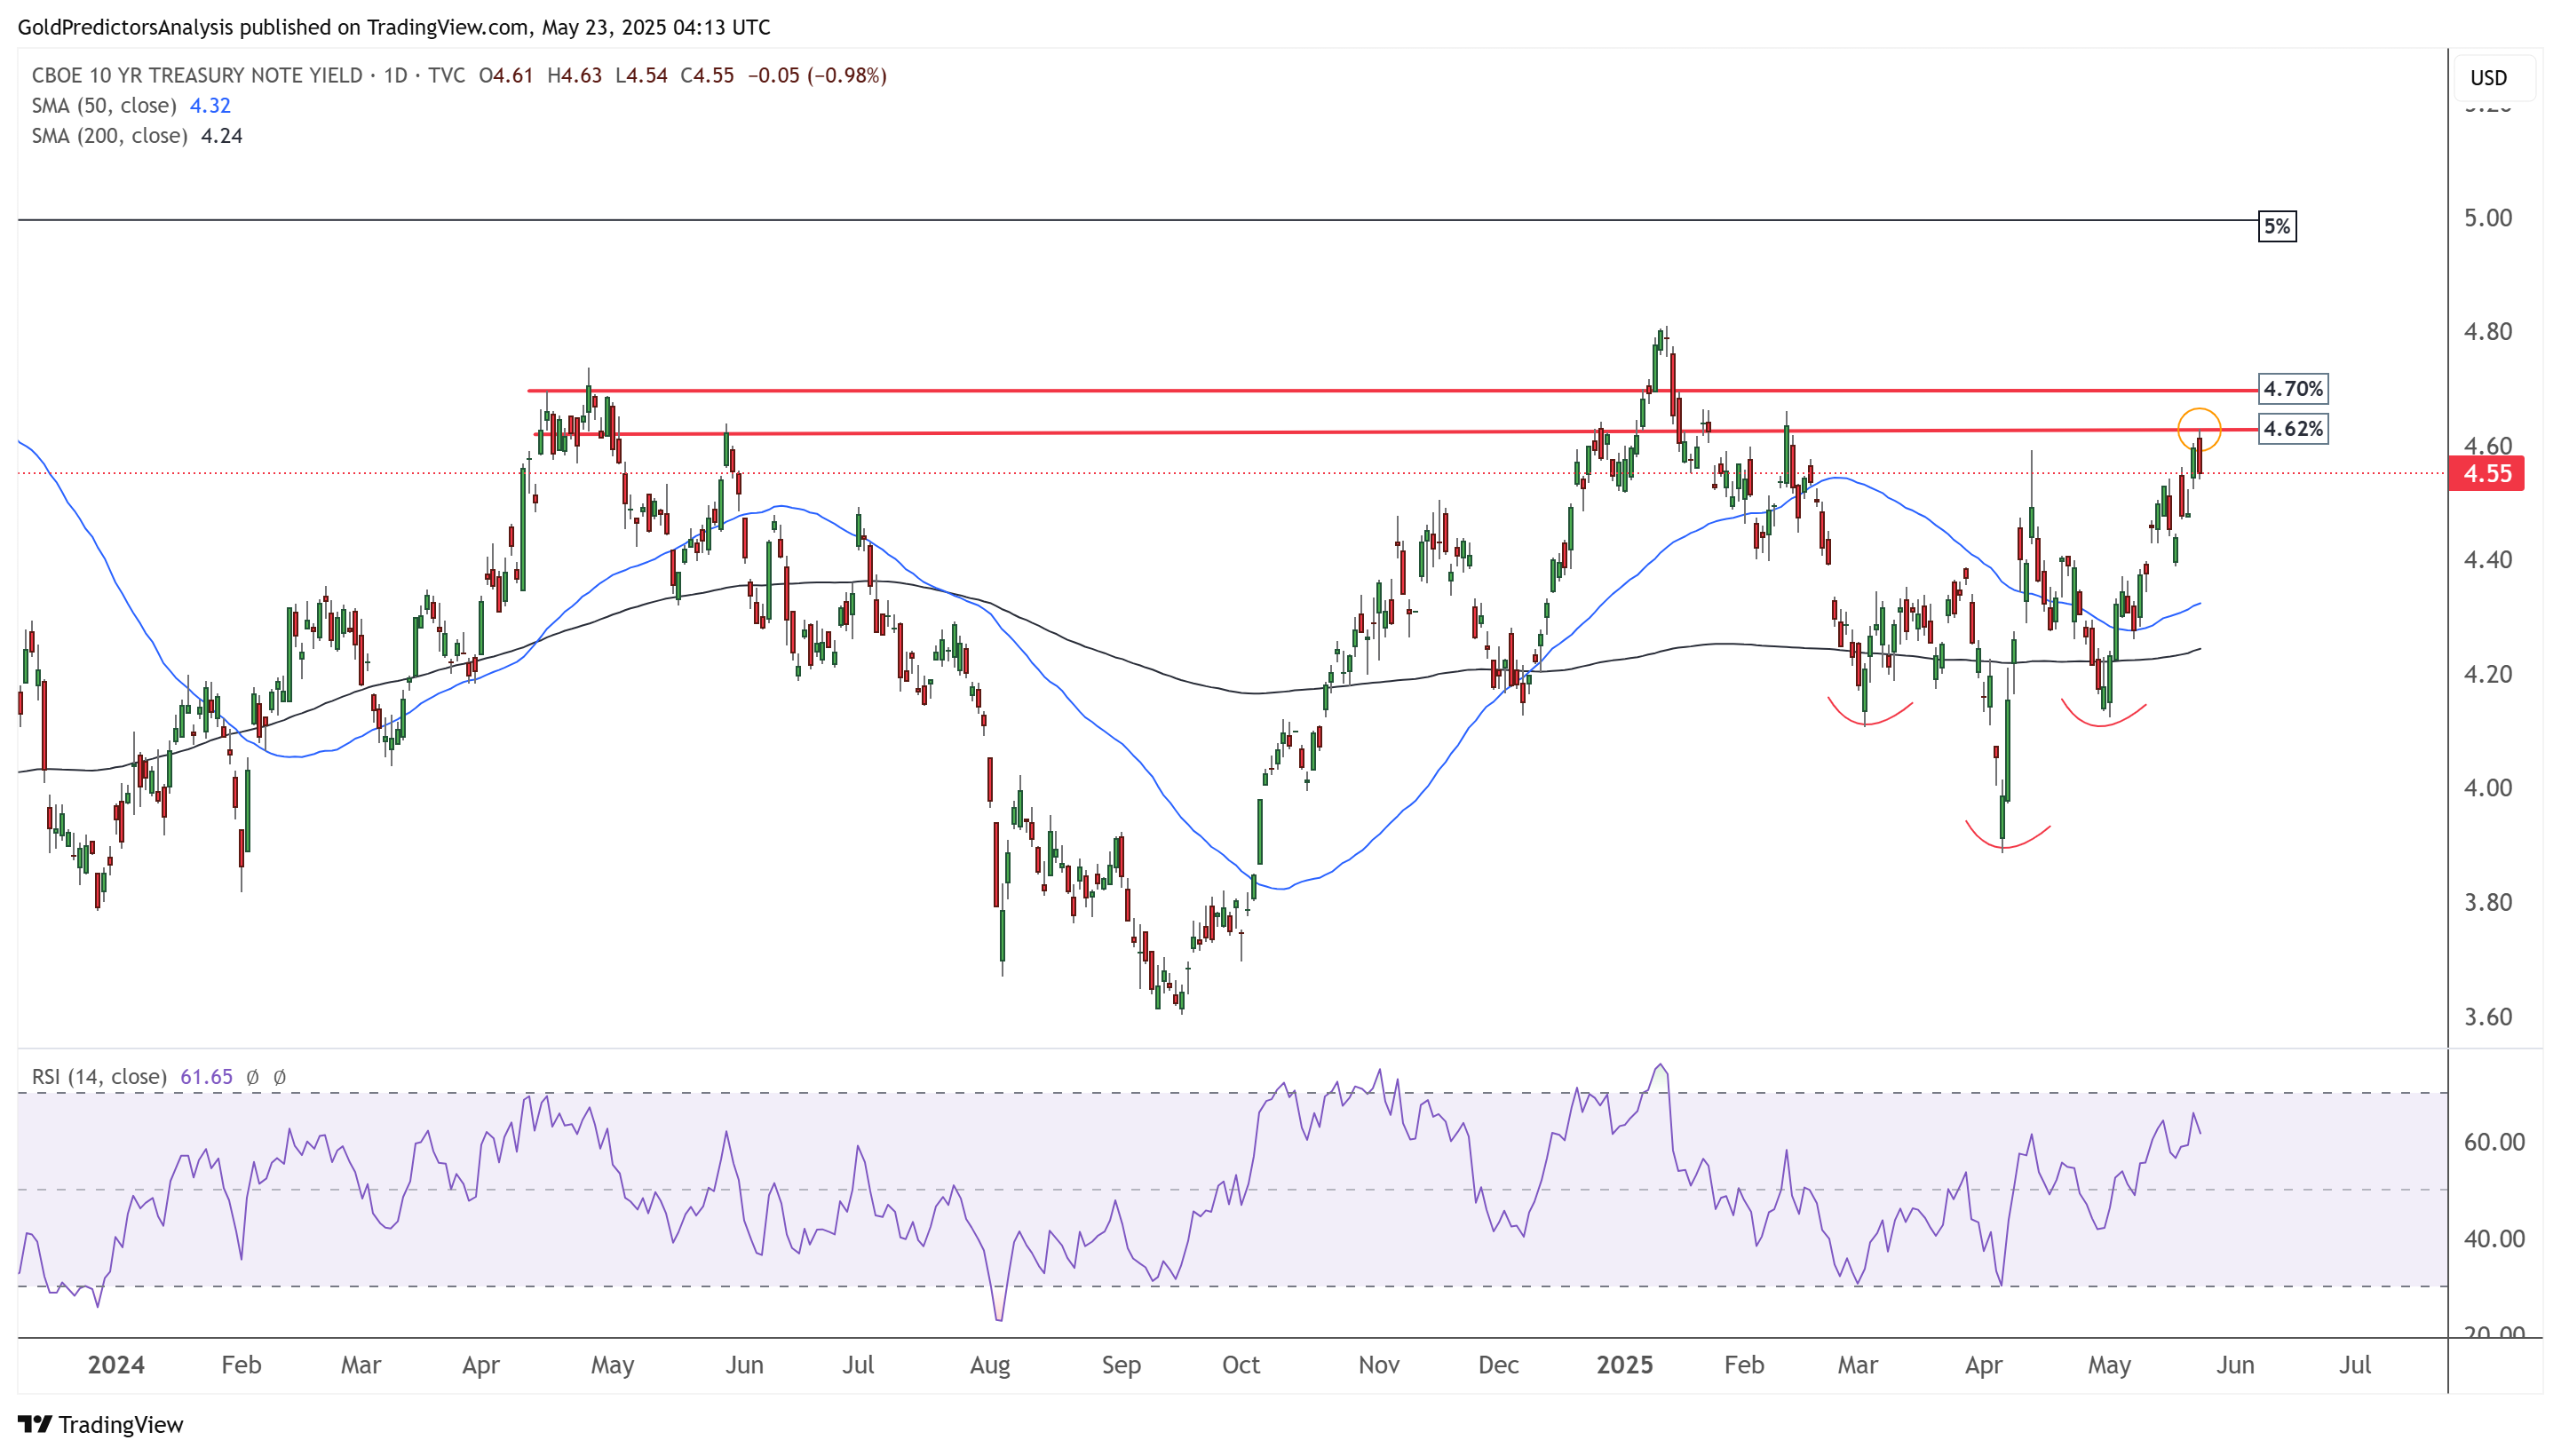
10-Year Treasury Note Yield Daily Chart – Key Level of 4.62%
The daily chart for US Treasury note yields shows that the yield has reached the resistance at 4.62%. The rebound from the 4.0% level was bullish, confirmed by an inverted head and shoulders pattern. Moreover, the yield remains above the 50-day and 200-day SMAs, indicating positive momentum. A break above 4.7% will suggest further upside toward the 5.0% level.
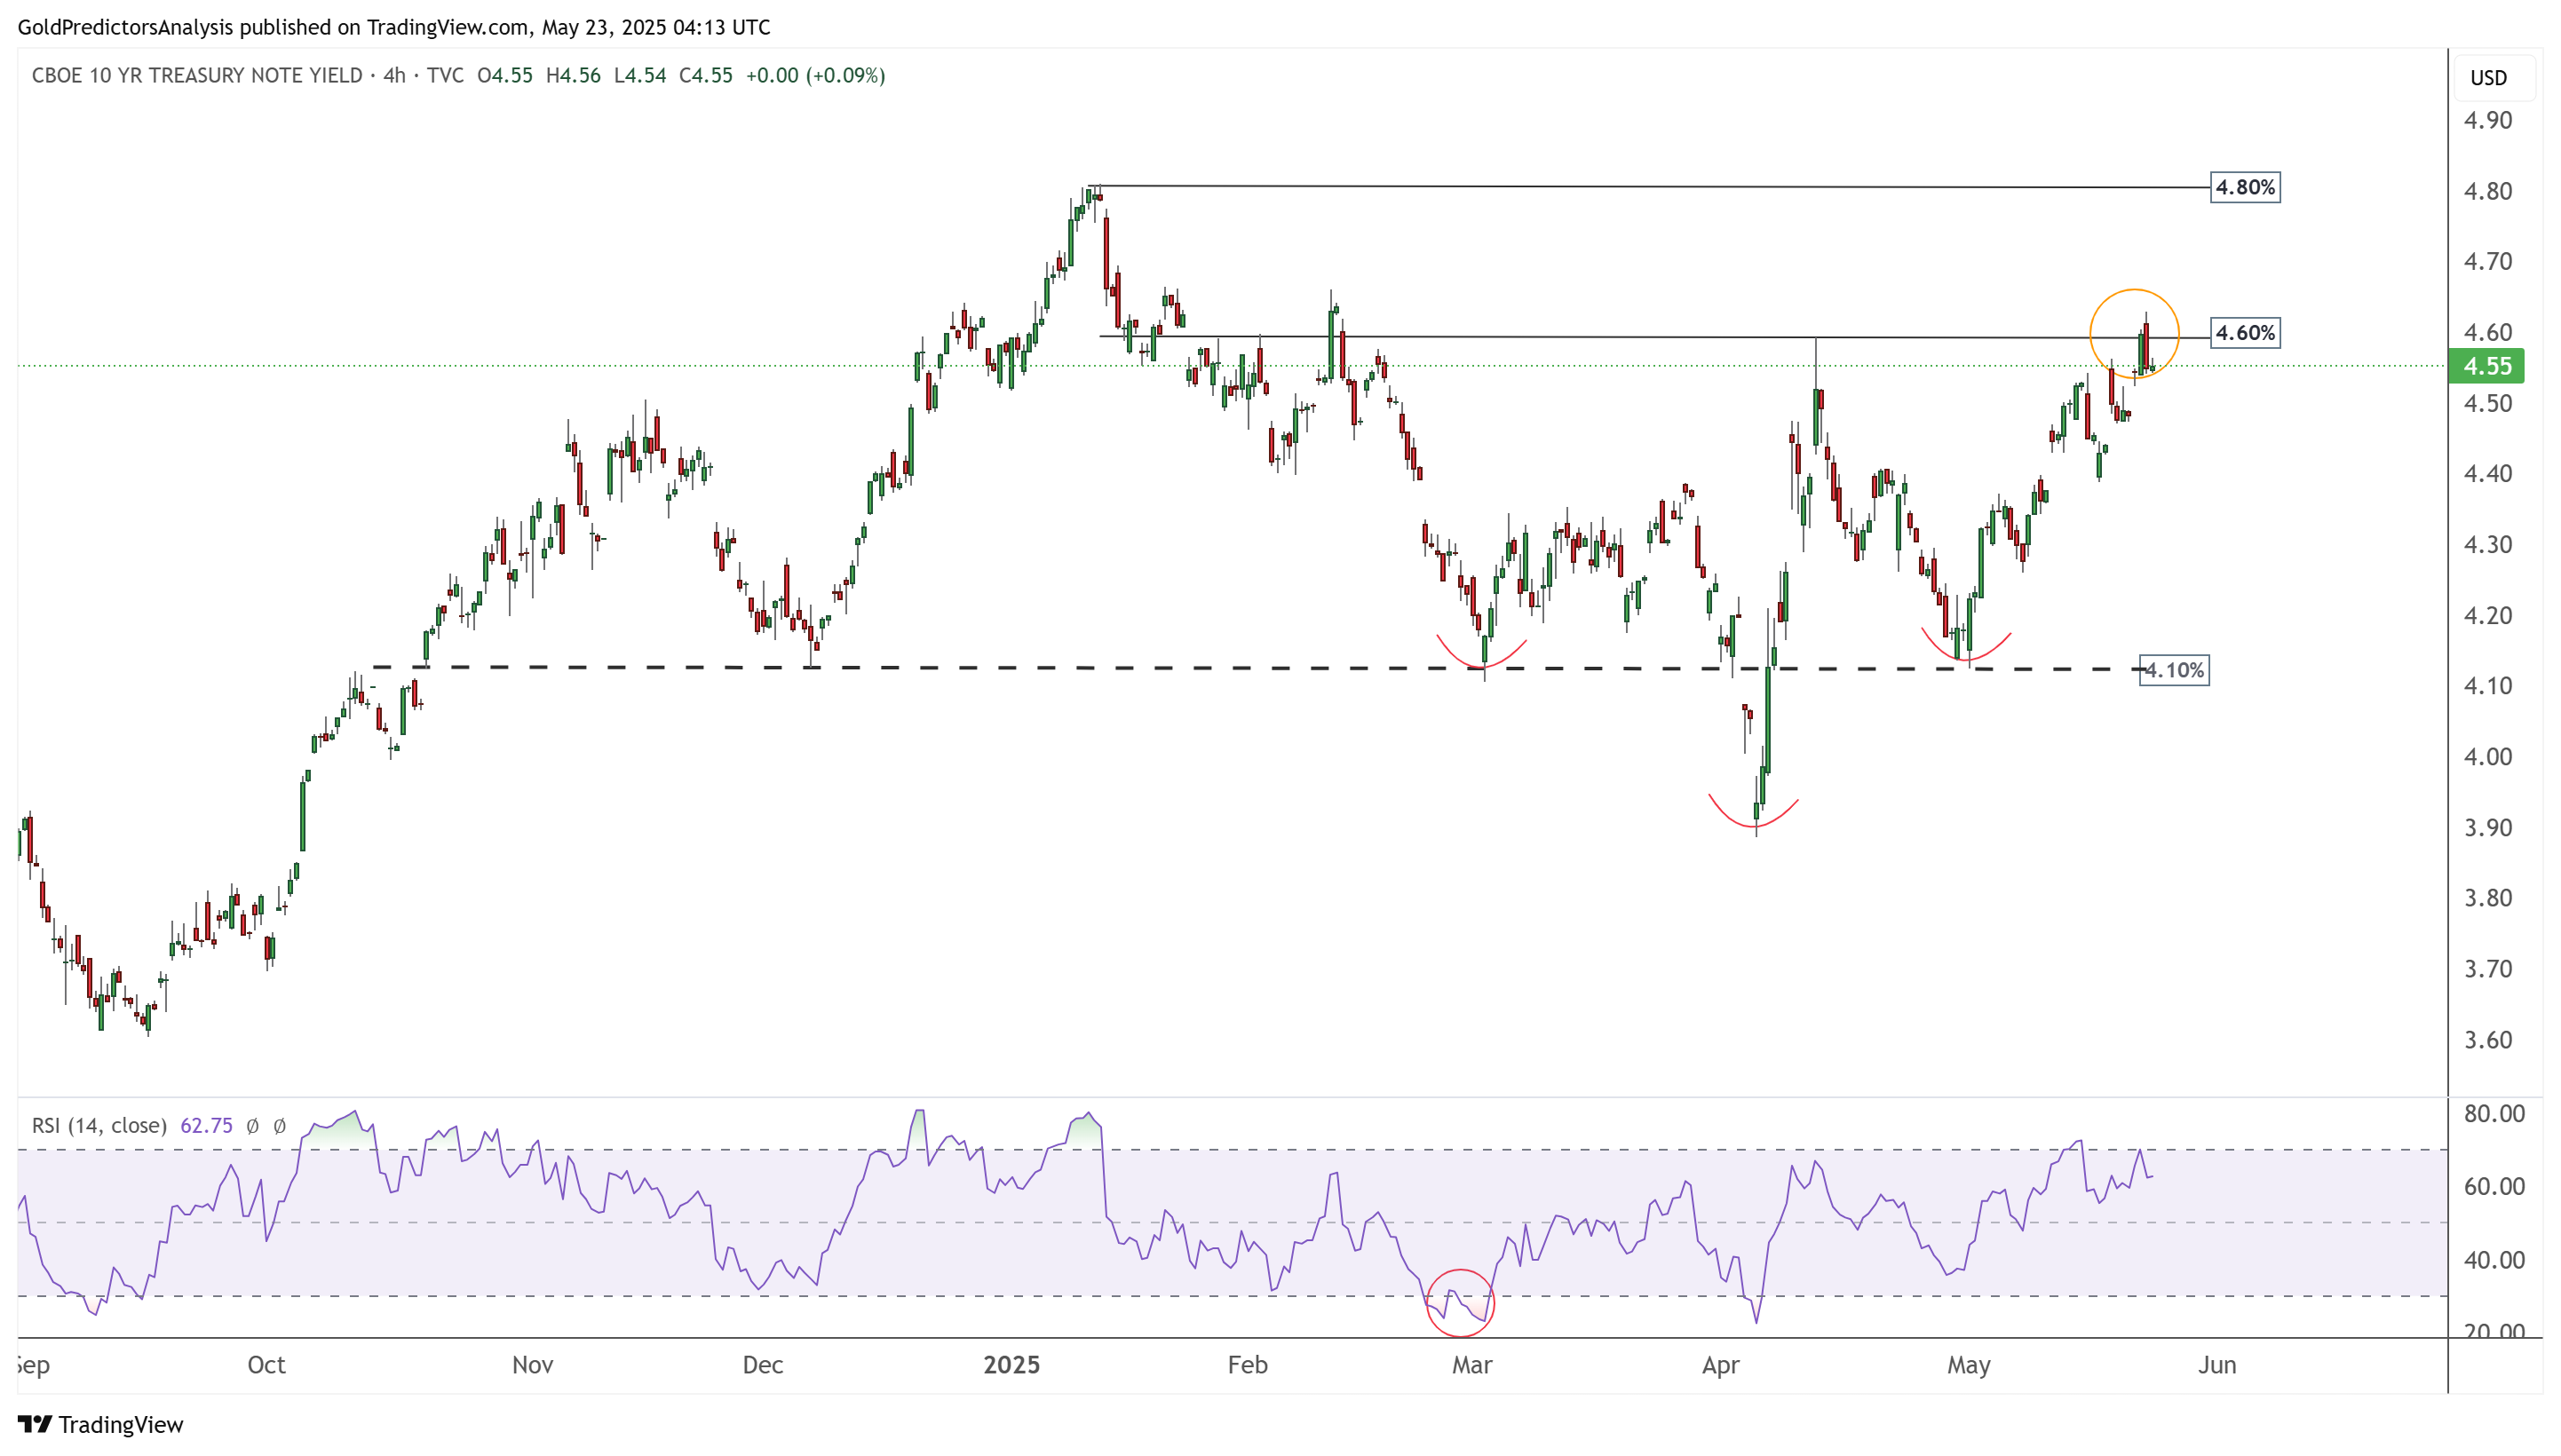
10-Year Treasury Note Yield 4-Hour Chart – Positive Development
The 4-hour chart for US Treasury note yields also shows strong bullish momentum. The price pattern indicates a firm consolidation between 4.0% and 5.0%. The yield has reached 4.60% and is currently consolidating at this level. A break above this level will suggest a move toward 4.80%.
US Dollar (DXY) Technical Analysis
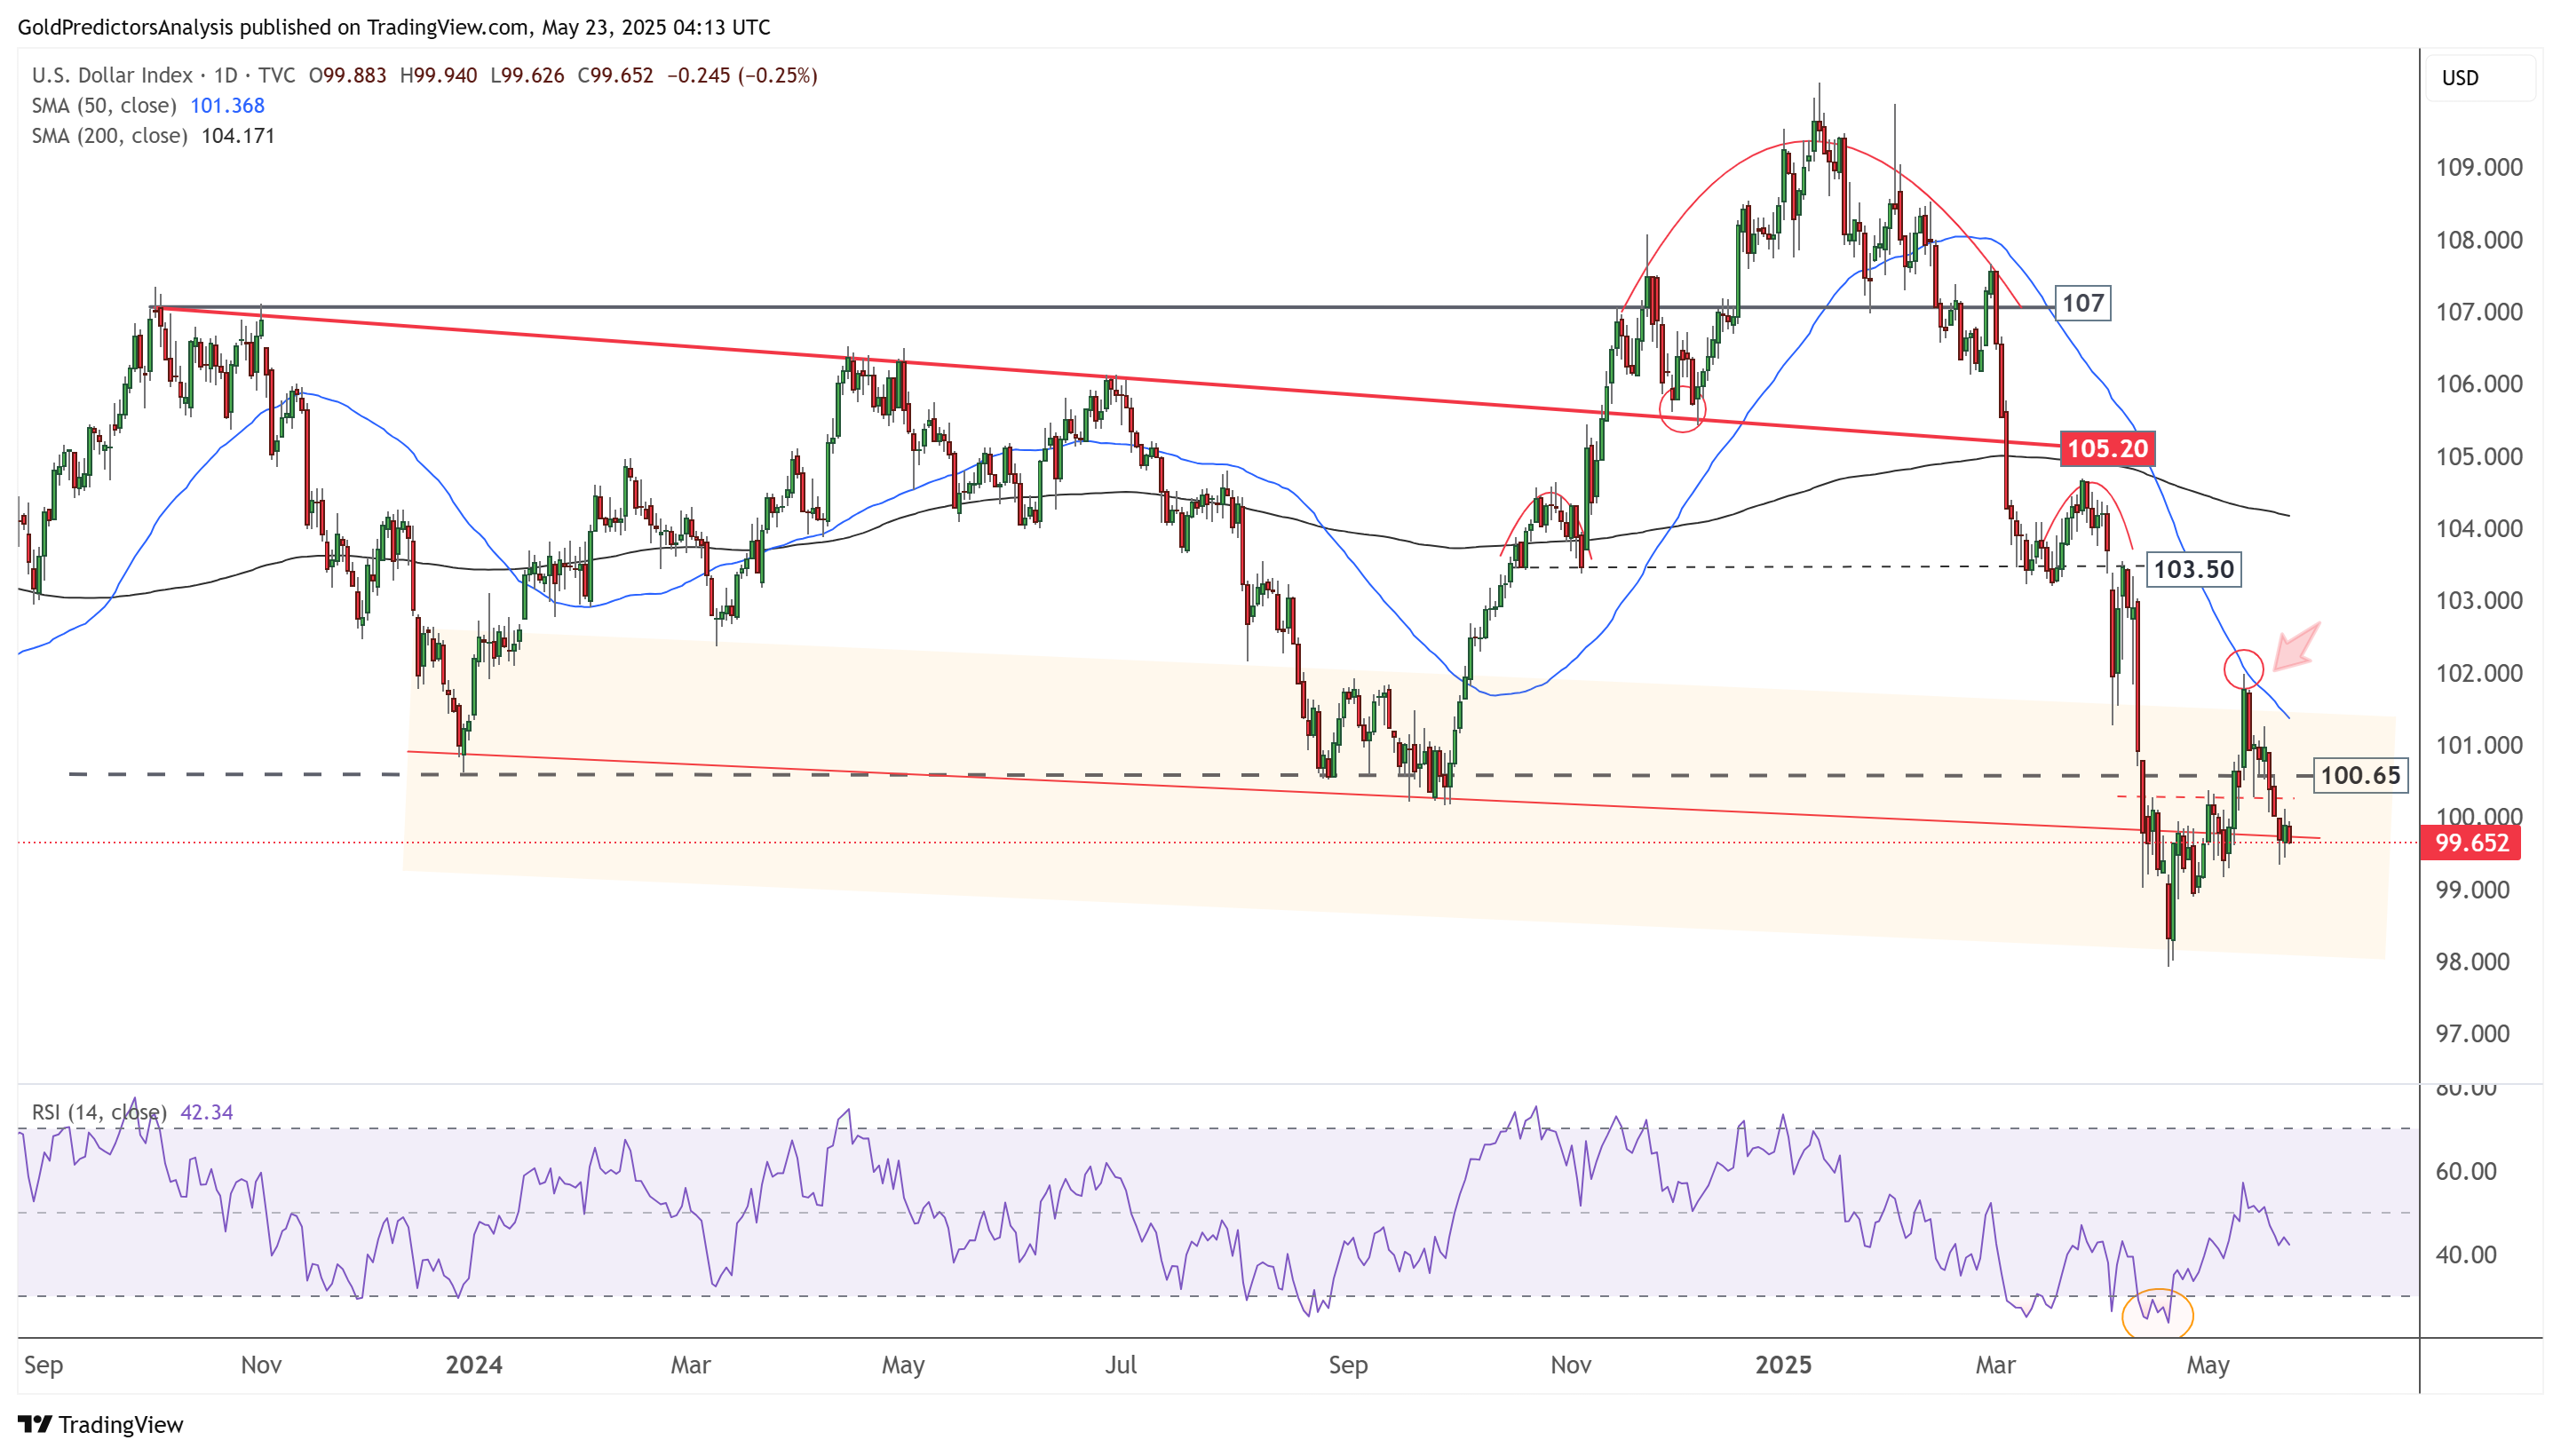
US Dollar Daily – Bearish Pressure
The daily chart for the US Dollar Index shows the formation of an inverted head and shoulders followed by a head and shoulders pattern, indicating bearish momentum. The index has touched the 50-day SMA and continues to move lower. It has broken below the 100.65 level, signaling a strong downward shift. However, the orange zone on the chart highlights a consolidation area. A break below this zone is required to confirm further downside.
US Dollar 4-Hour Chart – Descending Channel
The 4-hour chart for the US Dollar Index shows that the index is trading within a descending channel. It has hit the resistance at 101.60 and is moving lower. A break below 98 will signal further downside toward 96. Moreover, a break below the 96 level will confirm the continuation of the downward trend toward 90. On the other hand, a break above 102 will suggest further upside.

About the Author
Bob MasonChief Crypto Boss
123456789 30 He has written extensively for a broader audience and his current focus is on developments relating to the financial markets including, but not limited to currencies, commodities, alternative asset classes, and global equities.


Advertisement