
Advertisement
Advertisement
Gold (XAUUSD) & Silver Price Forecast: Bulls Seek Recovery After Channel Breakdown
By:
Key Points:
- Gold prices rebounded above $3,300 but face resistance from a strong US dollar and upbeat economic data.
- Durable Goods Orders in April fell 6.3%, beating the expected 7.9% drop, adding strength to the dollar.
- US Consumer Confidence jumped to 98 in May, signaling renewed optimism and easing global trade tensions.

Market Overview
Gold (XAU/USD) prices rebounded modestly during the early Asian session, climbing above the key $3,300 mark after slipping to weekly lows. However, this recovery faces headwinds from a stronger US dollar, which remains buoyed by unexpectedly robust US economic data.
Durable Goods Orders in April declined by 6.3%—a sharp drop but better than the 7.9% market forecast. The Conference Board’s US Consumer Confidence Index jumped to 98 in May, the highest since early 2021, signaling renewed optimism amid easing global trade tensions.
“Gold’s recent rebound reflects temporary relief,” said a senior commodities analyst at a leading bank. “However, with the dollar gaining traction from solid data, upside momentum is capped.”
Despite this, traders continue to eye the Federal Reserve’s next steps. Markets are pricing in at least two 25-basis-point rate cuts by year-end, banking on easing inflationary pressures and a gradual policy pivot. Yet, the dollar’s resilience, buoyed by positive economic indicators, continues to weigh on bullion.
Cautious Optimism Ahead of Key Economic Releases
Investors are bracing for pivotal US economic data later this week, including the FOMC meeting minutes, Q1 GDP revisions, and the Personal Consumption Expenditures (PCE) Price Index. These reports will likely shape the market’s expectations for Fed policy moves and inflation trends, adding a layer of caution to current gold and silver trades.
Meanwhile, geopolitical tensions and fiscal concerns persist, subtly supporting safe-haven demand. However, the solid US data and improved market sentiment limit the precious metals’ near-term rally potential.
Overall, gold and silver remain in a tug-of-war between safe-haven demand and a firmer dollar driven by resilient economic data.
Short-Term Forecast
Gold and silver prices face near-term pressure amid strong U.S. data and dollar resilience. Key resistance levels loom, with potential corrections toward $3,286 for gold and $32.87 for silver.
Gold Prices Forecast: Technical Analysis
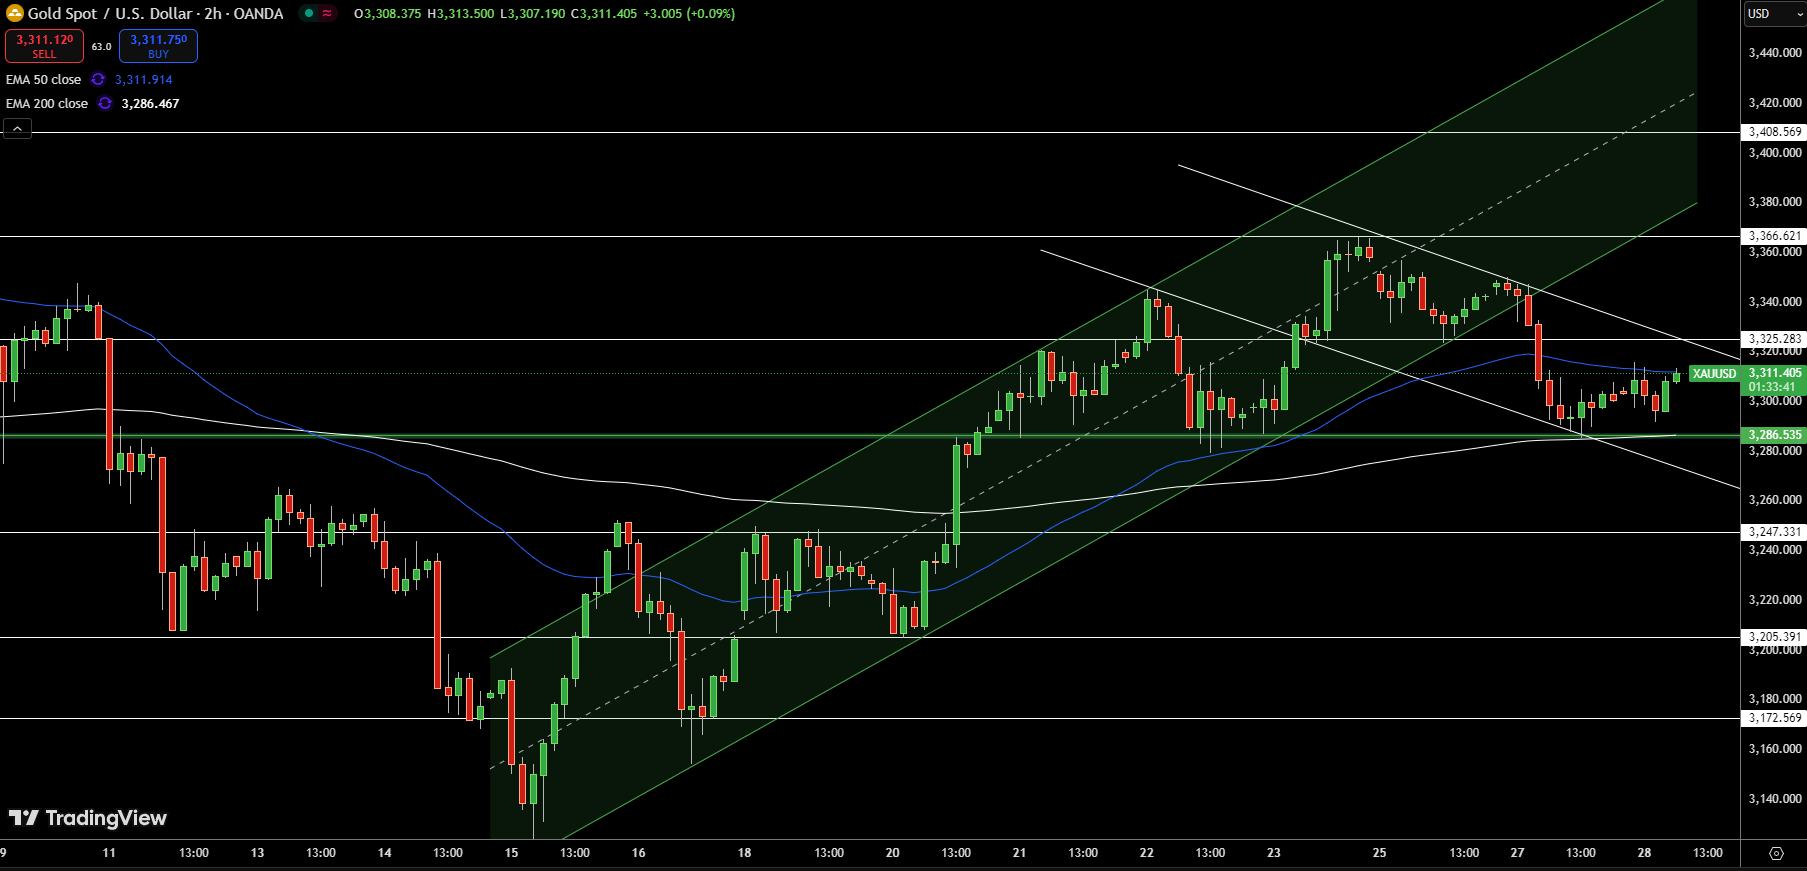
Gold is navigating a complex technical setup, consolidating near $3,311 per ounce after a recent bounce from support around $3,286. The price action highlights a break below a rising channel that had guided gains since mid-May.
The current resistance at $3,325 and $3,366 remains intact, while support sits near $3,286 and further down at $3,247. Candlestick patterns indicate mixed sentiment, with spinning tops signaling indecision.
The price is testing the 50-period EMA at $3,311, while the 200-period EMA at $3,286 lends dynamic support. A close above $3,325 could revalidate bullish momentum, targeting $3,366 and $3,408. Conversely, sustained weakness below $3,286 may trigger deeper corrections toward $3,247 or even $3,205.
Silver (XAG/USD) Price Forecast: Technical Outlook
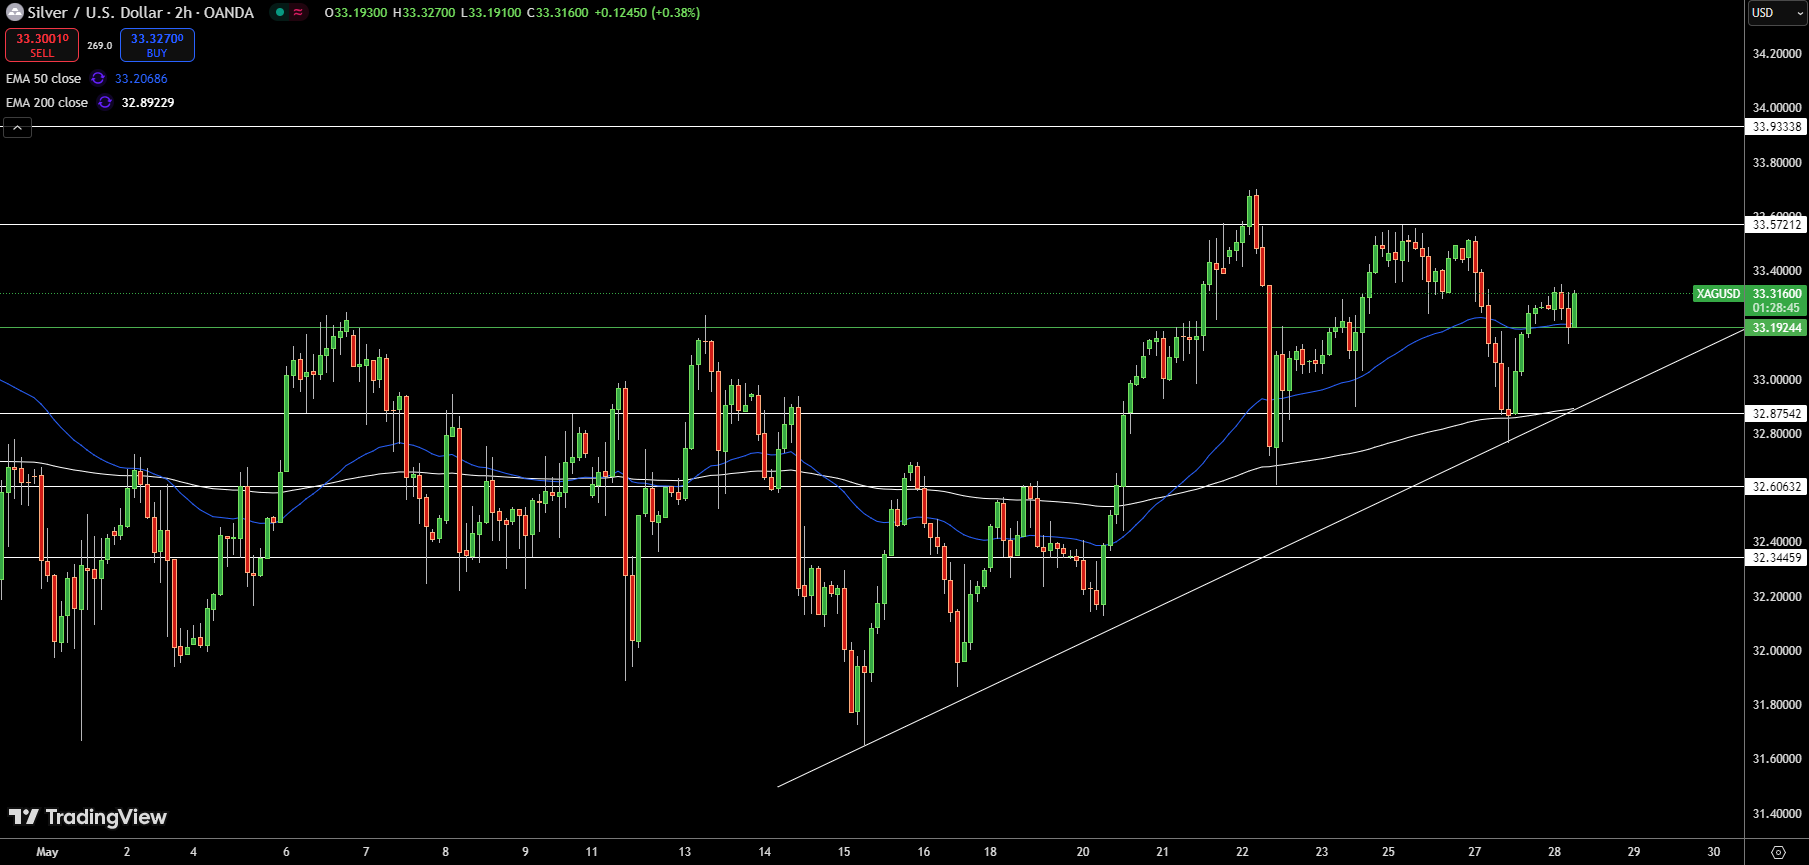
Silver is consolidating near $33.31 per ounce, supported by an ascending trendline from the recent low of $32.34. The 2-hour chart highlights the 50-period EMA at $33.20 and the 200-period EMA at $32.89, providing dynamic support and resistance levels.
Price action is forming a broadening pattern with key resistance at $33.57 and $33.93. If bulls can push above $33.57 with a strong close, the path to $33.93 and beyond could open.
Conversely, failure to hold above $33.19 and a drop below the trendline support could see a retracement toward $32.87 or lower. Candlestick patterns suggest indecision, but a breakout or breakdown is likely imminent. Traders should wait for confirmation before taking a position.
About the Author
Bob MasonChief Crypto Boss
123456789 30 He has written extensively for a broader audience and his current focus is on developments relating to the financial markets including, but not limited to currencies, commodities, alternative asset classes, and global equities.


Advertisement