
Advertisement
Advertisement
Gold (XAUUSD) & Silver Price Forecast: Triple Bottom in Focus Ahead of US Jobs Data
By:
Key Points:
- Gold (XAU/USD) falls toward $3,270 as weak Chinese demand and mixed U.S.-China trade signals weigh on sentiment.
- Silver (XAG/USD) slips to $32.96 amid softer Chinese demand and cautious market mood fueled by trade uncertainty.
- Geopolitical tensions and Fed rate cut expectations continue to provide a safe-haven floor for gold prices.

Market Overview
Gold (XAU/USD) faced renewed selling pressure during the Asian session, falling toward $3,270, a triple bottom support area. The decline followed disappointing demand figures out of China, where gold consumption fell 5.96% year-over-year to 290.492 tonnes in the first quarter, according to the China Gold Association.
Jewelry demand plunged nearly 27% amid persistently high prices, while gold bar and coin demand rose nearly 30%, providing limited offset.
Market sentiment was further pressured by mixed signals from U.S.-China trade talks. Although Washington announced a partial easing of tariffs and President Trump suggested active negotiations, Beijing denied ongoing discussions, keeping risk appetite tentative.
Silver Tracks Gold Lower on Cautious Market Sentiment
Silver (XAG/USD) mirrored gold’s weakness, slipping to $32.96 after reaching an intraday low of $32.65.
The pullback reflected not only weaker Chinese precious metals demand but also broader market hesitation driven by inconsistent trade policy messaging between the world’s two largest economies.
Geopolitical Tensions and Fed Outlook Provide Floor for Gold
Despite the bearish demand backdrop, gold remains supported by persistent geopolitical risks. Rising instability, including reports of troop movements in Eastern Europe, continues to bolster safe-haven demand.
At the same time, expectations of Federal Reserve rate cuts remain intact. Futures markets are pricing in the first cut as early as June, with a full percentage point of easing projected through 2025.
Weaker yields typically favor non-yielding assets like gold, helping cushion price declines despite a relatively firm U.S. dollar.
Key U.S. Economic Data to Drive Next Moves
Attention now turns to a busy U.S. economic calendar. This week’s JOLTS job openings report, core PCE inflation figures, and Friday’s non-farm payrolls (NFP) data could sharpen expectations for Fed policy adjustments.
Any surprises may inject volatility into the gold and silver markets, setting the stage for renewed directional moves.
Short-Term Forecast
Gold defends the $3,270 triple-bottom zone, while silver stabilizes near $32.96. A breakout or breakdown from key levels could set the tone ahead of pivotal U.S. economic data releases.
Gold Prices Forecast: Technical Analysis
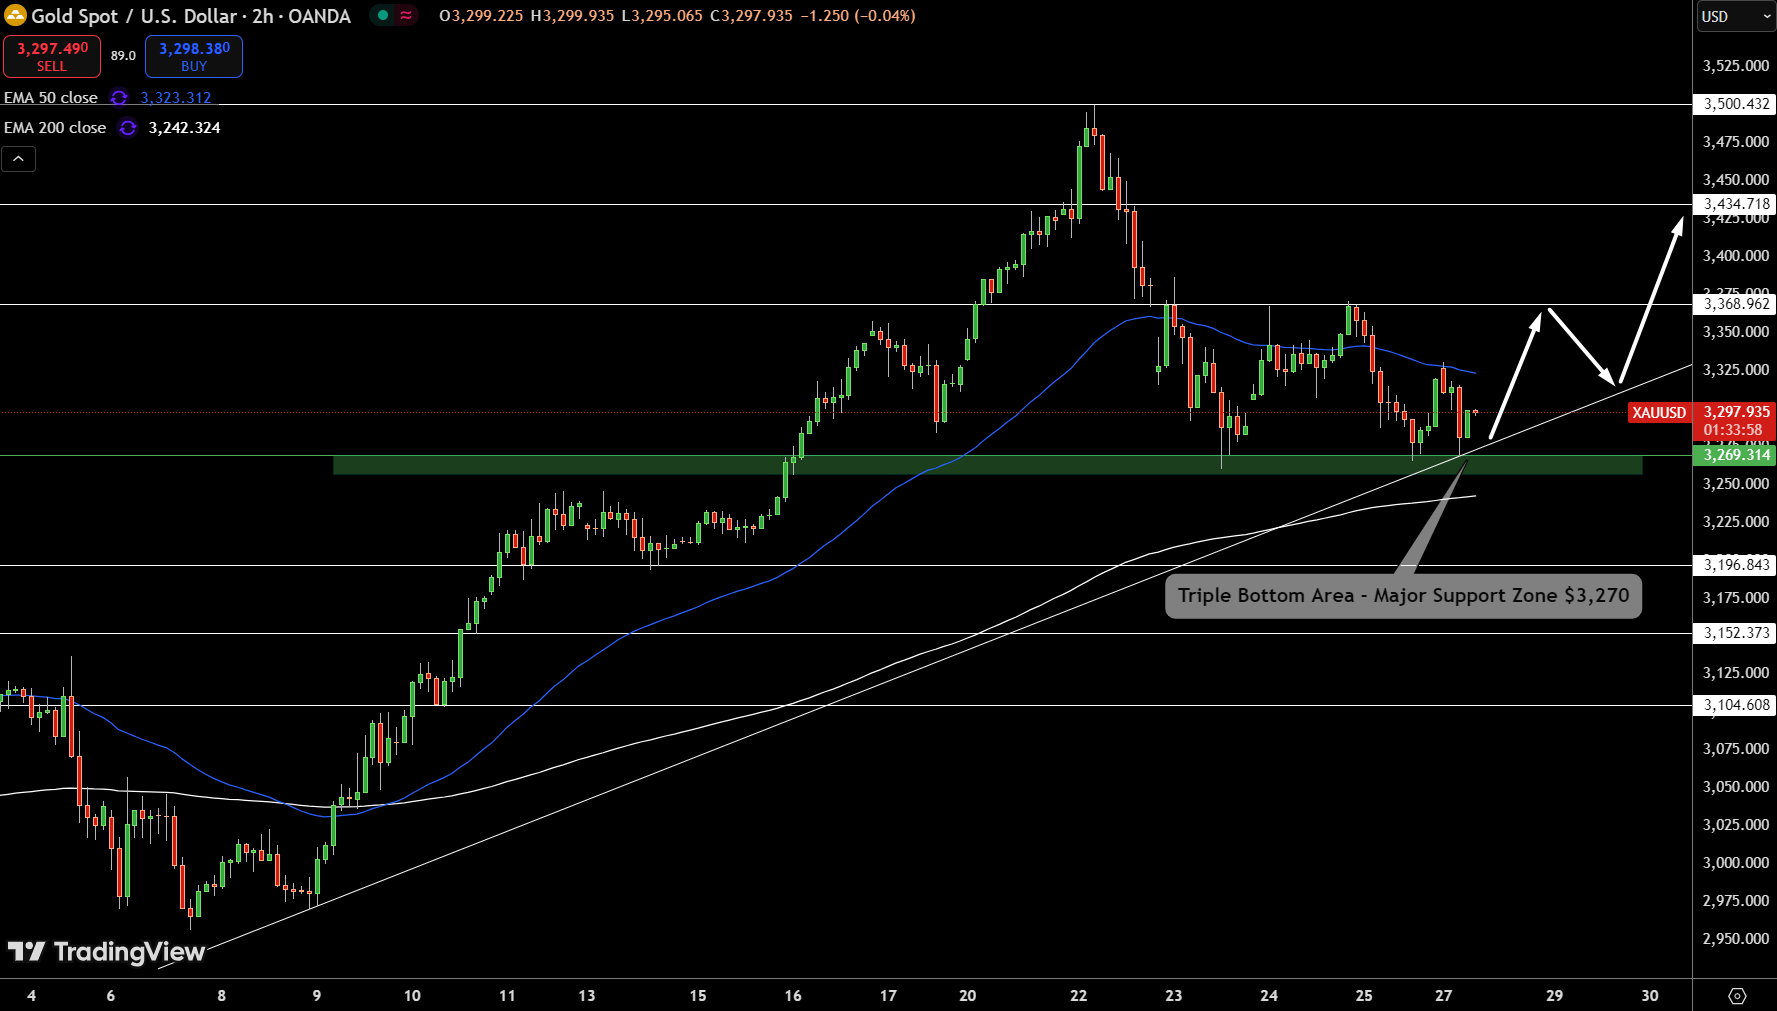
Gold prices are hovering near $3,297, defending the rising trendline and major support zone around $3,270, where a triple-bottom structure is forming. The pivot point sits around $3,269, offering critical near-term support. Immediate resistance stands at $3,369, followed by $3,434, and the next key target at $3,500.
A breakdown below $3,270 could open the door toward $3,196 and potentially $3,152. The 50 EMA at $3,323 and the 200 EMA at $3,242 are important trend guides—price action currently dances between them.
A clean bullish reaction above $3,323 would strengthen the short-term outlook, while a failure to hold $3,270 may shift momentum back to sellers.
Silver (XAG/USD) Price Forecast: Technical Outlook
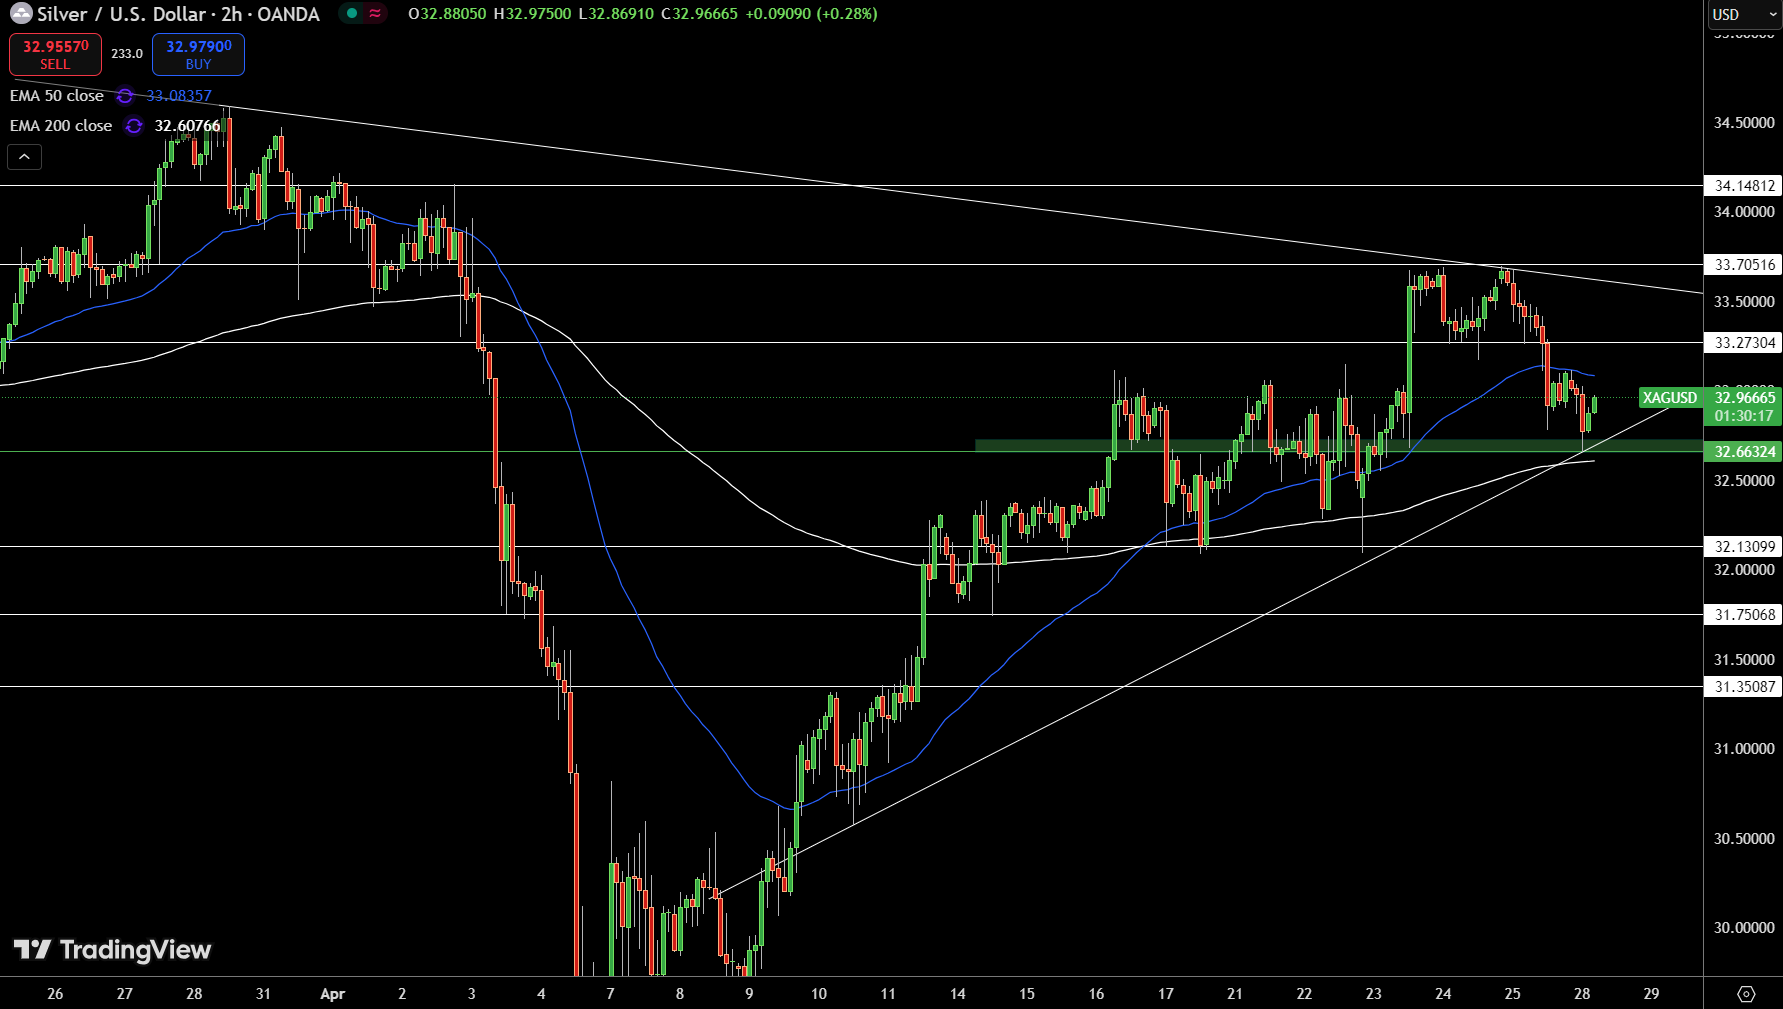
Silver prices are stabilizing near $32.96 after testing support at $32.66, where a key demand zone and ascending trendline converge. The pivot point at $32.66 remains a critical line in the sand for bulls. Immediate resistance stands at $33.27, with additional hurdles at $33.70 and $34.14.
On the downside, if $32.66 fails, support levels at $32.13 and $31.75 come into play. The 50 EMA at $33.08 continues to cap upside attempts, while the 200 EMA at $32.60 underpins the broader trend. Price action is now coiled between these moving averages.
A breakout above $33.27 could reignite bullish momentum, while a failure below $32.66 may deepen the corrective slide.
About the Author
Bob MasonChief Crypto Boss
123456789 30 He has written extensively for a broader audience and his current focus is on developments relating to the financial markets including, but not limited to currencies, commodities, alternative asset classes, and global equities.


Advertisement