
Advertisement
Advertisement
Gold (XAUUSD) & Silver Price Forecast: XAU Hovers Near $3,346, XAG Tests $33.70 Zone
By:
Key Points:
- Gold holds steady at $3,346 despite tariff delay, with rate cut expectations and a softer dollar providing support.
- U.S. deficit expected to rise $4T over 10 years, bolstering gold amid low rates and a one-month low dollar.
- Silver hovers near $33.53, supported by bullish trends and Fed rate cut expectations, with resistance at $33.70.

Market Overview
Gold (XAU/USD) slipped slightly during Asian trading hours on Monday, trading near $3,346 per ounce after last week’s 5% surge. The dip followed U.S. President Donald Trump’s decision to extend the deadline for imposing 50% tariffs on European Union imports from June 1 to July 9. This delay eased immediate concerns of trade disruption, tempering gold’s recent upward momentum.
However, gold’s downside remains limited, underpinned by persistent concerns over the U.S. fiscal position. The Congressional Budget Office projects the U.S. federal deficit to expand by $4 trillion over the next decade, driven by recent tax cuts and spending increases. This mounting deficit has pressured the U.S. dollar to a one-month low, indirectly bolstering gold, which remains attractive in a low-interest-rate environment.
Silver (XAG/USD) mirrored gold’s cautious tone, hovering near $33.54 per ounce. Both precious metals continue to benefit from the softer dollar and rising expectations that the Federal Reserve may lower interest rates later this year. Futures markets are now pricing in at least two 25-basis-point rate cuts by year-end, amid slowing U.S. inflation and tepid economic growth.
Market Sentiment Focuses on Upcoming U.S. Economic Reports
Investors are closely watching upcoming U.S. economic data for further clues on monetary policy.
Key releases this week include durable goods orders, preliminary GDP figures, and the Personal Consumption Expenditures (PCE) price index, all scheduled before Friday.
Minneapolis Fed President Neel Kashkari recently warned that prolonged tariff policies could risk stagflation, reinforcing market bets on a dovish shift from the central bank.
Geopolitical Tensions Add Underlying Support to Precious Metals
While trade delays eased market anxiety, broader geopolitical tensions continue to lend support to safe-haven assets. Escalating conflicts in Eastern Europe and ongoing Middle East unrest have sustained demand for gold and silver as investors hedge against uncertainty.
In the near term, traders are likely to remain cautious, awaiting clarity from the Federal Open Market Committee (FOMC) minutes on Wednesday, which may offer additional insights into the Fed’s rate-cutting timeline.
Short-Term Forecast
Gold may range near $3,346 amid resistance at $3,366.62 and support at $3,332.97, while silver eyes $33.70, with market focus on Fed minutes and key U.S. data.
Gold Prices Forecast: Technical Analysis
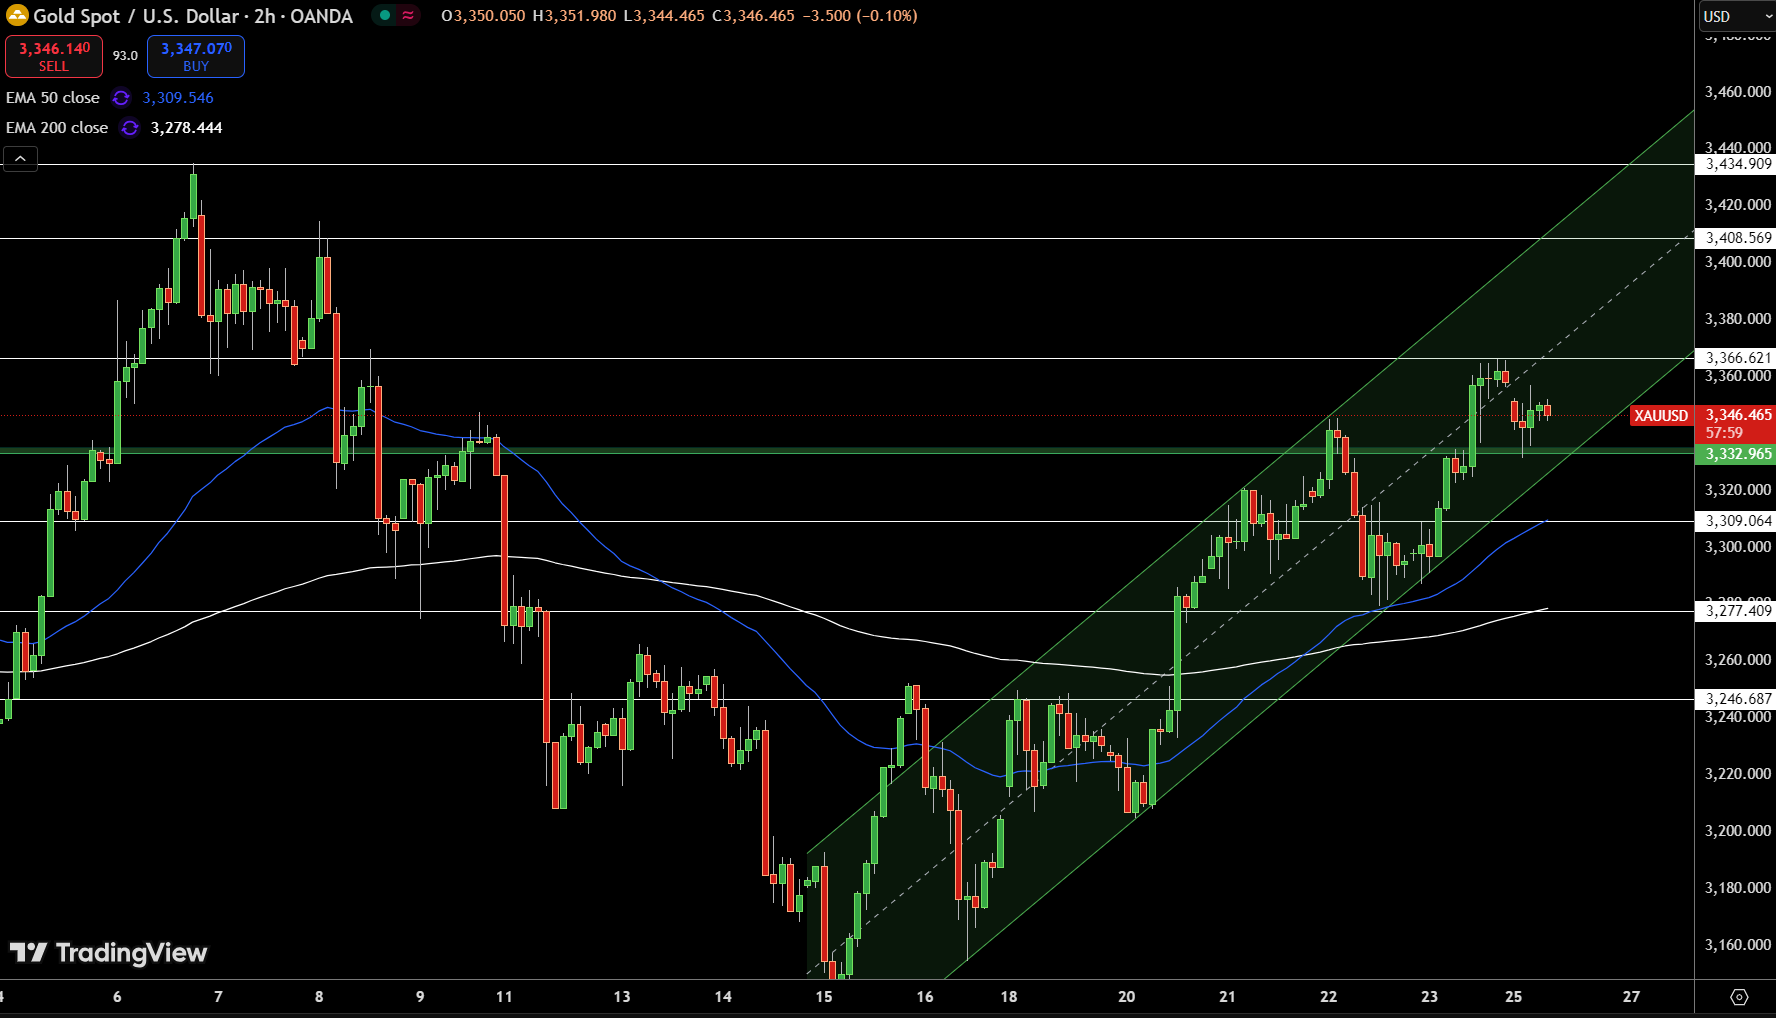
Gold (XAU/USD) is hovering at $3,346.47, down 0.10%, as traders weigh momentum signals. The 2-hour chart shows price action respecting an upward channel marked by higher highs and higher lows. However, recent candles reflect hesitation, with spinning tops and small-bodied formations emerging near $3,366.62 resistance.
The 50-period EMA ($3,309) and 200-period EMA ($3,278) provide layered support below. A clean break above $3,366.62 with a bullish engulfing or three white soldiers pattern may trigger a push towards $3,408.57.
Conversely, a failure to hold $3,332.97 support might spark a dip toward $3,309. Patience and confirmation are key for traders.
Silver (XAG/USD) Price Forecast: Technical Outlook
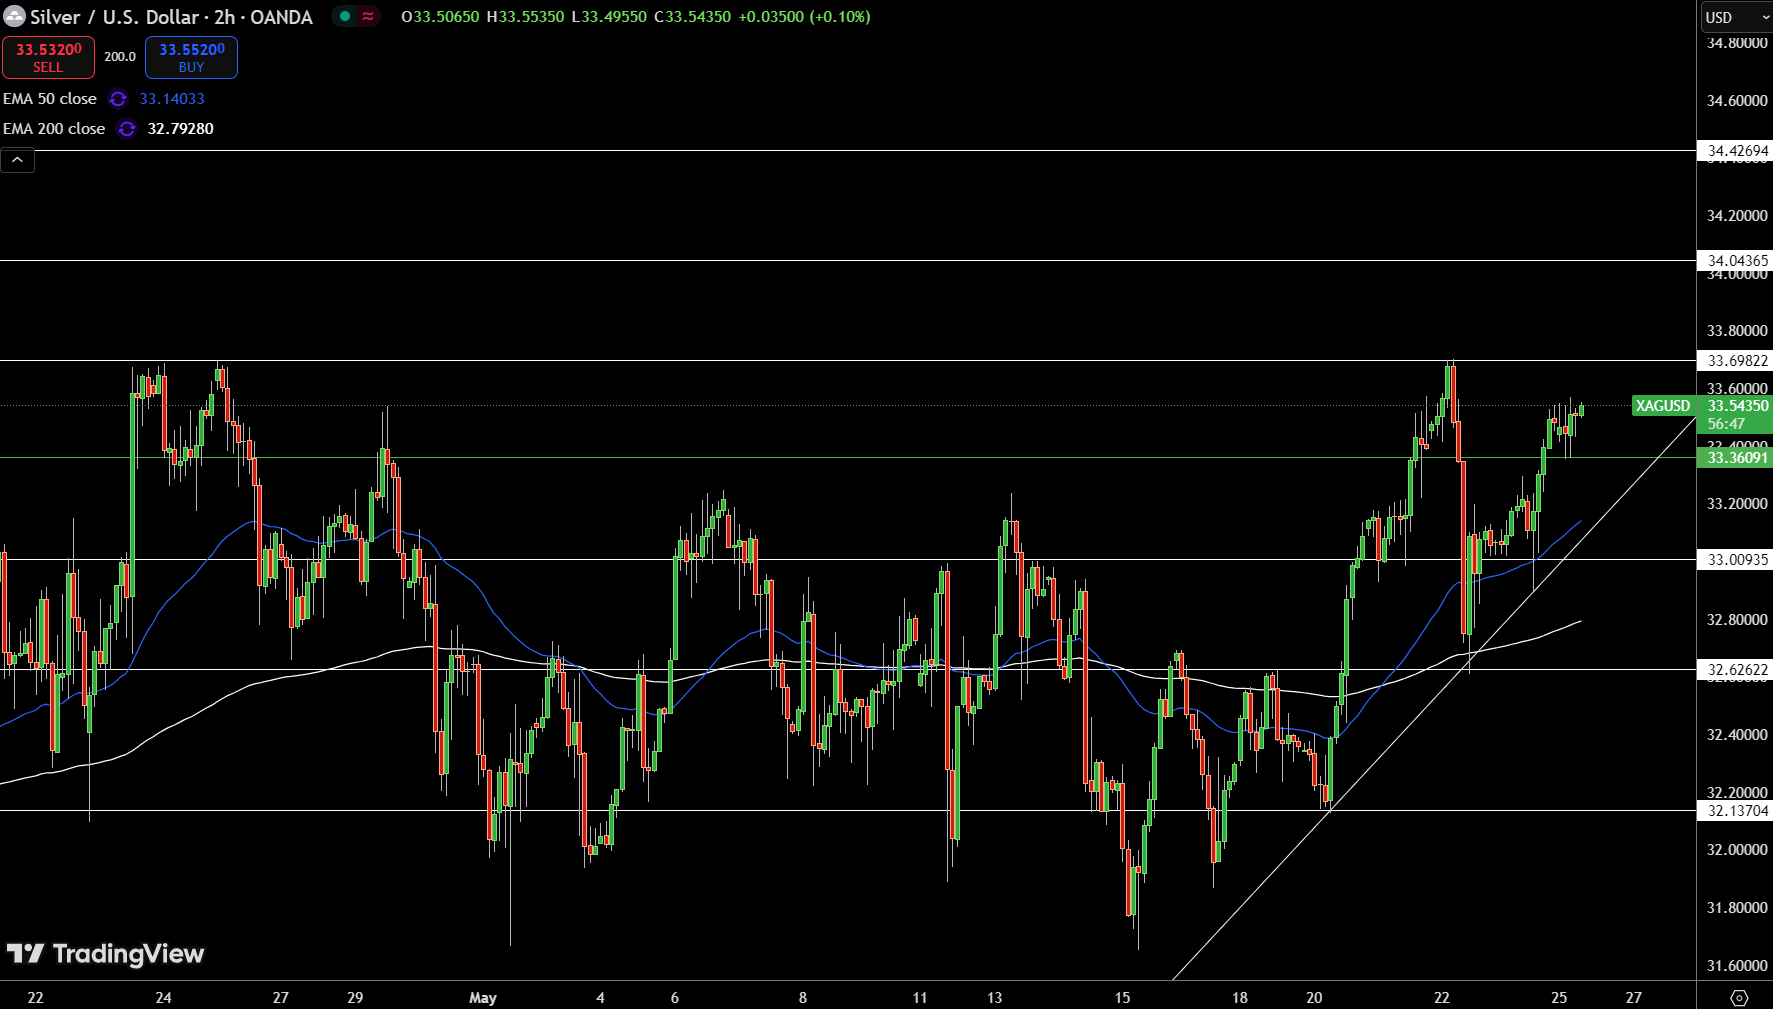
Silver (XAG/USD) is currently at $33.54, showing resilience with a steady climb along an ascending trendline. The 2-hour chart highlights price action pressing against a resistance level near $33.70, after rebounding from support at $32.63.
The presence of the 50-period EMA at $33.14 and the 200-period EMA at $32.79 reinforces underlying support, with price forming higher lows, hinting at continued bullish momentum.
However, recent candlestick formations, featuring multiple doji, indicate market indecision. A confirmed breakout above $33.70 could target $34.04, while a drop below $33.36 might trigger a pullback toward the $33.14 or $32.80 zones. Traders should watch for a decisive move before positioning.
About the Author
Bob MasonChief Crypto Boss
123456789 30 He has written extensively for a broader audience and his current focus is on developments relating to the financial markets including, but not limited to currencies, commodities, alternative asset classes, and global equities.


Advertisement