
Advertisement
Advertisement
Japanese Yen Forecast: Will USD/JPY Break 145? Tokyo Inflation and US Data Hold the Key
By:
Key Points:
- Tokyo's inflation figures could sway USD/JPY as softer-than-expected data may dampen BoJ rate hike bets.
- BoJ Governor Ueda shifts focus to October service price revisions, casting doubt on a Q4 2024 rate hike.
- US Personal Income and Outlays Report may reverse bets on a November Fed rate cut, impacting USD demand.

In this article:
Tokyo Inflation and the BoJ Rate Path
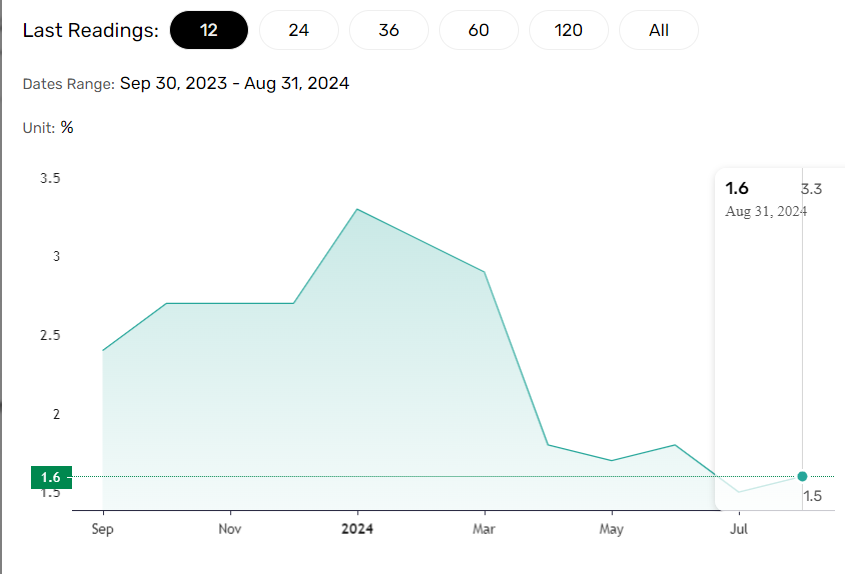
On Friday, September 27, inflation figures for Tokyo will impact buyer demand for the USD/JPY pair.
Economists forecast Tokyo’s annual inflation rate, excluding food and energy, to ease from 1.6% to 1.4%. Softer-than-expected inflation figures could dampen investor expectations of a Q4 2024 Bank of Japan (BoJ) rate hike.
This week, Bank of Japan Governor Kazuo Ueda dismissed the headline national inflation numbers for August, stating,
“October is a month when service price revisions are concentrated in Japan, so we must scrutinize data carefully.”
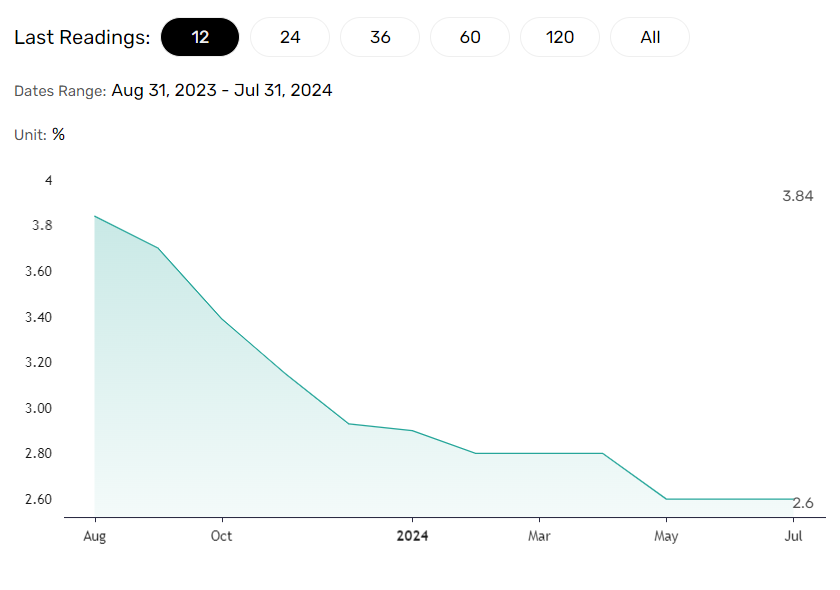
The national inflation rate accelerated from 2.8% in July to 3.0% in August. However, softer inflation numbers from Tokyo would align with Governor Ueda’s shift in focus to October’s services sector price revisions. Falling bets on a Q4 2024 BoJ rate hike could push the USD/JPY through 145.
Expert Views on the BoJ Rate Path
Amidst increasing speculation about the Q4 2024 BoJ rate path, PGIM Alternatives CIO Aniruddha Naha stated,
“Japan’s core CPI index climbed 2.8% year on year, in line with estimates, versus a 2.7% rise in the previous month. With inflation inching higher, likelihood of an interest rate hike in Japan. Interesting times, as US has cut rates. The Yen carry trade unwinding is on.”
A higher-than-expected Tokyo inflation print could fuel speculation about a Q4 2024 rate hike, possibly inducing market volatility over fears of another ‘Yen carry trade unwind.’
US Personal Income and Outlays Report Under Scrutiny
Later on Friday, the crucial US Personal Income and Outlays Report will influence US dollar demand. Economists expect the Core PCE Price Index to increase by 2.7% year-on-year in August, up from 2.6% in July,
Higher-than-expected inflation figures may reduce investor bets on a 50-basis point November Fed rate cut. However, investors should also consider personal income/spending trends. Weaker personal income and spending could signal a softer inflation look, possibly fueling bets on a 50-basis point November Fed rate cut.
According to the CME FedWatch Tool, the probability of a 50-basis point Fed rate cut was 60.8% on Thursday, September 26.
Weaker-than-expected US data could push the USD/JPY down toward 143.5.
Short-term Forecast for USD/JPY
USD/JPY trends will hinge on inflation numbers from Tokyo and the US and central bank commentary. Hotter-than-expected inflation numbers for Tokyo could strengthen expectations of a Q4 2024 BoJ rate hike, possibly pushing the USD/JPY toward 143.5. However, the US Personal Income and Outlays Report also needs consideration amidst rising bets on a 50-basis point September Fed rate cut.
Investors should remain vigilant, with economic indicators and central bank commentary to dictate demand for the USD/JPY pair. Monitor real-time data, central bank views, and expert commentary to adjust your trading strategies accordingly. Stay ahead of the market with our expert insights.
USD/JPY Technical Analysis
Daily Chart
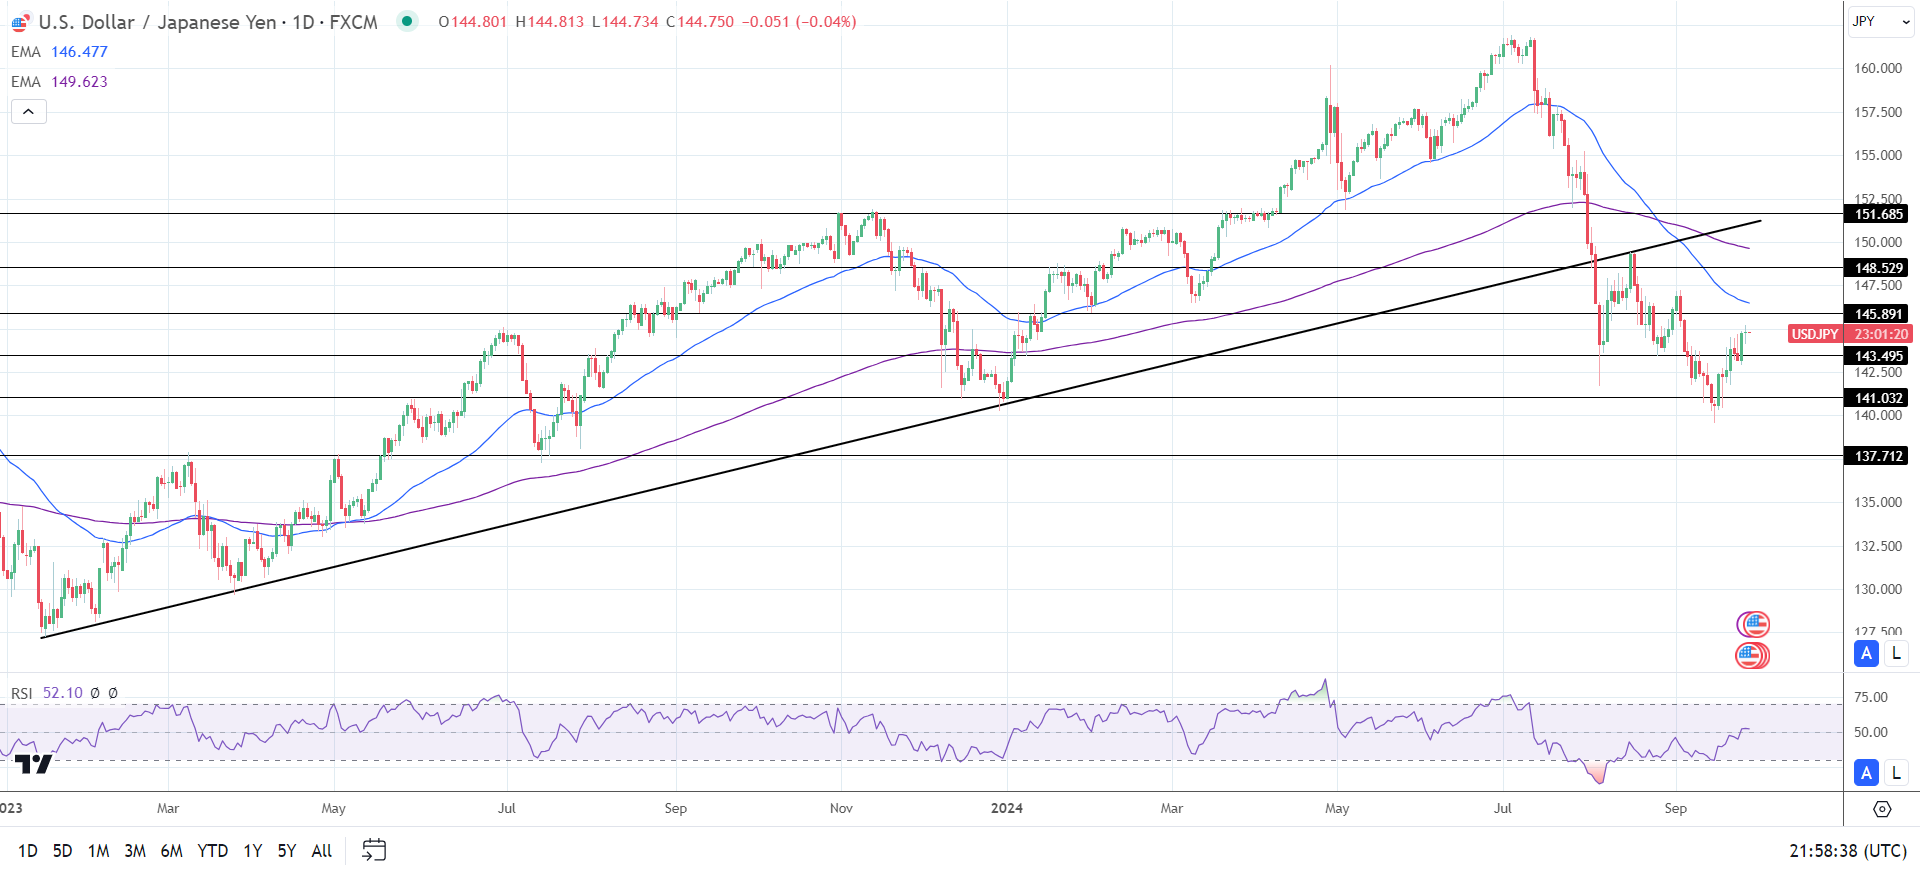
The USD/JPY hovers below the 50-day and 200-day EMAs, confirming bearish price trends.
A USD/JPY breakout from 145 could give the bulls a run at the 145.891 resistance level. Furthermore, a break above the 145.891 resistance level could bring the 50-day EMA into play.
Central bank commentary and inflation figures from Japan and the US require consideration.
Conversely, a drop below the 143.495 support level could signal a fall toward 142.5. A fall through 142.5 may give the bears a run at the 141.032 support level.
The 14-day RSI at 52.10 indicates a USD/JPY climb to 147.5 before entering overbought territory.
About the Author
Bob MasonChief Crypto Boss
TEST 30 He has written extensively for a broader audience and his current focus is on developments relating to the financial markets including, but not limited to currencies, commodities, alternative asset classes, and global equities.
Latest news and analysis


Advertisement