
Advertisement
Advertisement
Memecoin Madness: How PEPE, SHIB, and DOGE Could Surge 100%+ Soons
By:
Top memecoins PEPE, SHIB, and DOGE show key bullish technical setups, pointing to potential breakouts and notable upside by July 2025.
Top memecoins Pepe (PEPE), Shiba Inu (SHIB), and Dogecoin (DOGE) are showing key technical setups that point to potential breakouts with notable upside by July.
PEPE forms a classic cup and handle, SHIB trades inside a tightening symmetrical triangle, and DOGE climbs within an ascending channel targeting crucial resistance levels, highlighting a possible surge in momentum across the memecoin sector.
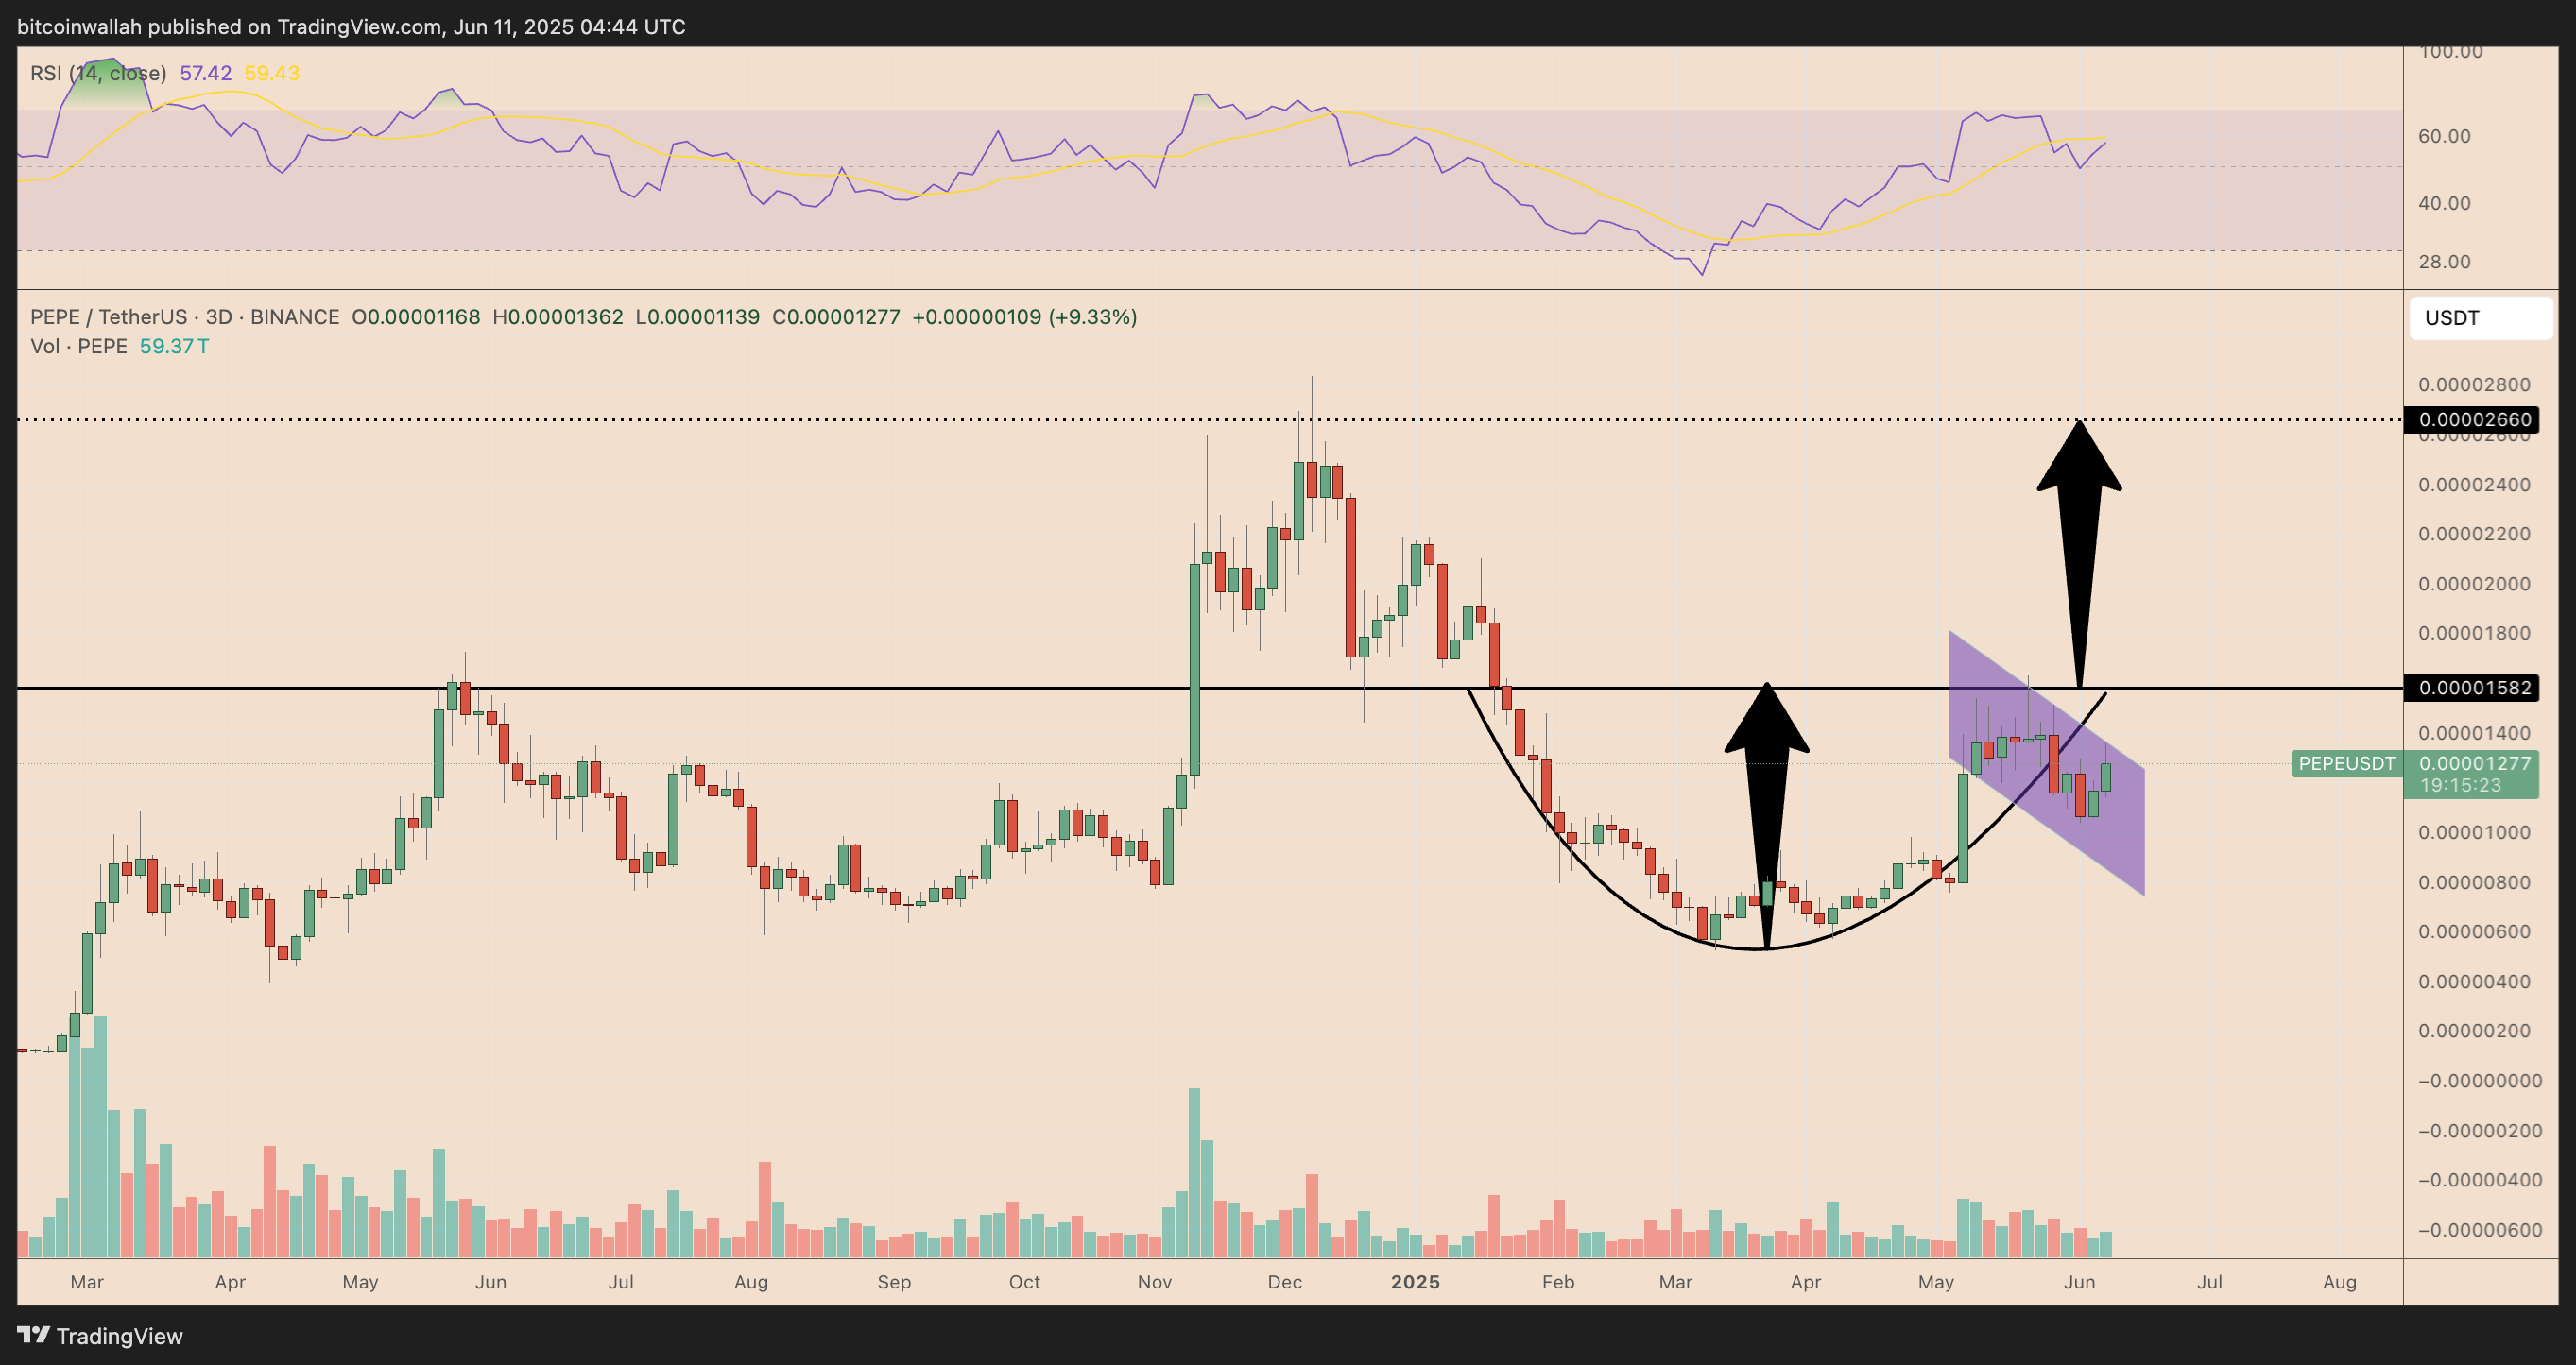
A clear breakout above this level could push PEPE toward $0.00002660, implying a roughly 110% gain from the current price of $0.00001277.
Volume and RSI levels support the setup, suggesting room for upward momentum. Traders should watch for a sustained move above the neckline to confirm the rally.
Failure to break resistance may delay gains or lead to further consolidation.
SHIB Trades in Symmetrical Triangle, Upside Favored
SHIB/USDT is consolidating within a symmetrical triangle on the 3-day chart, with key resistance near $0.00001600 and support around $0.00001100.
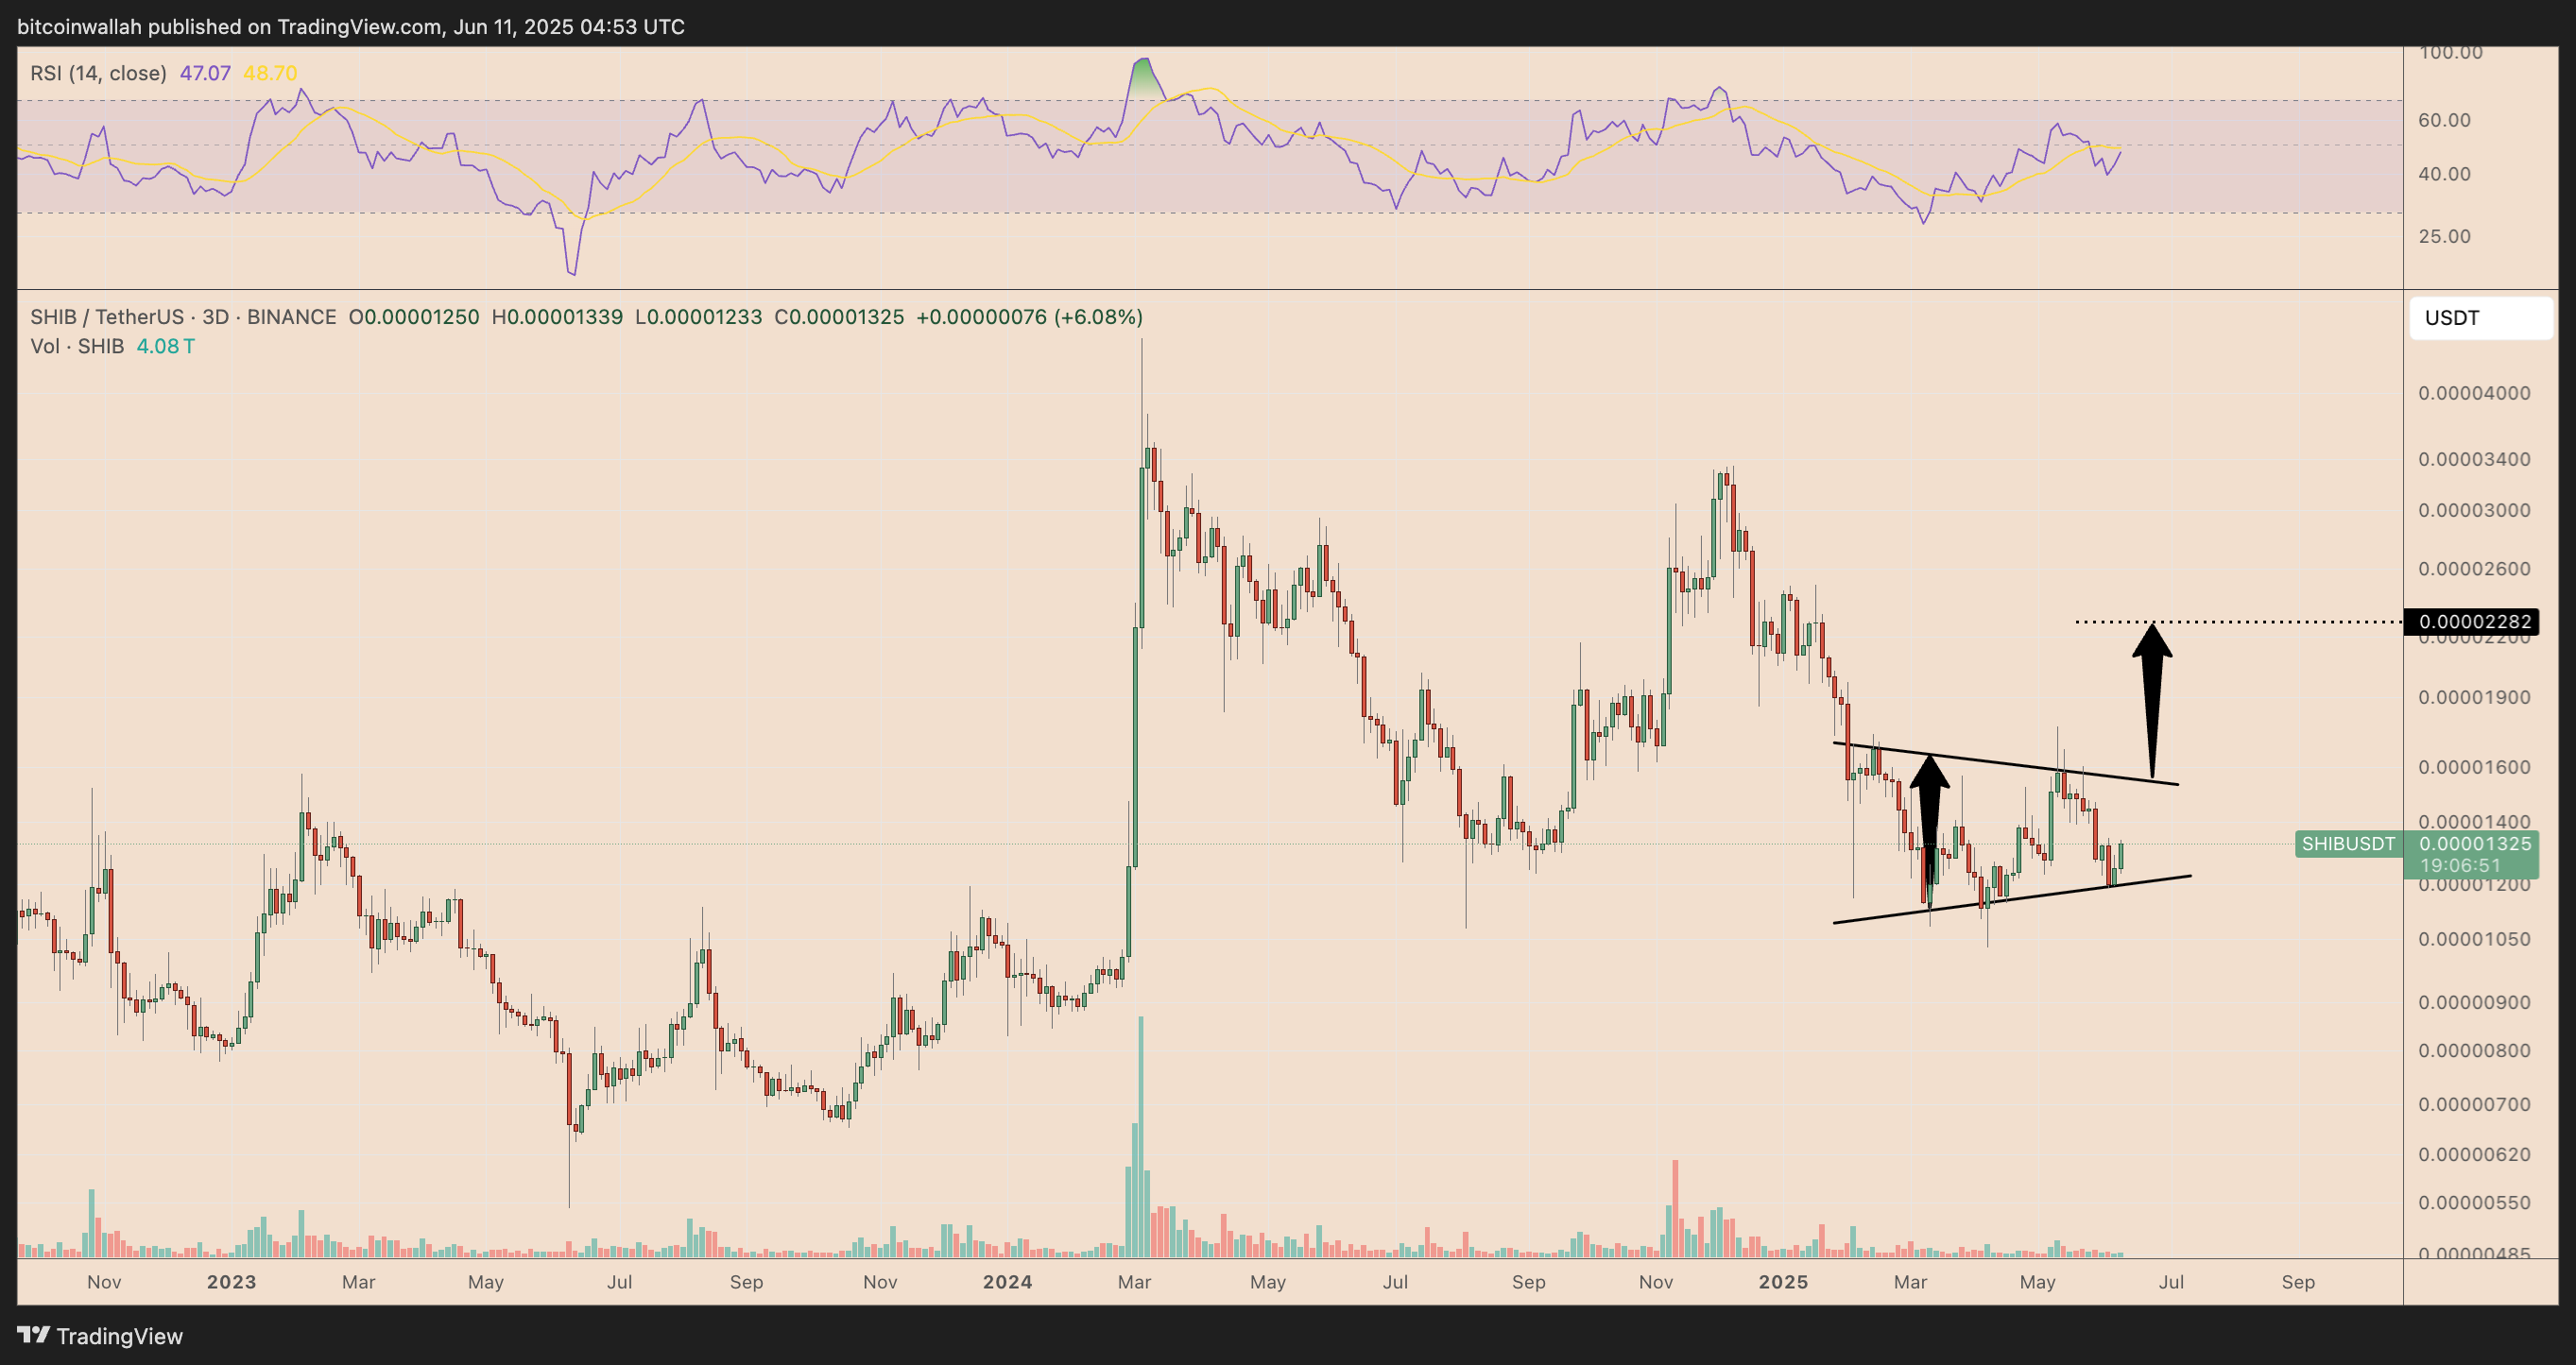
A breakout above resistance could push SHIB toward $0.00002282, signaling strong upside potential from the current $0.00001325 price.
RSI is neutral, and volume is low, typical before a breakout. While the pattern could break either way, bullish crypto market sentiment favors an upside move.
Traders should watch volume and trendline breaks for confirmation.
DOGE Targets $0.30 Resistance Within Ascending Channel
Dogecoin is trading inside a clear ascending channel on the 3-day chart, showing steady upward momentum since mid-2024. The channel’s upper trendline coincides with the 0.5 Fibonacci retracement level around $0.30, marking a key resistance point.
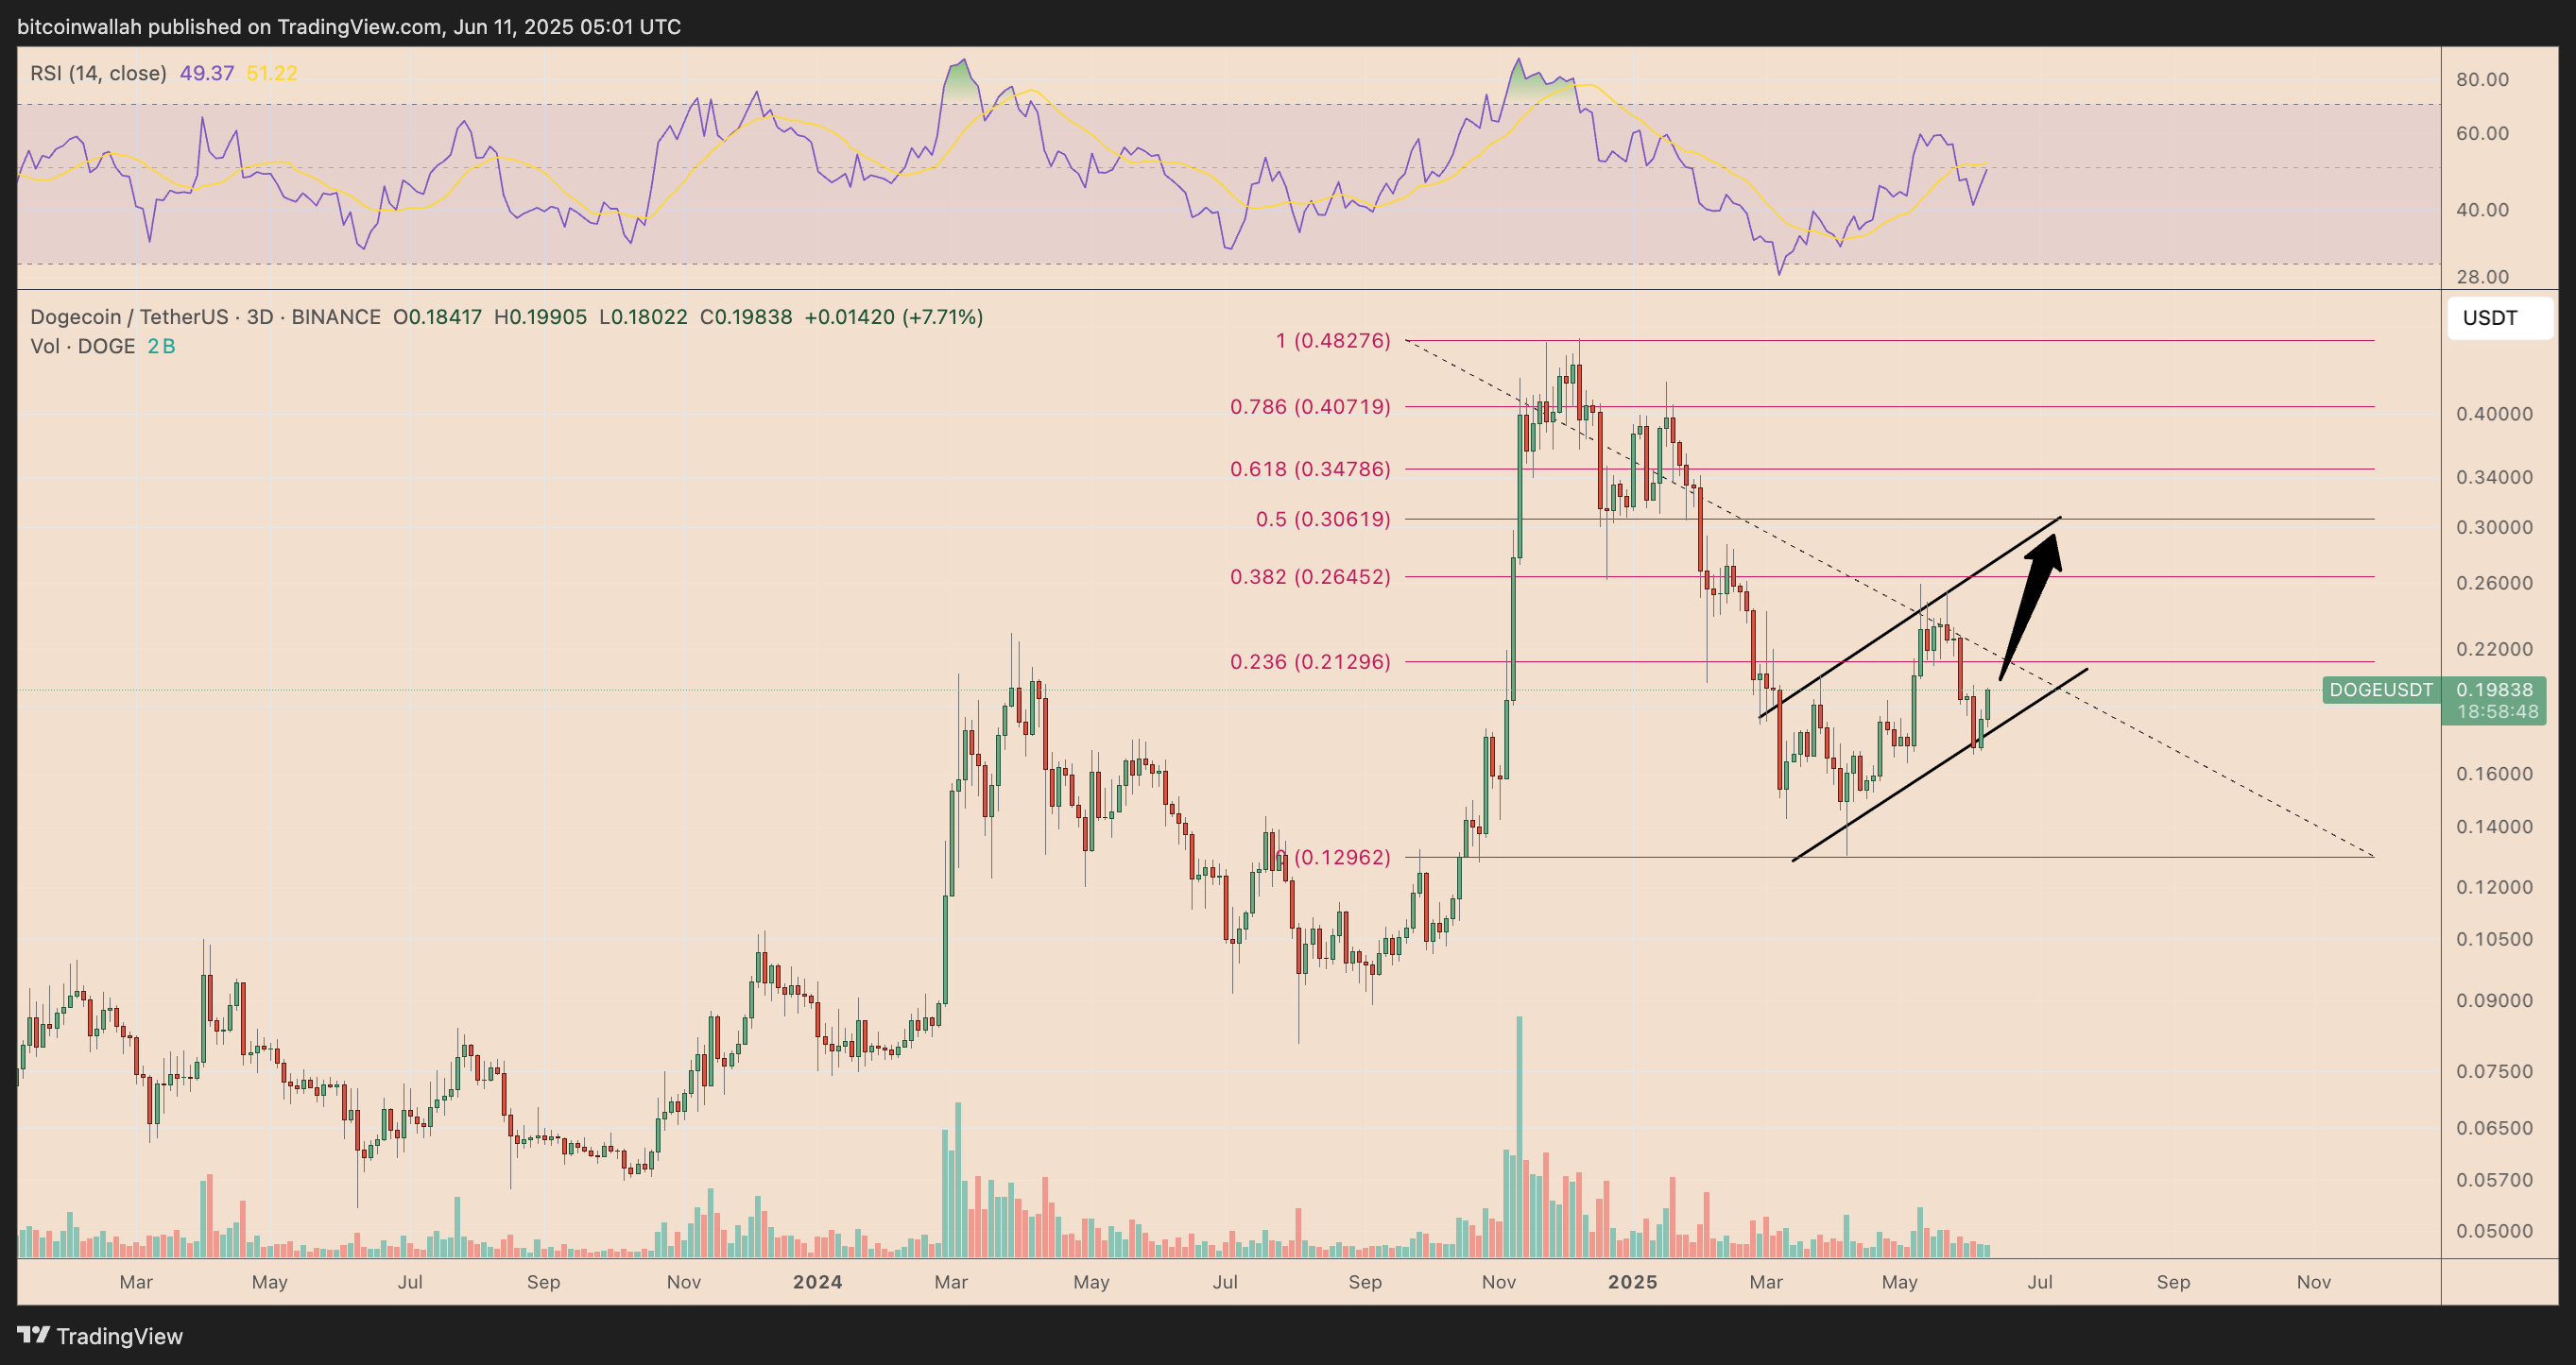
The RSI sits near neutral levels, indicating potential for further gains without being overbought. A successful breakout above $0.30 could propel DOGE toward the 0.618 and 0.786 Fibonacci levels near $0.35 and $0.41.
Traders should monitor the channel’s lower boundary, as a breakdown below it may trigger a pullback to support near $0.18.
Overall, DOGE’s technical structure favors continued gains, with $0.30 as a critical hurdle for the next leg up.
About the Author
Bob MasonChief Crypto Boss
123456789 30 He has written extensively for a broader audience and his current focus is on developments relating to the financial markets including, but not limited to currencies, commodities, alternative asset classes, and global equities.


Advertisement