
Advertisement
Advertisement
NASDAQ 100, Dow Jones 30 and S&P 500 Forecast – US Indices Continue to Hover
Published: Feb 13, 2025, 13:35 GMT+00:00
The US indices that I follow are all showing the same pattern – that we have nowhere to be at the moment, but the upside still looks like the right side of the trade.
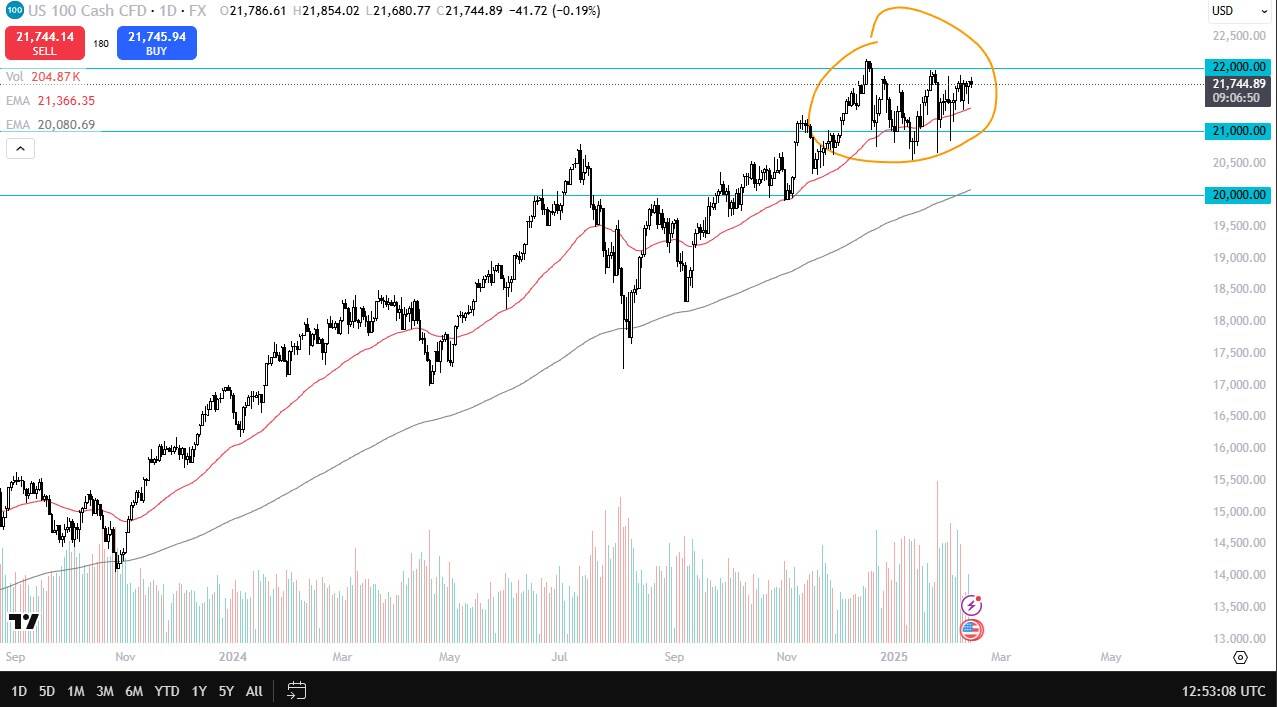
NASDAQ 100 Technical Analysis
The Nasdaq 100 looks like it continues to see the 22,000 level as a major barrier, and if we can break above there, then the market could go much higher. It does look like we’re forming a little bit of a bottoming pattern at the top of a trend. So, this is continuation just waiting to happen from what I can see. Short-term pullbacks will continue to see support at the 50-day EMA. And then after that, the 21,000 level. I don’t think we break down below there unless something drastically changes. So, I do believe this is a buy on the dip market.
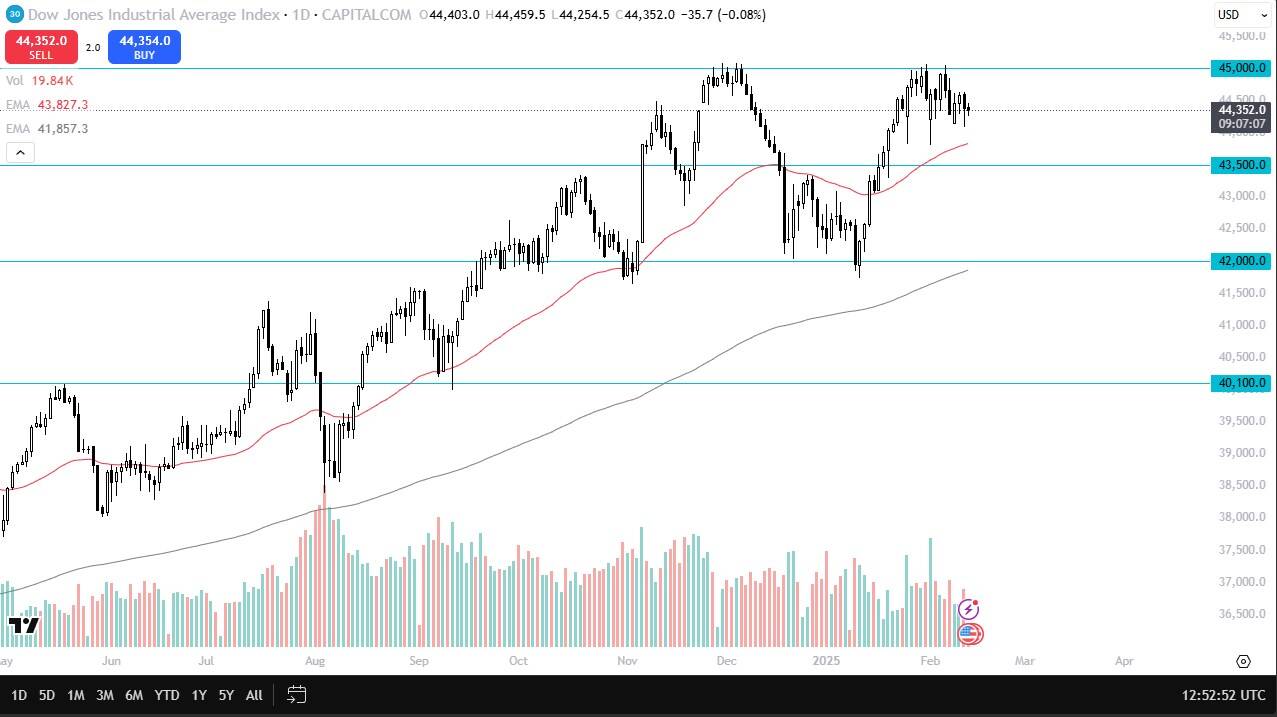
Dow Jones 30 Technical Analysis
The Dow Jones 30 of course is just killing time right now as well. It looks like we don’t really have anywhere to be. The 45,000 above is a major bearer that needs to be overcome with the 50 day EMA and the 43,500 level underneath offering support. At this point, we are basically in the middle of all of that.
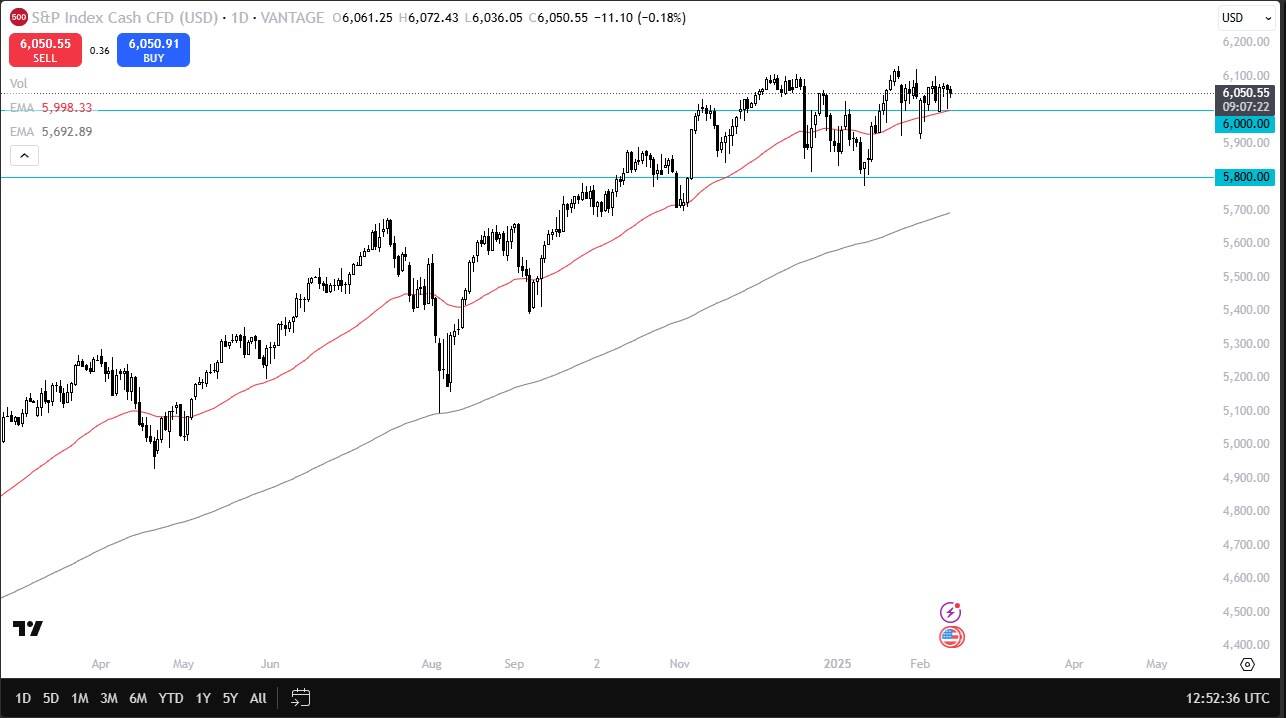
S&P 500 Technical Analysis
The S&P 500 is a little bit lower in pre-market trading, but it still seems to be paying close attention to the $6,000 level for support, especially with the 50-day EMA hanging around there. If we can break above $6,125, then I think the market can take off to the upside for a bigger move. It does look like we are trying to bottom in most of these pullbacks, and therefore I am still bullish, but I also recognize that a lot of what’s going on really can’t be quantified because it’s fear about more tariffs coming from Donald Trump or the existing threat. So, at this point in time, we are trading the latest tweet or statement, but overall, the trend in all of these indices remains positive.
For a look at all of today’s economic events, check out our economic calendar.
About the Author
Christopher Lewisauthor
Christopher Lewis is an experienced trader that specializes in technical analysis and markets prediction. Chris has over 20 years of experience across a wide variety of markets and assets - currencies, indices, and commodities.
Latest news and analysis


Advertisement