
Advertisement
Advertisement
Natural Gas and Oil Forecast: Brent Caught in Descending Triangle, Eyes $65.36 Target on Breakout
By:
Key Points:
- Energy markets stay cautious as geopolitical tensions and OPEC+ output hikes shape oil and gas prices.
- Brent Crude hovers near $63.92, forming a descending triangle with potential breakout targets at $65.36.
- WTI crude hovers near $61.27, testing $60.06 support with descending trendline resistance holding firm.

Market Overview
Energy markets remain cautious as geopolitical tensions and shifting OPEC+ strategies continue to shape the landscape. Oil prices fell for a second session amid speculation that OPEC+ may raise output by 411,000 barrels per day following their upcoming meeting.
Brent and WTI crude dipped further, with WTI not settling on Monday due to the U.S. holiday. Meanwhile, rising geopolitical risks are prompting traders to hedge against potential supply disruptions.
The official selling price of Iranian crude for Asia was set at $1.80 above the Oman/Dubai benchmark, highlighting ongoing supply dynamics. Persistent uncertainties are casting shadows over natural gas and oil forecasts.
Natural Gas Price Forecast
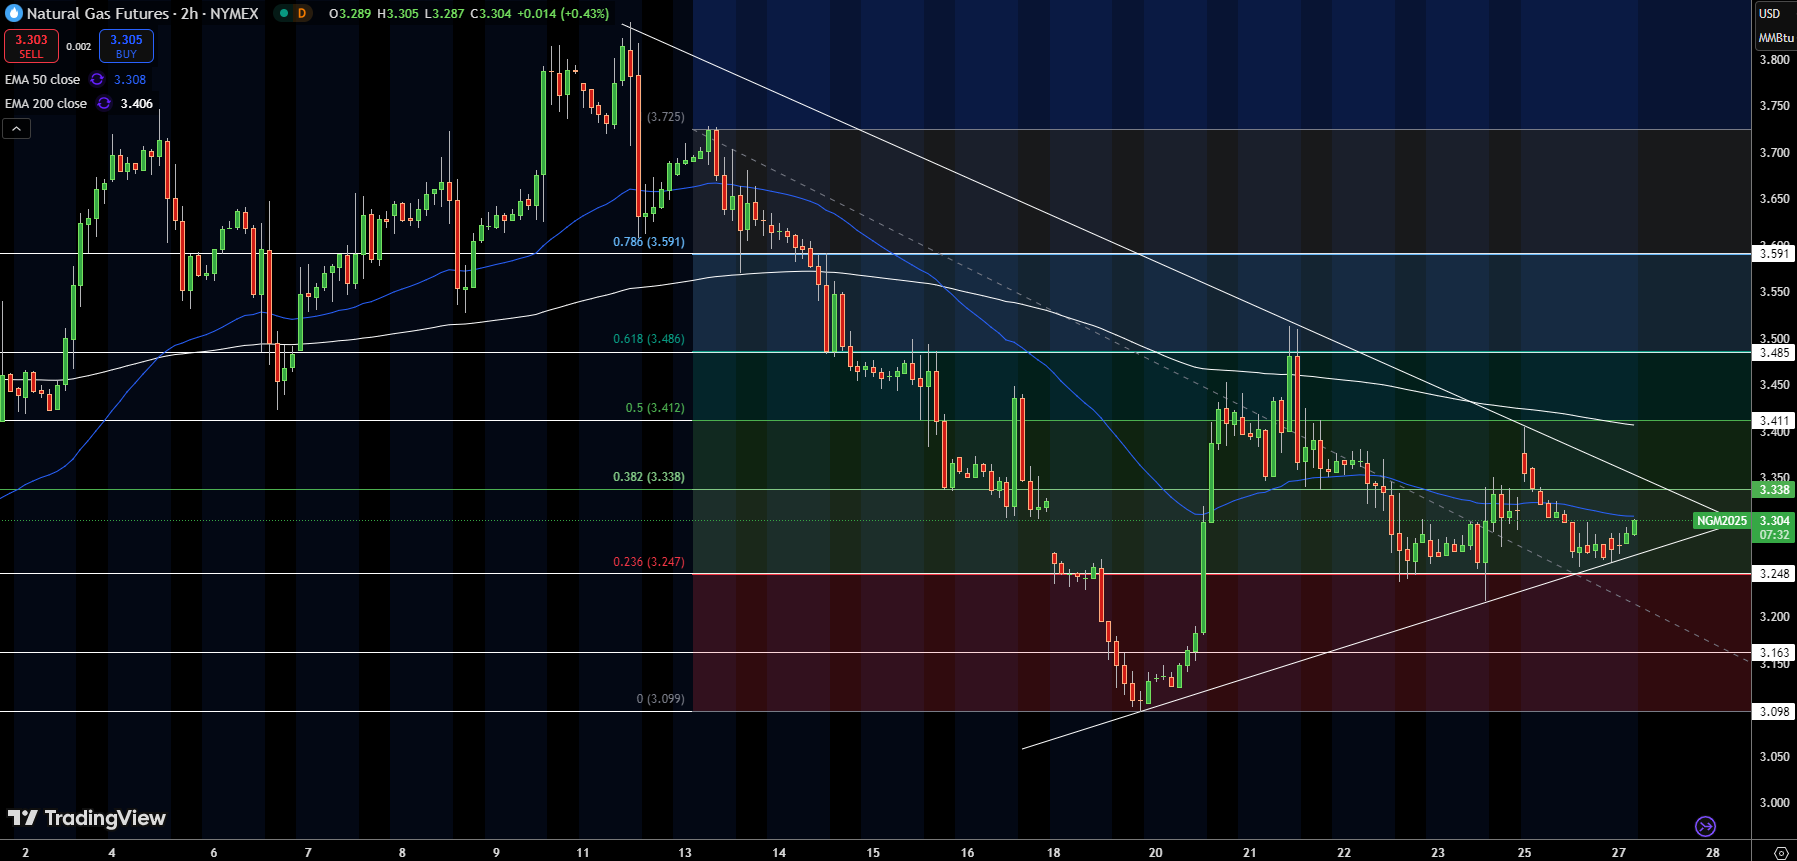
Natural Gas Futures are hovering around $3.30 as prices consolidate beneath a descending trendline. After a sharp dip last week, prices found support at $3.247, with a series of higher lows forming against the backdrop of a broader downtrend.
Resistance levels are pressing down near $3.338 and $3.411, with the price trading just above the 50-period EMA ($3.308) but below the 200-period EMA ($3.406), signaling a potential squeeze. Candlestick action shows a mix of small-bodied candles with indecisive wicks, highlighting market hesitancy.
A break above $3.338 could target $3.485, but failure to hold current support might lead to a retest of $3.248 or even $3.163. Traders should await confirmation from trendline breaks or decisive candlestick formations.
WTI Oil Price Forecast
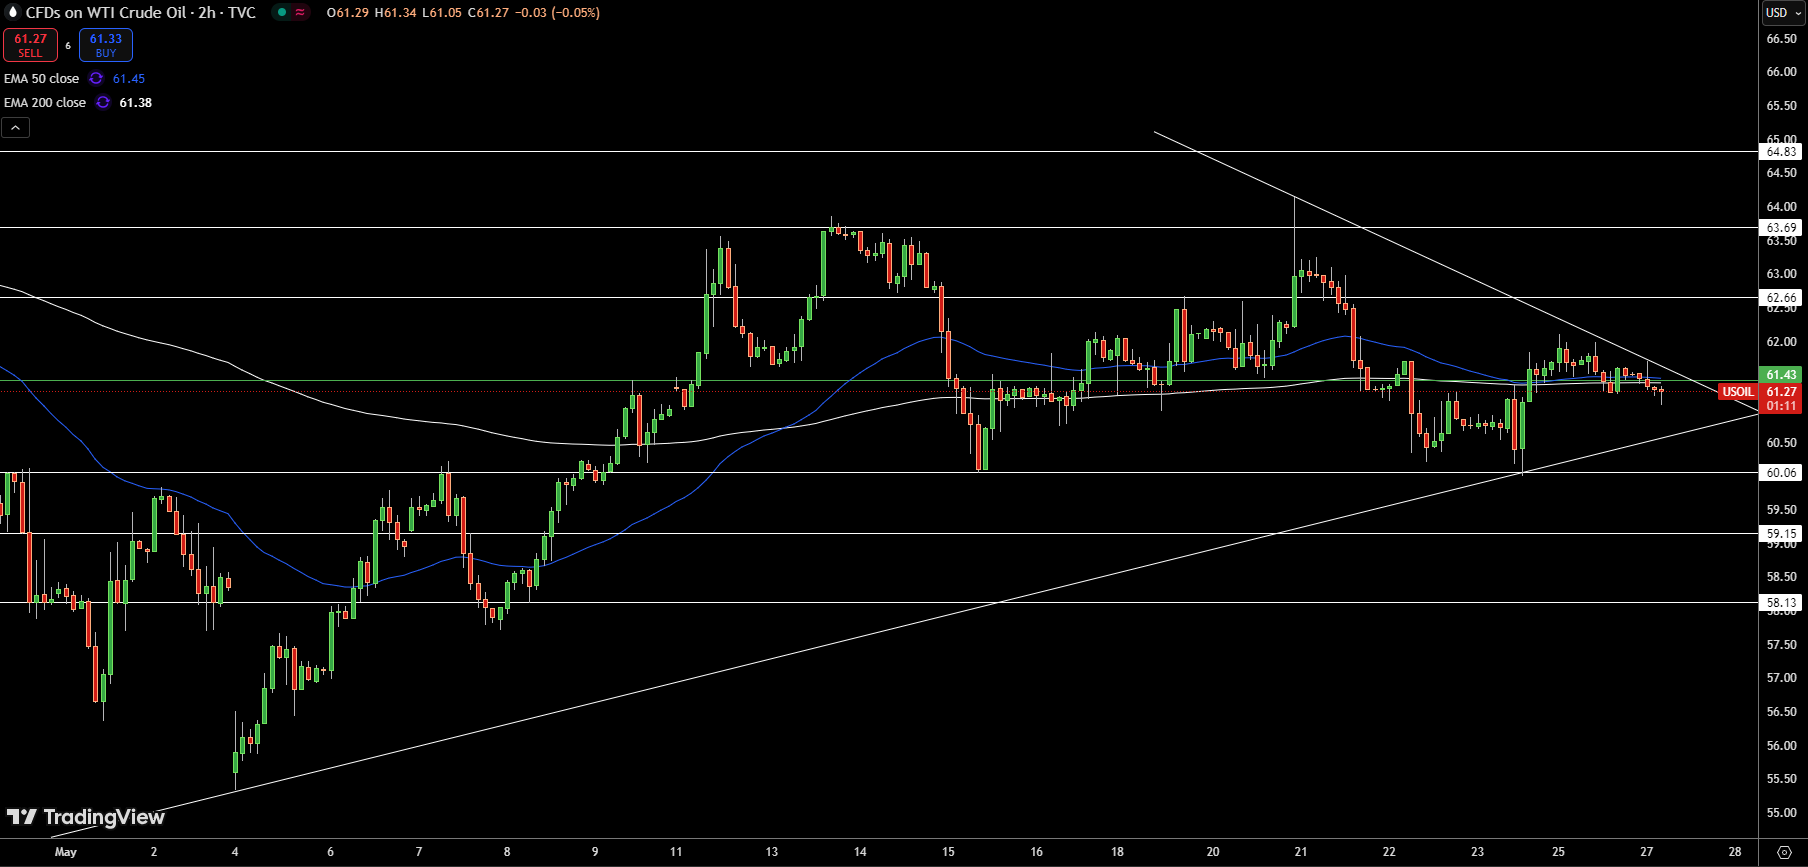
WTI crude oil is hovering near $61.27, navigating a narrow range between resistance and support levels. The 50-period EMA at $61.45 and the 200-period EMA at $61.38 are acting as pivotal zones, constraining price movements.
The price has tested a descending trendline multiple times without a clear breakout, reflecting market hesitation. Meanwhile, the ascending trendline, providing support from earlier lows, intersects around $60.06. If this support fails, the market could test lower levels near $59.15 or $58.13.
Candlestick patterns are mixed, showing limited directional commitment. For traders, it’s wise to monitor for a clean breakout or breakdown before committing to a directional stance.
Brent Oil Price Forecast
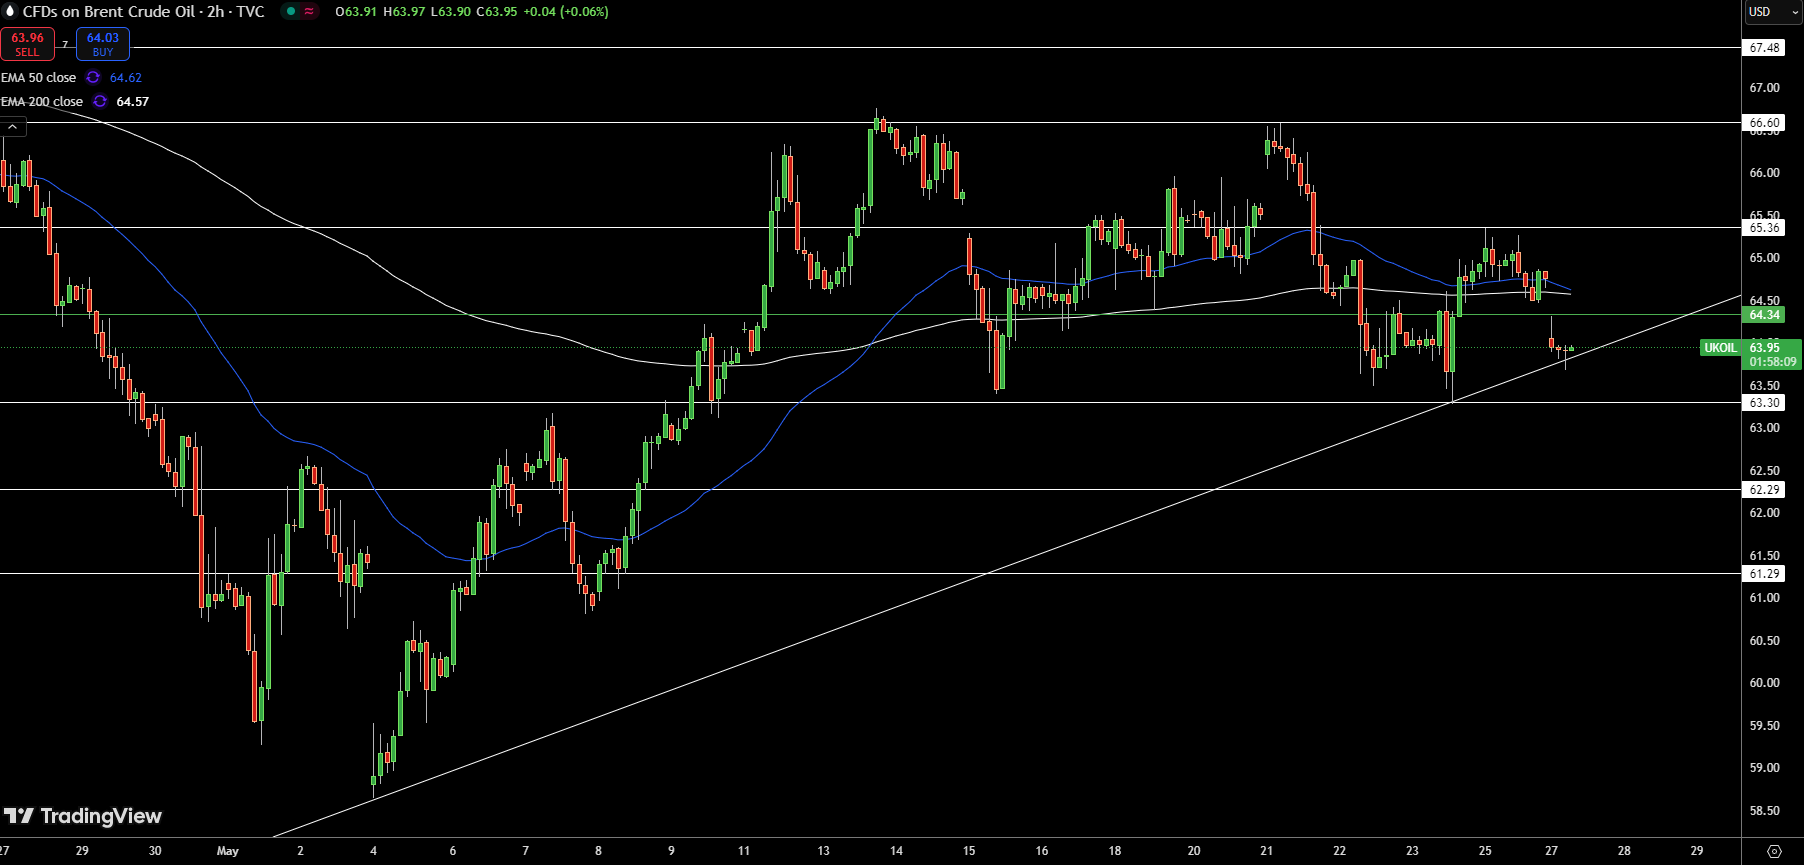
Brent crude oil is hovering near $63.92, testing a key support level just above an ascending trendline. Price action remains constrained between $64.50 resistance and $63.50 support, with the 50-period EMA at $64.62 and the 200-period EMA at $64.57 acting as dynamic resistance.
The market structure shows a descending triangle forming, with lower highs squeezing price action into a tightening range. Candlestick formations reveal indecision, featuring small-bodied candles with long wicks near critical levels.
A decisive break below the trendline support around $63.50 could open the path to $62.29 or lower. Conversely, a breakout above $64.50 could revive upward momentum, targeting $65.36 and beyond.
About the Author
Bob MasonChief Crypto Boss
123456789 30 He has written extensively for a broader audience and his current focus is on developments relating to the financial markets including, but not limited to currencies, commodities, alternative asset classes, and global equities.


Advertisement