
Advertisement
Advertisement
Natural Gas and Oil Forecast: Brent Tests 50% Fib While Traders Eye Hormuz Risks
By:
Key Points:
- Oil prices surged $10 in 3 days, hitting five-month highs as geopolitical tensions sparked supply disruption fears.
- Brent and WTI posted their largest intraday gains since 2022, with Brent testing the key 50% Fibonacci level at $73.36.
- Nearly 20M barrels per day pass through the Strait of Hormuz, raising alarm over potential energy flow interruptions.

Market Overview
Oil prices soared more than $4 per barrel Friday, extending a three-day rally to $10, as rising geopolitical tensions fueled fears of supply disruptions. Brent crude and WTI posted their sharpest intraday gains since 2022, reaching five-month highs.
Analysts flagged potential risks to critical shipping lanes, especially the Strait of Hormuz, through which nearly 20 million barrels per day, about 20% of global demand, transit.
While no physical disruption has yet occurred, traders remain cautious, with concerns that broader regional escalation could impact oil and gas flows. Safe-haven assets, such as gold and the Swiss franc, also rallied amid global market uncertainty.
Natural Gas Price Forecast
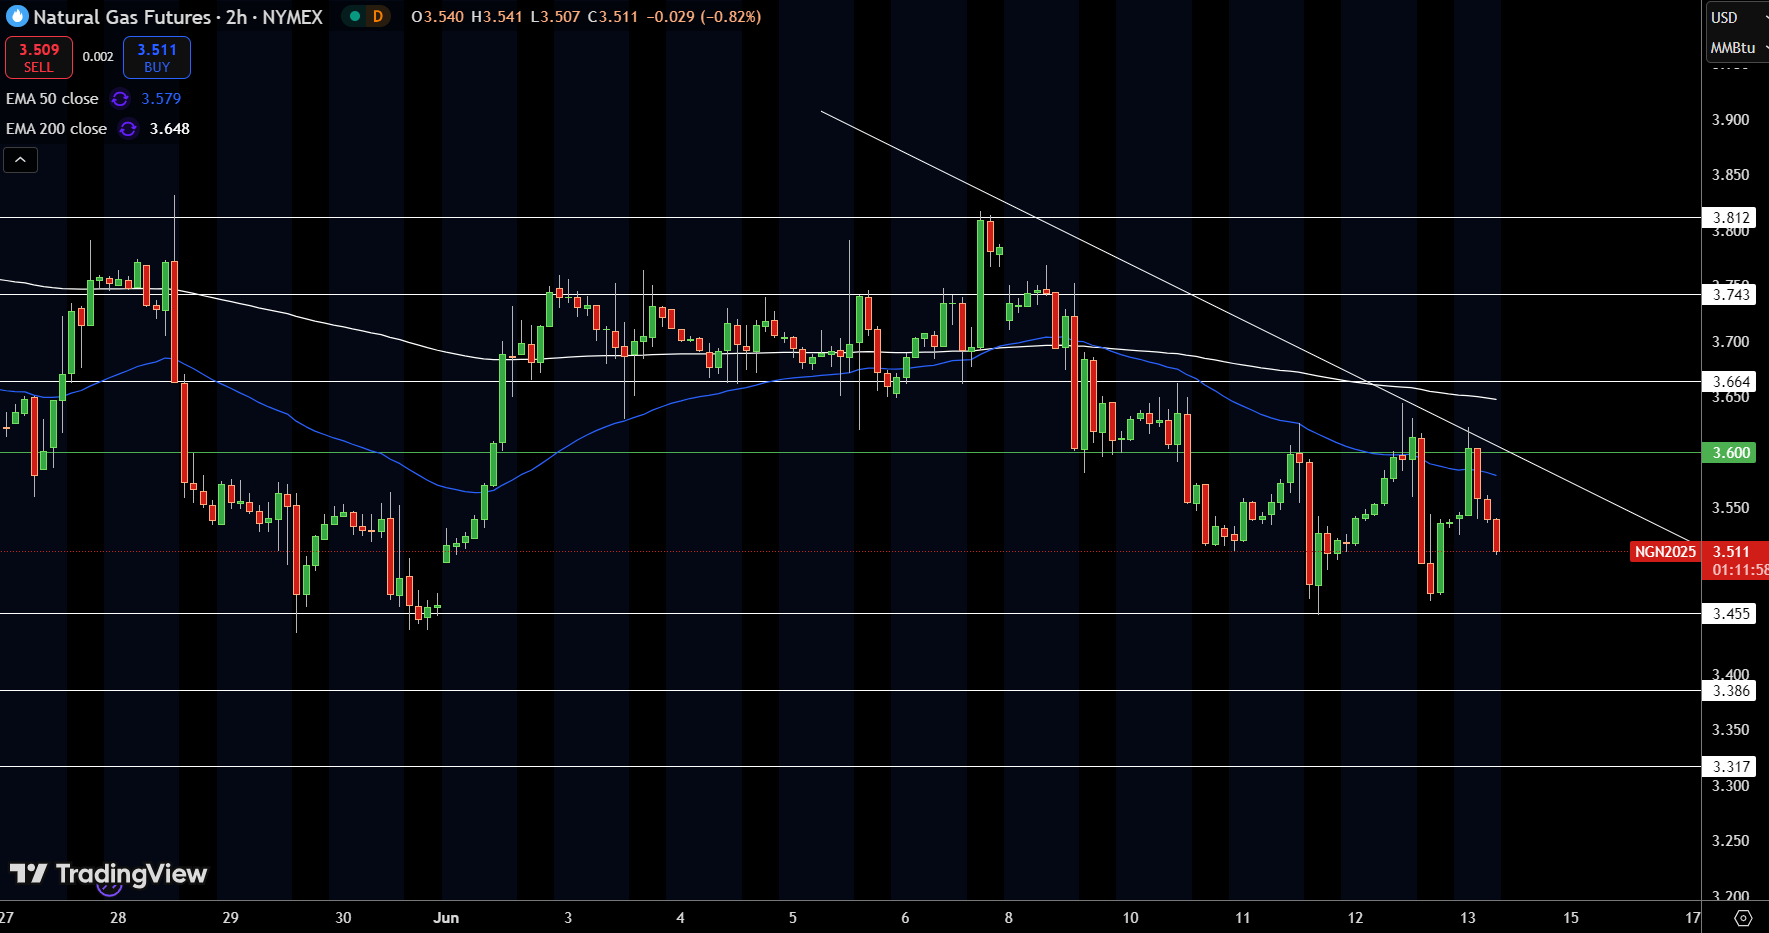
Natural gas futures are struggling to maintain upward momentum, trading near $3.511 after a failed breakout attempt above $3.60. The price remains constrained below the descending trendline and both the 50 EMA ($3.579) and 200 EMA ($3.648), reinforcing bearish pressure.
Multiple rejections near the $3.60 level and sustained lower highs suggest sellers are defending resistance zones. If $3.507 support breaks, the next downside levels lie at $3.455 and $3.386. To shift the short-term bias, bulls need a close above $3.664.
Until then, the structure remains vulnerable to further weakness, with the path of least resistance tilted lower.
WTI Oil Price Forecast
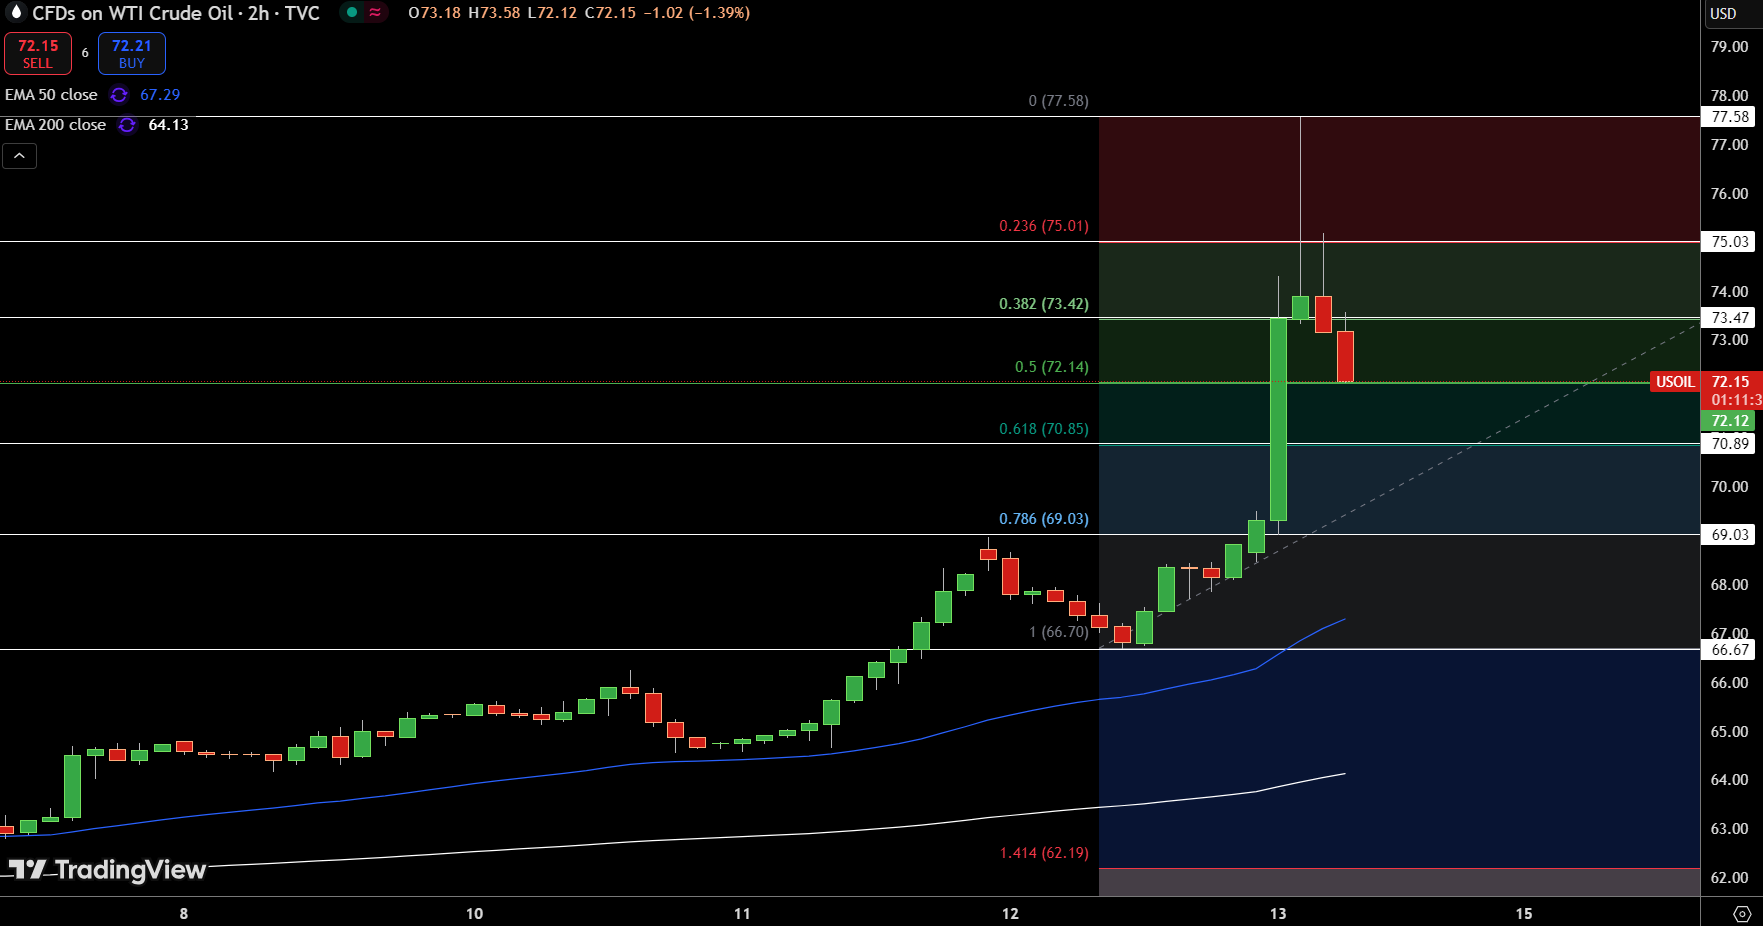
WTI crude oil is retracing after briefly touching $73.58, now testing the 50% Fibonacci retracement level at $72.14. The move follows a steep rally from $66.70, which had pushed prices above key EMAs—50 EMA at $67.29 and 200 EMA at $64.13—confirming underlying bullish momentum.
However, the recent red candle indicates waning short-term strength. If $72 fails to hold, the next support lies at the 61.8% Fib near $70.85, with deeper pullback risk toward $69.03.
On the upside, a rebound above $73.42 could reexpose $75.01. No bullish reversal signal has formed yet, and with volatility elevated, price action near the 50% retracement will be critical in determining the next move.
Brent Oil Price Forecast
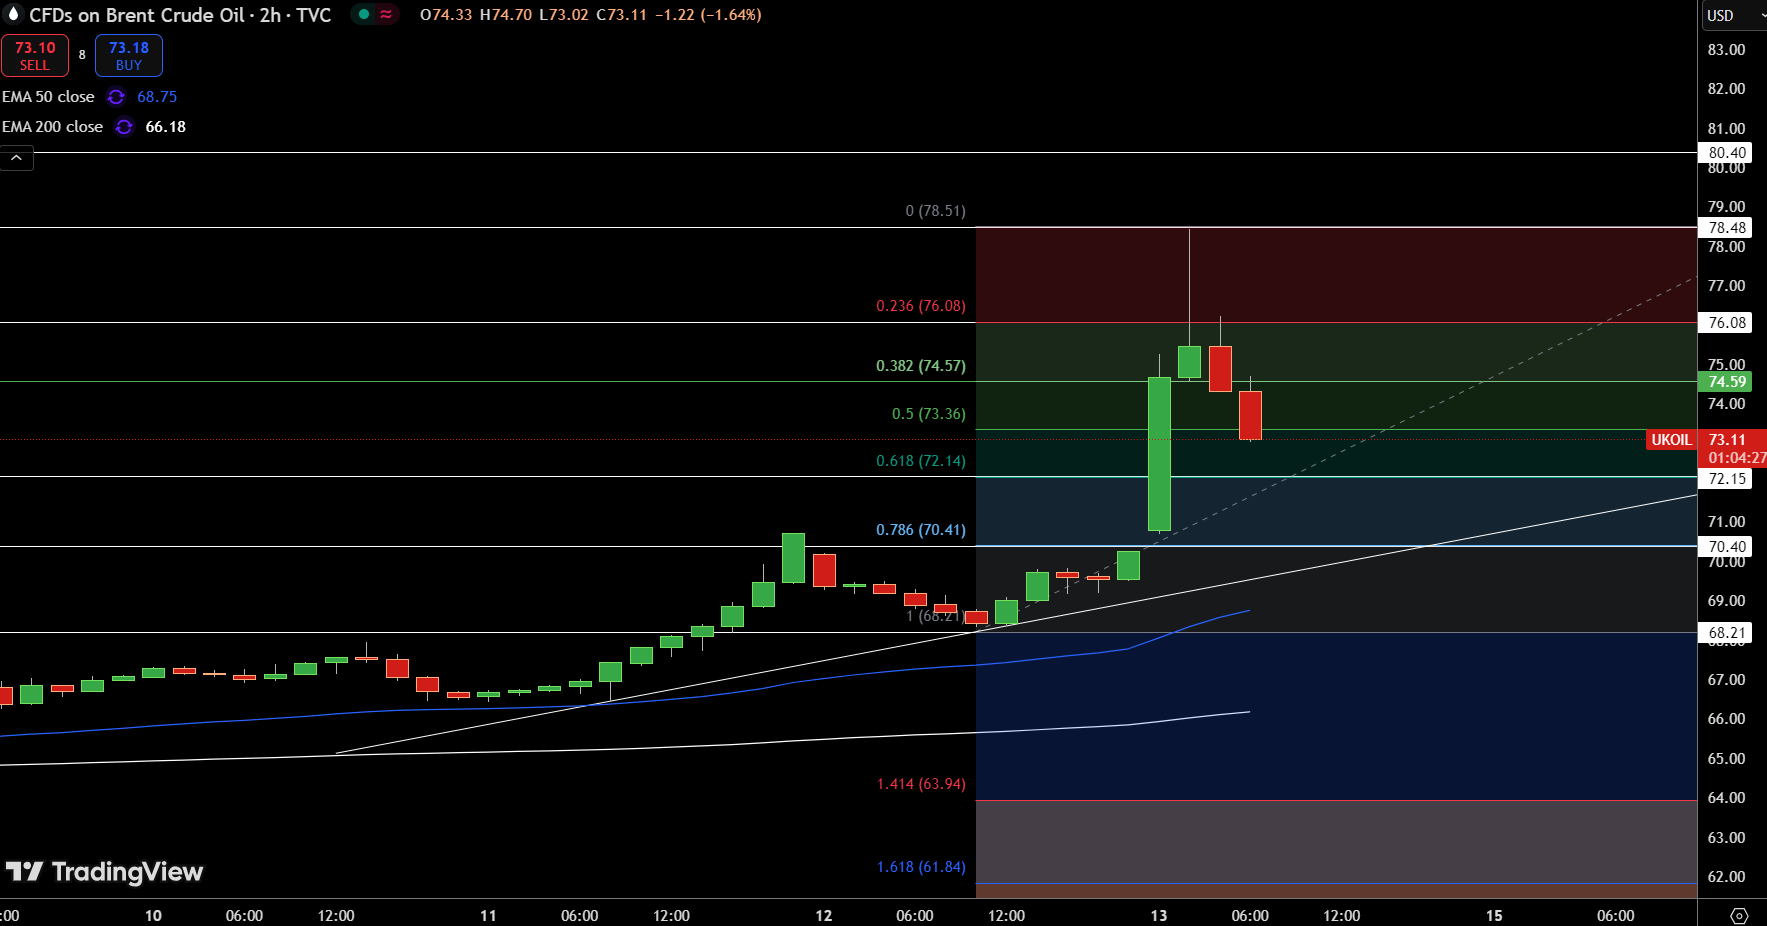
Brent crude has pulled back to $73.13 after reaching a high of $74.70, with price now testing the 50% Fibonacci retracement at $73.36. The decline follows a sharp rally from $66.21, with bullish momentum starting to ease as candles shrink and selling pressure builds near the 38.2% Fib level at $74.57.
Support lies at the 61.8% retracement at $72.14, aligned with the 50 EMA at $68.75, both critical to maintaining the broader uptrend.
A break below $72 would indicate deeper corrective potential, while a recovery above $74.57 could re-target $76.08. For now, short-term sentiment has shifted neutral with key levels under test.
About the Author
Bob MasonChief Crypto Boss
123456789 30 He has written extensively for a broader audience and his current focus is on developments relating to the financial markets including, but not limited to currencies, commodities, alternative asset classes, and global equities.


Advertisement