
Advertisement
Advertisement
Natural Gas and Oil Forecast: Crude Rebounds as Supply Worries Offset Ceasefire
By:
Key Points:
- WTI crude oil climbs above $65 as supply fears mount despite ceasefire and shrinking U.S. inventories.
- Natural gas struggles near $3.55 with bearish crossover at major EMAs, bias remains tilted to the downside.
- U.S. crude stockpiles drop 4.28 million barrels, far exceeding expectations and raising supply risk concerns.

Market Overview
WTI crude oil futures rebounded above $65 per barrel on Wednesday, recouping part of last week’s steep losses amid renewed geopolitical tensions. Market jitters resurfaced following reports that recent strikes on key energy infrastructure may have only short-term effects, stoking fears of prolonged instability.
Despite a fragile ceasefire, volatility remains high. Meanwhile, U.S. crude inventories plunged by 4.28 million barrels, well beyond forecasts of a 0.6 million-barrel drop, marking the fourth straight weekly decline.
While the IEA holds 1.2 billion barrels in emergency reserves, growing supply concerns persist as OPEC+ output lags demand, keeping traders on alert for further price swings.
Natural Gas Price Forecast
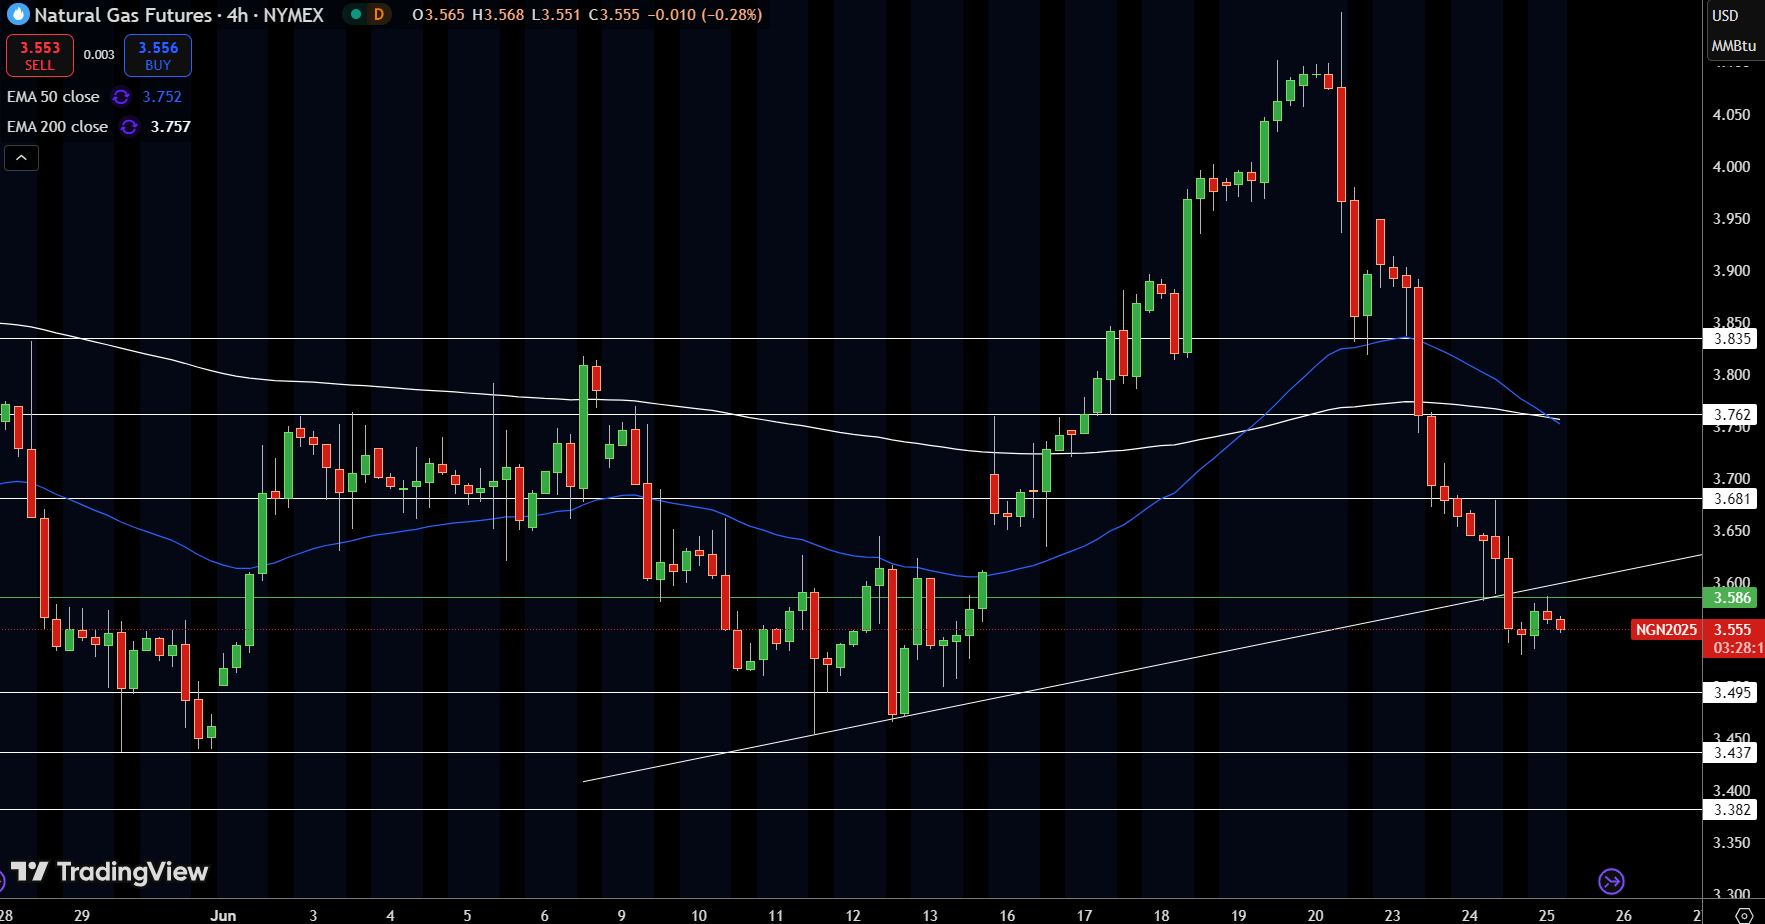
Natural Gas futures (NGN2025) are struggling to hold ground near $3.55 after a sharp retracement from the $4.10 region. Price recently tested ascending trendline support drawn from early June, but the bounce was weak, failing to reclaim the $3.586 pivot.
Both the 50-EMA and 200-EMA, positioned near $3.75, now act as major resistance barriers after a clear bearish crossover. The structure remains fragile as the market consolidates just above $3.50. A breakdown below $3.495 could expose further downside toward $3.43.
On the flip side, buyers will need a strong candle close above $3.586 to suggest any real momentum shift. Until then, the bias leans cautiously bearish with trendline pressure building.
WTI Oil Price Forecast
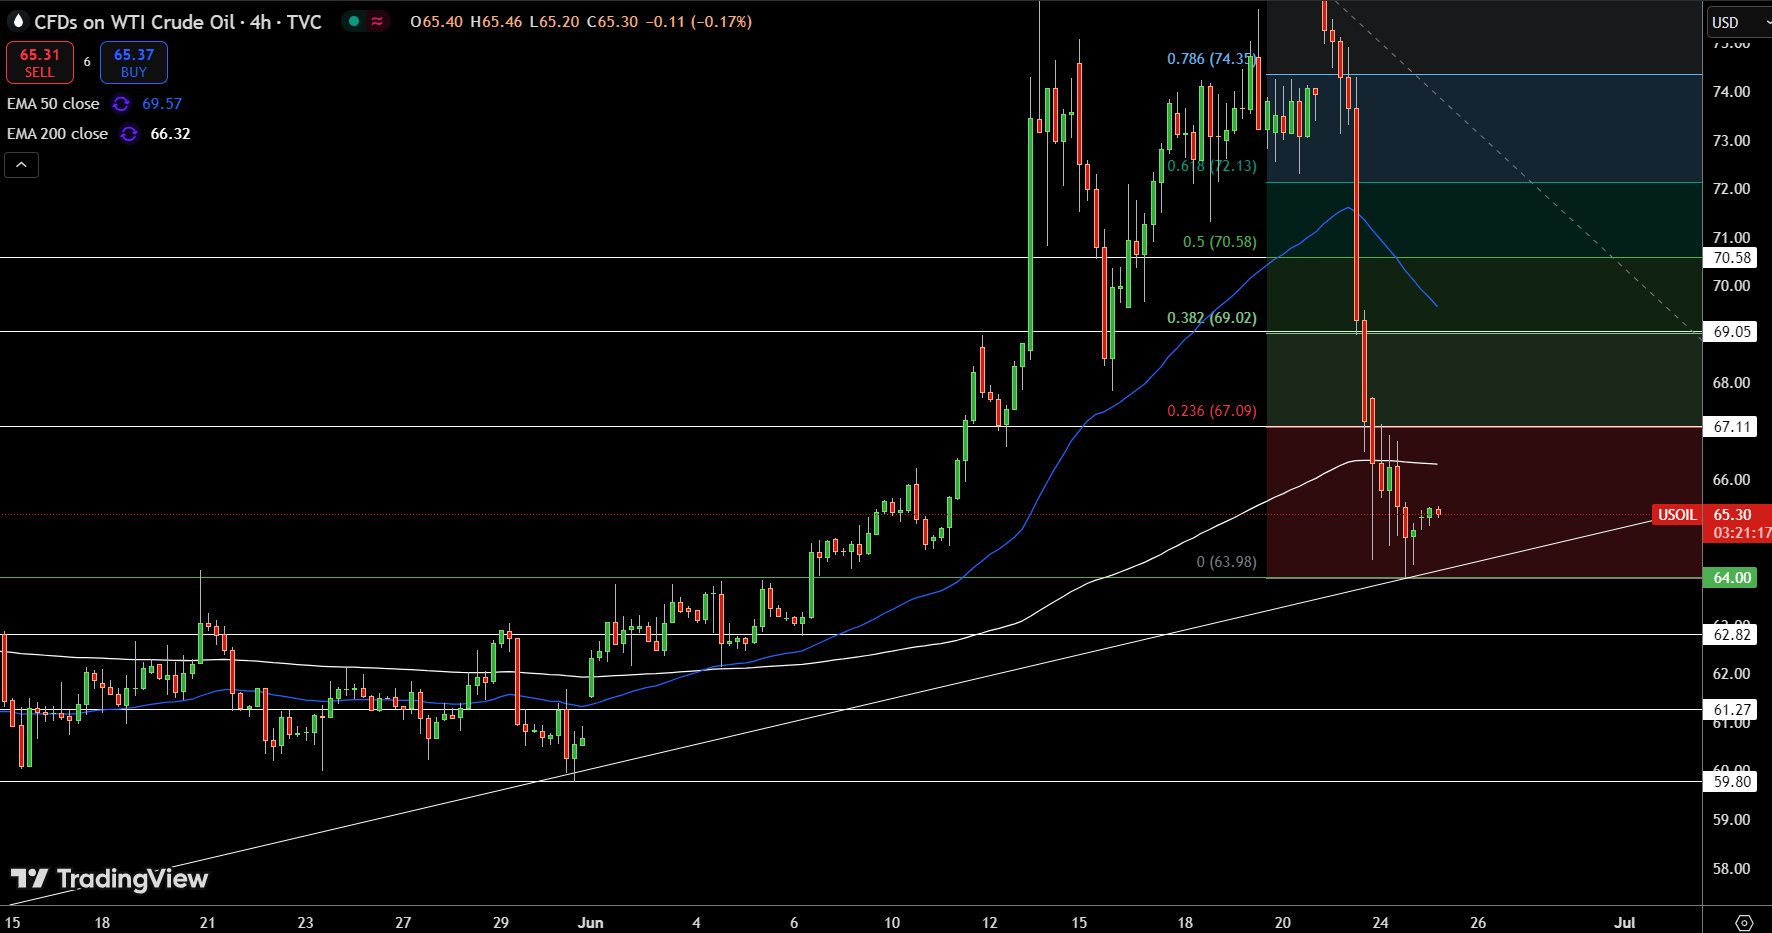
WTI Crude Oil (USOIL) continues to consolidate below the 200-period EMA near $66.32 after last week’s steep $12 selloff from the $77.11 high. Price has found temporary support around $64.00, aligning with an ascending trendline that has held since mid-May.
Despite a minor intraday recovery, the broader structure remains vulnerable unless $67.11, the 23.6% Fibonacci retracement, is reclaimed. The 50-EMA at $69.57 is now a dynamic resistance zone. Recent candles show reduced body size and tight range, suggesting indecision but no meaningful reversal yet.
If price breaks below $64.00, further losses toward $62.82 and $61.27 may unfold. Bulls will need a strong impulsive move above $67 to shift momentum back in their favor.
Brent Oil Price Forecast
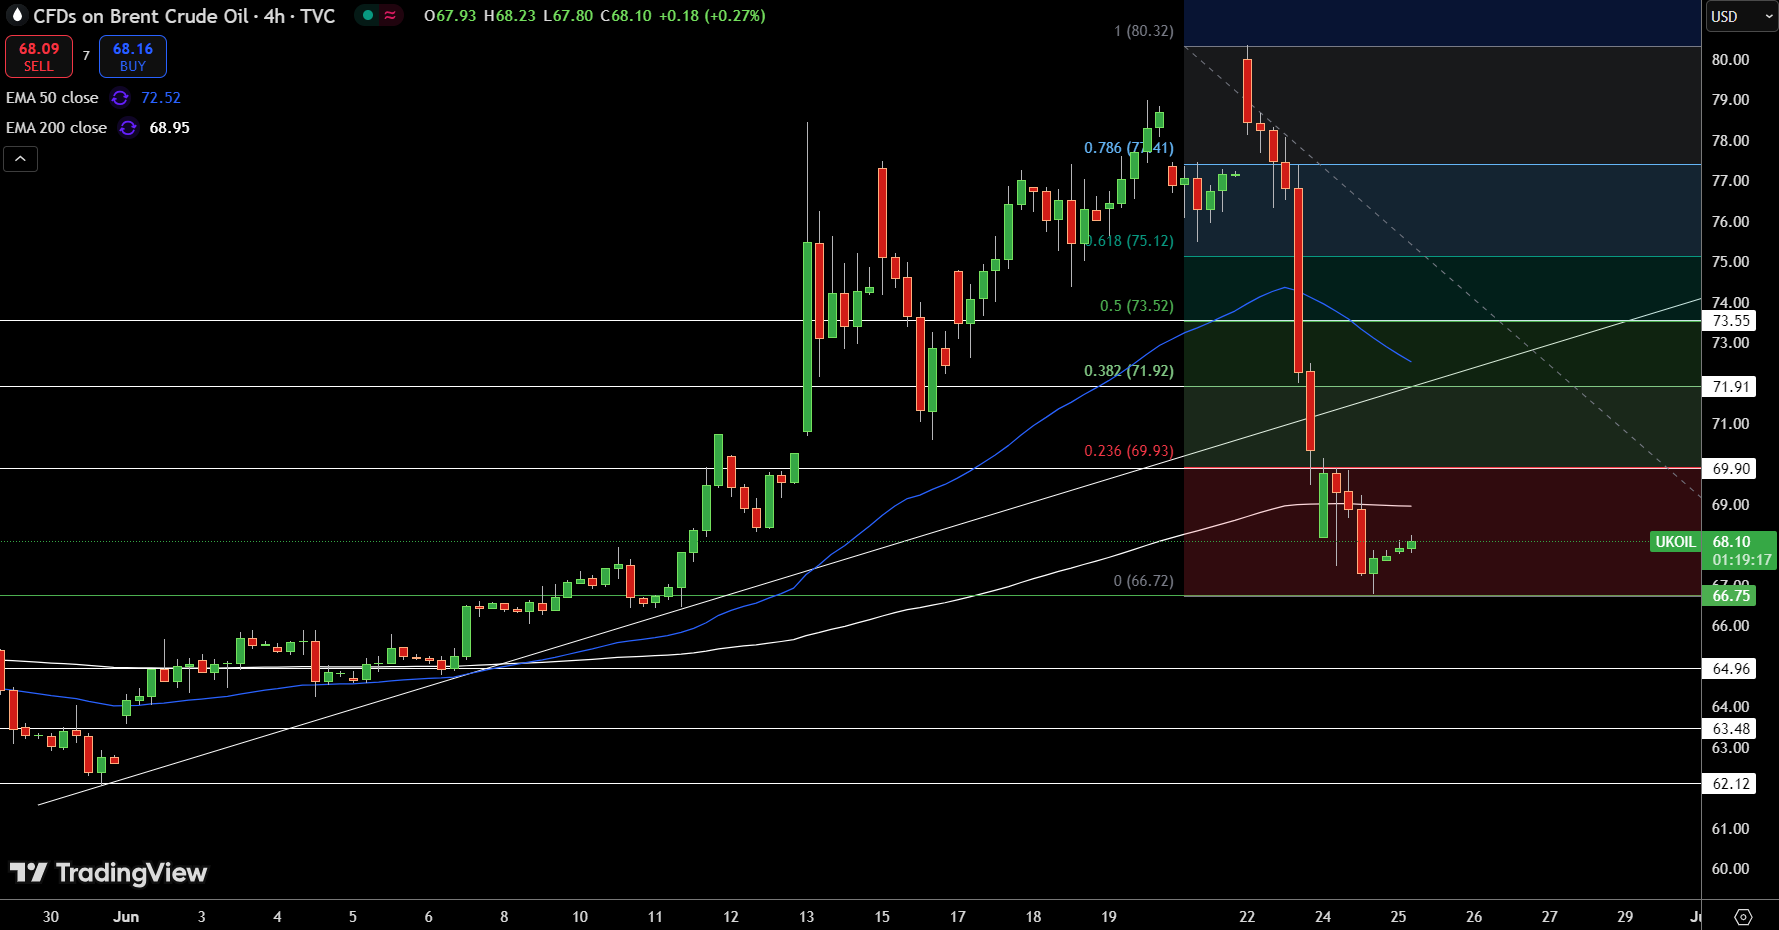
Brent Crude Oil (UKOIL) is stabilizing near $68.10 following a sharp drop from the $80.32 high. Price action has paused just above the 0% Fibonacci retracement level ($66.72), with recent candles printing small-bodied indecision near the 200-EMA at $68.95.
This suggests a temporary halt in bearish momentum, though upside conviction remains weak. The broader trend is under pressure, with the 50-EMA at $72.52 now acting as a significant ceiling. A close above $69.90 would be the first sign of recovery, aligning with the 23.6% Fib level.
Until then, Brent remains vulnerable to further losses, with a clean break below $66.72 potentially exposing $64.96 and lower. Bulls will need a strong bullish candle to confirm a rebound.
About the Author
Bob MasonChief Crypto Boss
123456789 30 He has written extensively for a broader audience and his current focus is on developments relating to the financial markets including, but not limited to currencies, commodities, alternative asset classes, and global equities.


Advertisement