
Advertisement
Advertisement
Natural Gas and Oil Forecast: Geopolitical Fears Push Oil Higher While NG Struggles Below EMA
By:
Key Points:
- Geopolitical tensions fuel upward pressure on oil prices, while supply constraints weigh on market sentiment.
- Brent and WTI crude rose 0.5% as traders eyed Middle Eastern supply concerns and cautious OPEC+ moves.
- U.S. rig counts dropped by eight to 465, marking the lowest level since November 2021 amid price uncertainty.

Market Overview
Oil and gas markets are navigating a delicate balance, buoyed by geopolitical tensions that are pushing prices upward while supply-side dynamics temper the rally. Brent and WTI crude rose 0.5% on Friday as energy traders reacted to renewed geopolitical strains and reduced expectations for a swift return of Middle Eastern oil.
Meanwhile, U.S. rig counts fell by eight to 465 last week, the lowest since November 2021, reflecting caution among producers facing lower prices.
However, OPEC+ is poised to lift output by 411,000 barrels per day for July, adding pressure to already stretched supply chains. Natural gas markets echo this tension, with output cuts counterbalanced by geopolitical risks.
Natural Gas Price Forecast
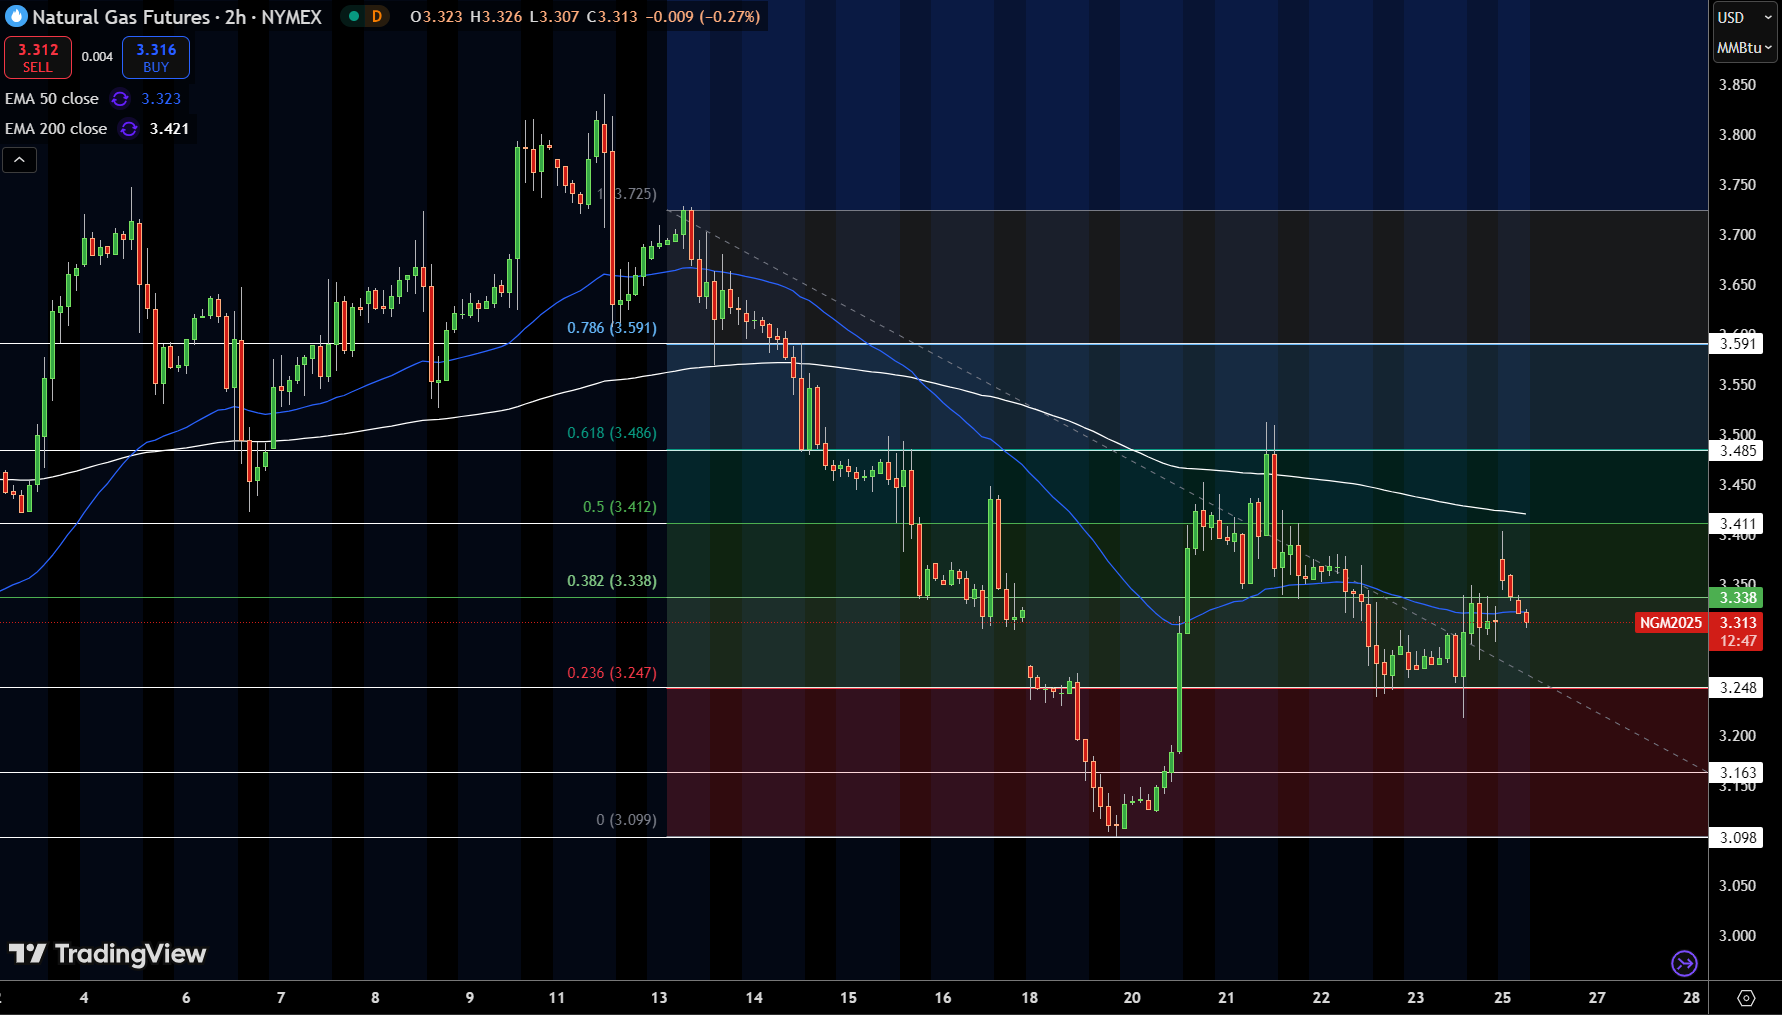
Natural Gas (NGM2025) is hovering at $3.313, down 0.27%, with momentum flagging. On the 2-hour chart, price action remains trapped between the 50-period EMA at $3.323 and the 200-period EMA at $3.421.
The Fibonacci retracement highlights $3.338 (38.2%) as a key pivot, while $3.247 (23.6%) offers a soft support below. Recent candles form small-bodied patterns like spinning tops, showing indecision.
A clear break above $3.411 (50% Fib) with confirmation, such as a bullish engulfing or three white soldiers pattern, could signal a move towards $3.486 or even $3.591. However, a drop below $3.247 might see prices revisit $3.163 or $3.099.
WTI Oil Price Forecast
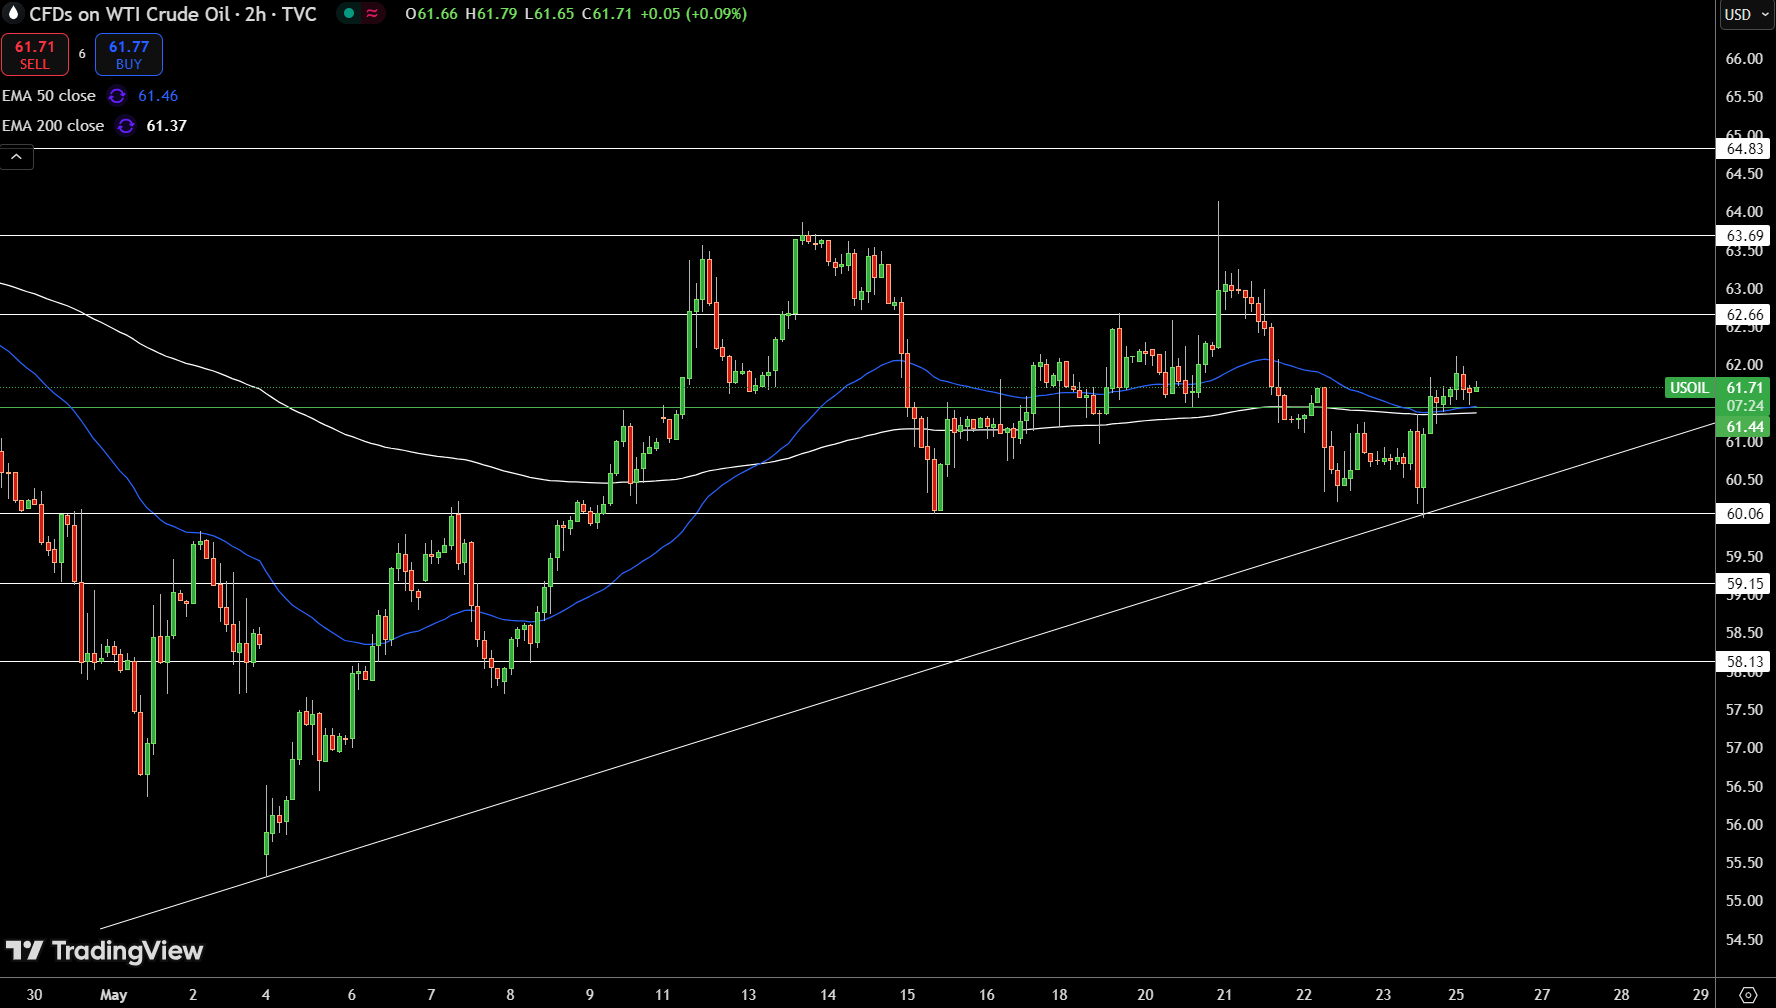
WTI Crude Oil (USOIL) is hovering at $61.71, nudging against the 50-period EMA at $61.46, while the 200 EMA at $61.37 offers further support. The price action hints at resilience, with higher lows traced along a rising trendline.
Small-bodied candles, including doji and spinning tops, signal market hesitation. Key resistance looms at $62.66, and a breakout confirmed by bullish engulfing patterns or three white soldiers could ignite momentum toward $63.69.
However, a dip below $61.46 may invite tests of $60.06 or even $59.15. For traders, patience is crucial; wait for clear signals and avoid overreacting to initial price moves.
Brent Oil Price Forecast
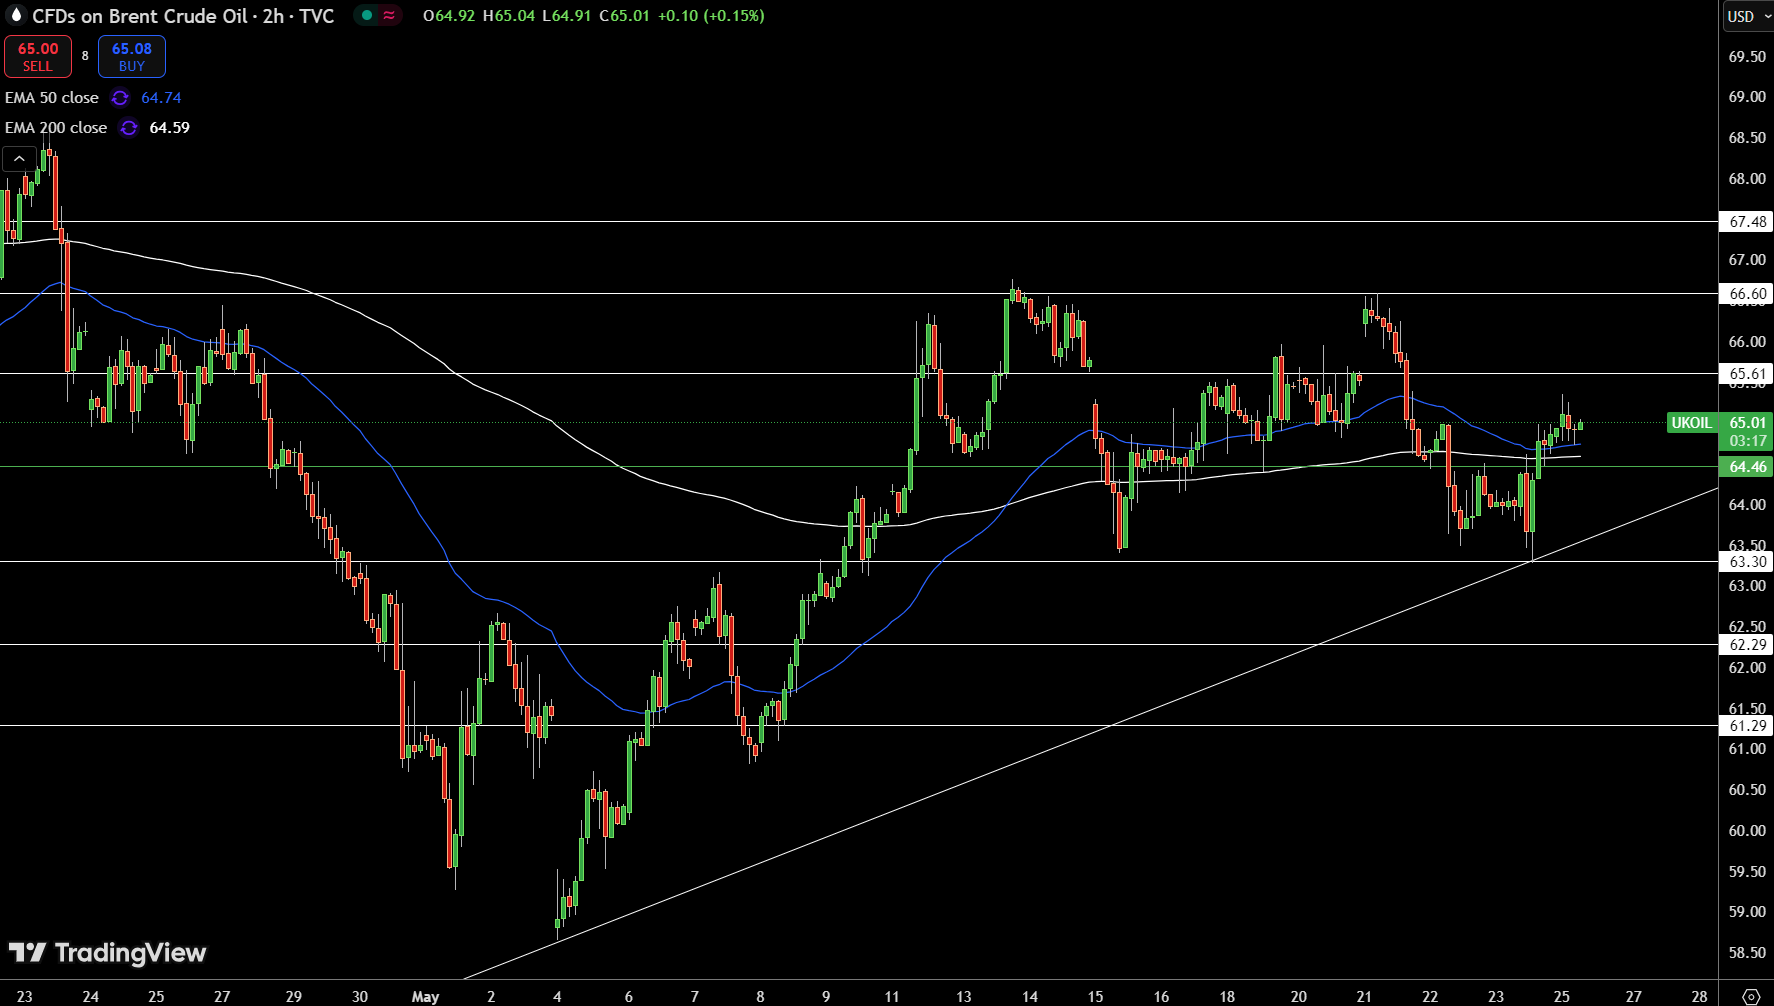
Brent Crude (UKOIL) is consolidating at $64.99, with a slight lift of 0.12% on the day. The 2-hour chart reveals price action wedged between the 50-period EMA ($64.74) and the 200-period EMA ($64.59), reinforcing a neutral bias. Candlestick formations near $64.46 suggest indecision, while the upward-sloping trendline from previous lows strengthens support at this level.
A breakout above $65.61 could fuel a move toward $66.60 or $67.48, with confirmation from patterns like bullish engulfing or three white soldiers.
Conversely, a break below $64.46 could see prices dip to $63.30 or even $62.29. Stay patient—watch for clear technical signals before entering trades.
About the Author
Bob MasonChief Crypto Boss
123456789 30 He has written extensively for a broader audience and his current focus is on developments relating to the financial markets including, but not limited to currencies, commodities, alternative asset classes, and global equities.


Advertisement