
Advertisement
Advertisement
Natural Gas and Oil Forecast: Geopolitical Risks vs. Supply Levels – Upside Ahead?
By:
Key Points:
- Geopolitical tensions in the Middle East create uncertainty for natural gas and oil markets, risking supply disruptions.
- Oil prices edged higher as fears of supply issues clash with rising U.S. crude inventories, tempering the bullish outlook.
- Natural gas consolidates near $2.93, reflecting market indecision; a break above $2.95 could lead to a potential rally.

In this article:
Market Overview
Oil prices increased on Thursday as geopolitical tensions in the Middle East sparked concerns over potential supply disruptions. While fears of escalating hostilities boosted prices, an unexpected rise in U.S. crude inventories by 3.9 million barrels eased upward pressure, signalling that the global market remains well-supplied.
This inventory build, combined with OPEC’s spare production capacity, has tempered worries about immediate shortages.
Natural gas and oil prices may continue to fluctuate due to the uncertain geopolitical landscape, but current supply levels should prevent a dramatic price surge unless the situation deteriorates further.
Natural Gas Price Forecast
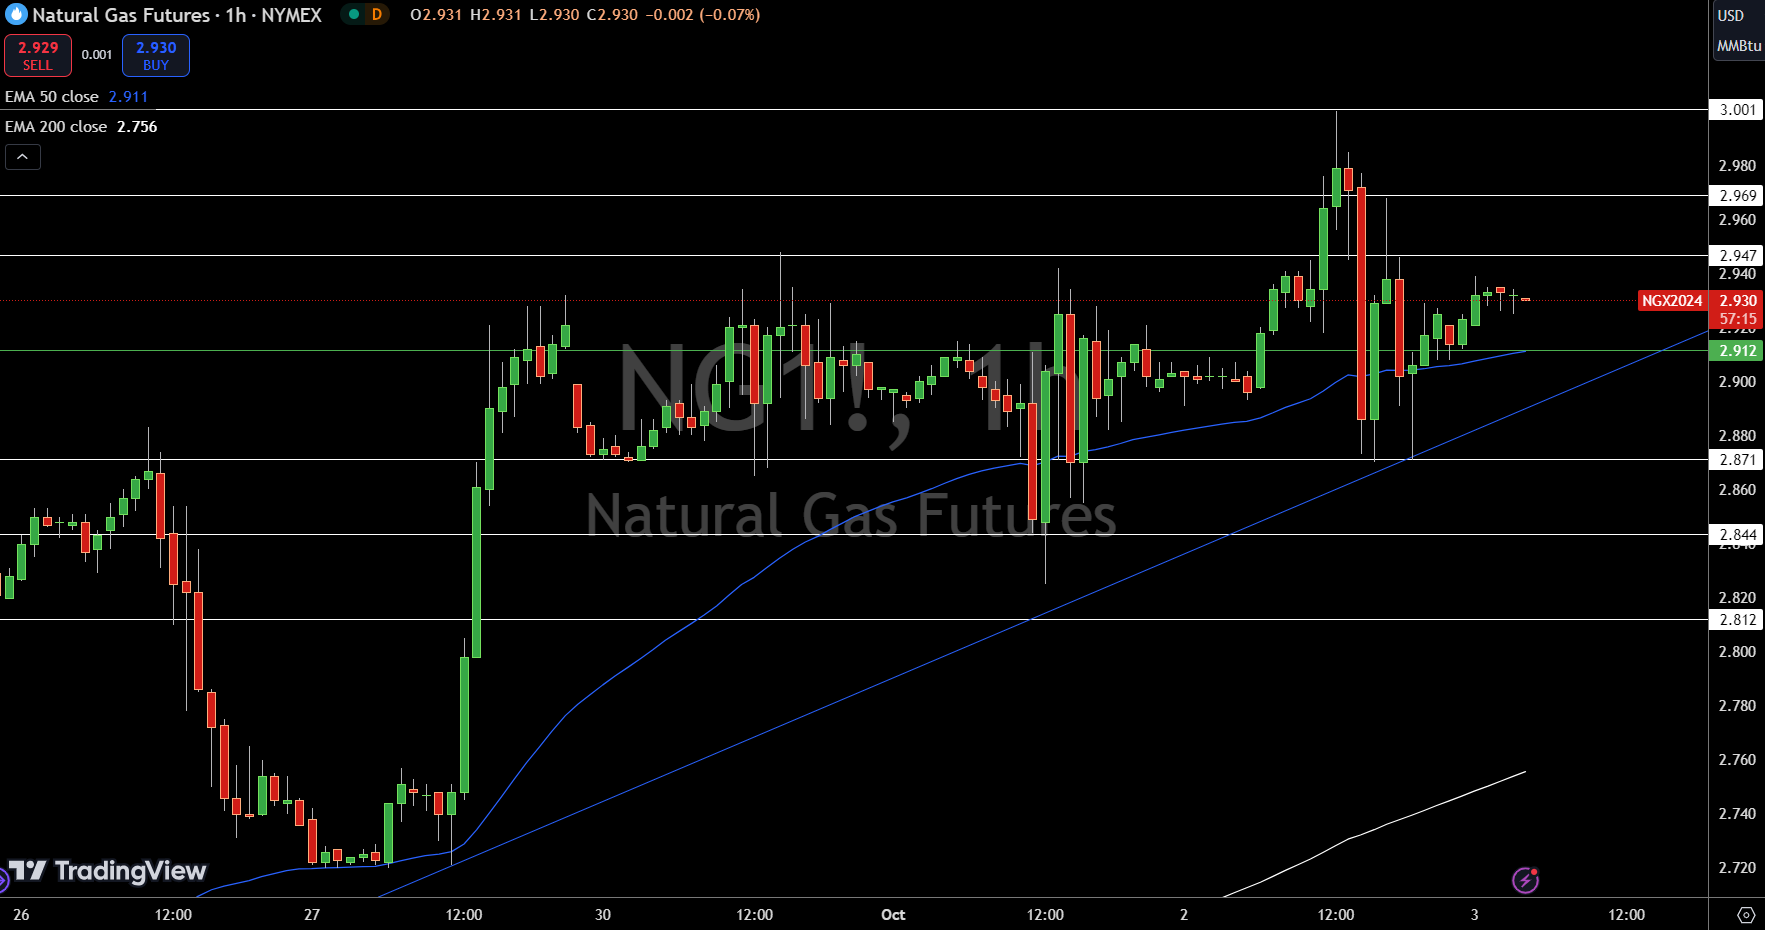
Natural Gas (NG) is trading at $2.93, up 0.30% for the session, hovering near its pivot point at $2.91. The price has been consolidating around this level, indicating indecision in the market as traders await a clearer direction. The formation of recent Doji and spinning top candles further reflects this uncertainty.
If NG manages to break above the immediate resistance at $2.95, it could pave the way for a move toward the next resistance levels at $2.97 and $3.00.
On the downside, if prices slip below $2.91, the market may retest support at $2.87, with further levels at $2.84 and $2.81. The 50-day EMA at $2.91 and the 200-day EMA at $2.76 support this consolidation phase.
WTI Oil Price Forecast
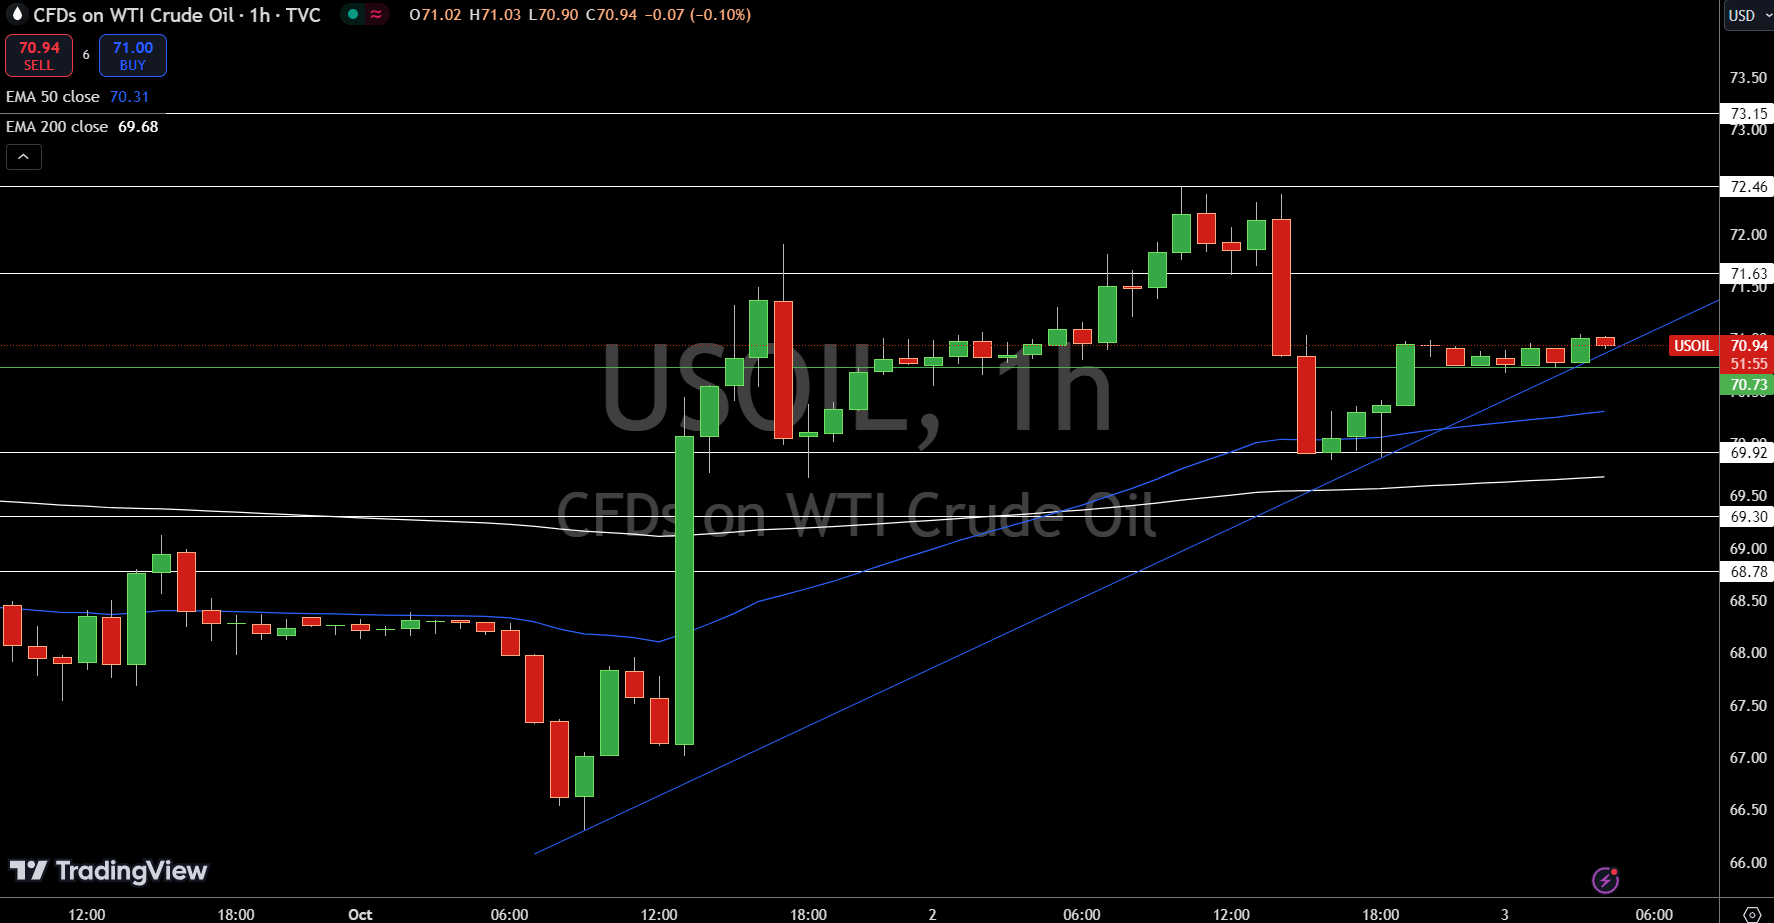
WTI Crude Oil (USOIL) is holding steady at $70.94, just above a key pivot point of $70.73. This level is crucial because it’s acting as a line in the sand between buyers and sellers. If prices stay above $70.73, we could see an upward move towards the first resistance at $71.63, with potential targets at $72.46 and $73.15.
Conversely, slipping below $70.73 may lead to a bearish shift, with immediate support at $69.92 and further downside targets at $69.30 and $68.78. The 50-day EMA at $70.31 and 200-day EMA at $69.68 suggest a moderate uptrend, but a break below $70.73 could prompt sharper selling pressure. Stay alert for a decisive move either way.
Brent Oil Price Forecast
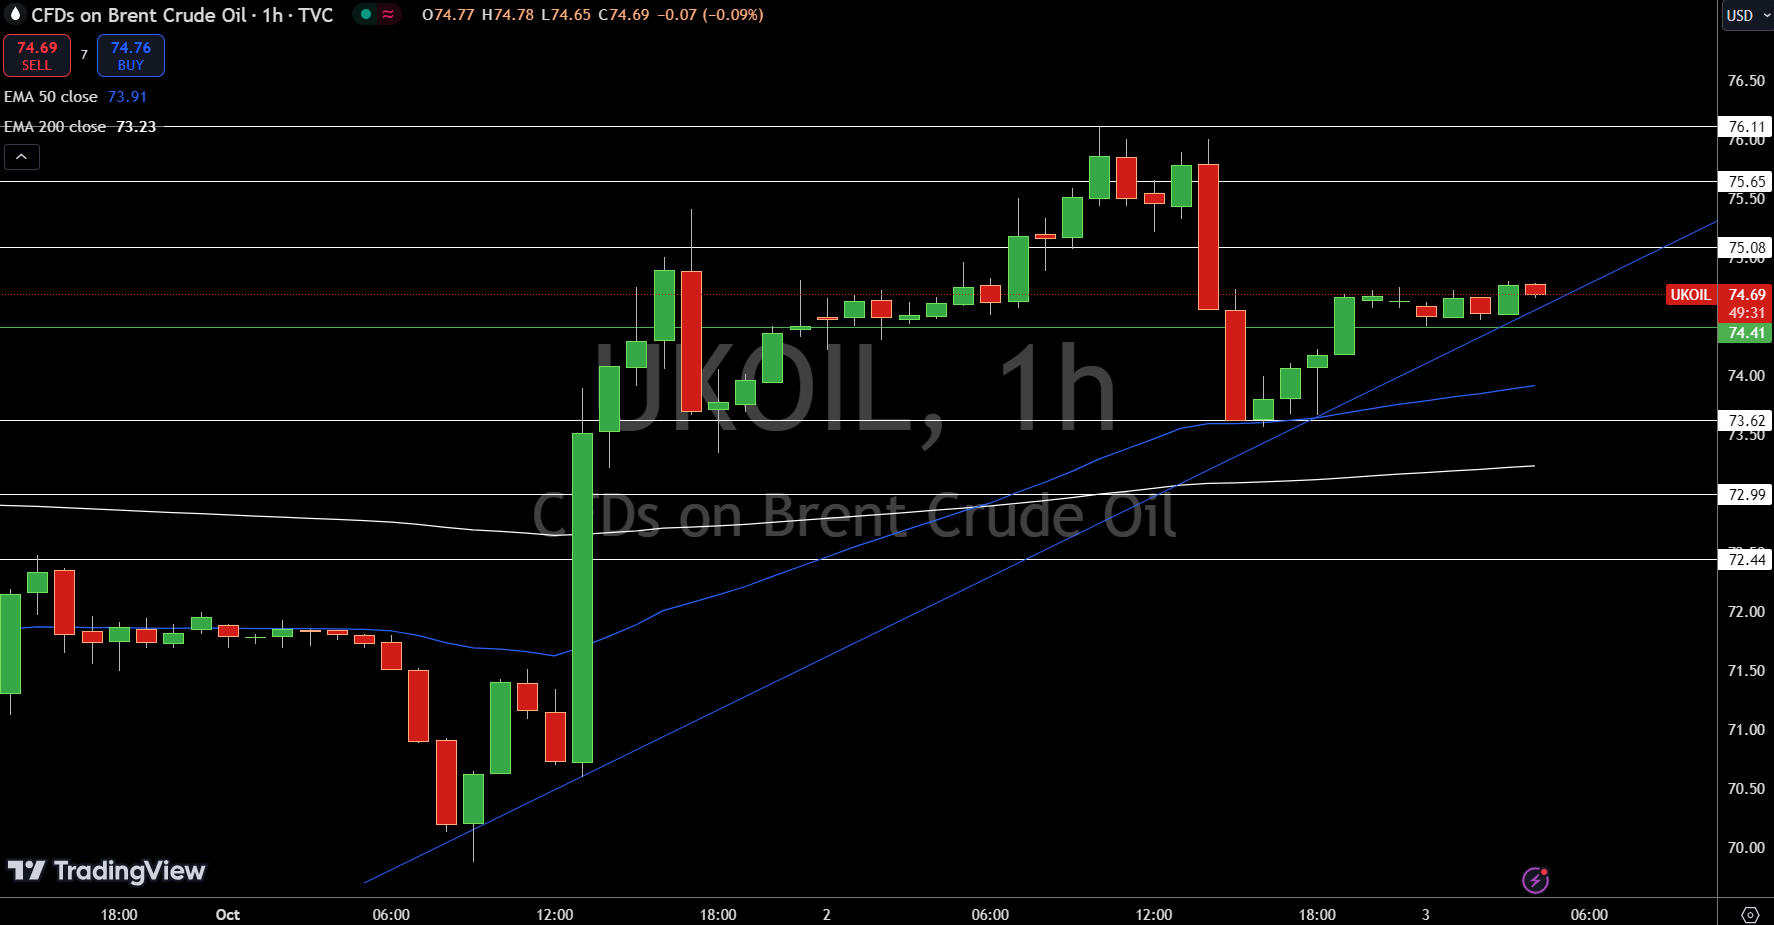
Brent Crude Oil (UKOIL) is trading at $74.69, up slightly by 0.08% and staying above its key pivot point at $74.41. This pivot level is critical, as holding above suggests buyers are still in control. If prices push past the immediate resistance at $75.08, the next targets would be $75.65 and $76.11, where sellers might step in.
However, if UKOIL falls below $74.41, it could open the door for a deeper pullback, with initial support at $73.62 and further levels at $72.99 and $72.44.
The 50-day EMA at $73.91 and the 200-day EMA at $73.23 currently provide a solid base, supporting a potential uptrend in the short term. Keep an eye on these levels for confirmation of direction.
About the Author
Bob MasonChief Crypto Boss
TEST 30 He has written extensively for a broader audience and his current focus is on developments relating to the financial markets including, but not limited to currencies, commodities, alternative asset classes, and global equities.
Latest news and analysis


Advertisement