
Advertisement
Advertisement
Natural Gas and Oil Forecast: Geopolitical Tensions Lift Prices, But Resistance Looms
By:
Key Points:
- WTI crude gained nearly 4% this week, its first in three, fueled by rising demand and supply disruption concerns.
- Canadian wildfires disrupted 7% of oil output, adding temporary pressure to global supply expectations.
- OPEC+ may boost production by 400K+ barrels/day in August, potentially capping further price upside.

Market Overview
WTI crude futures hovered near $63.06 on Friday, up nearly 4% for the week, marking their first weekly gain in three as seasonal demand and geopolitical tensions lifted sentiment.
Concerns over potential supply disruptions due to global instability and Canadian wildfires, which temporarily curbed 7% of output, added upward pressure.
However, bullish momentum waned after signals that OPEC+ may boost output by over 400,000 barrels per day in August, with additional hikes possible in September.
A price cut on July crude for Asia further reflected weak regional demand. Broader uncertainty surrounding global trade and consumption continues to influence the outlook for oil and gas.
Natural Gas Price Forecast
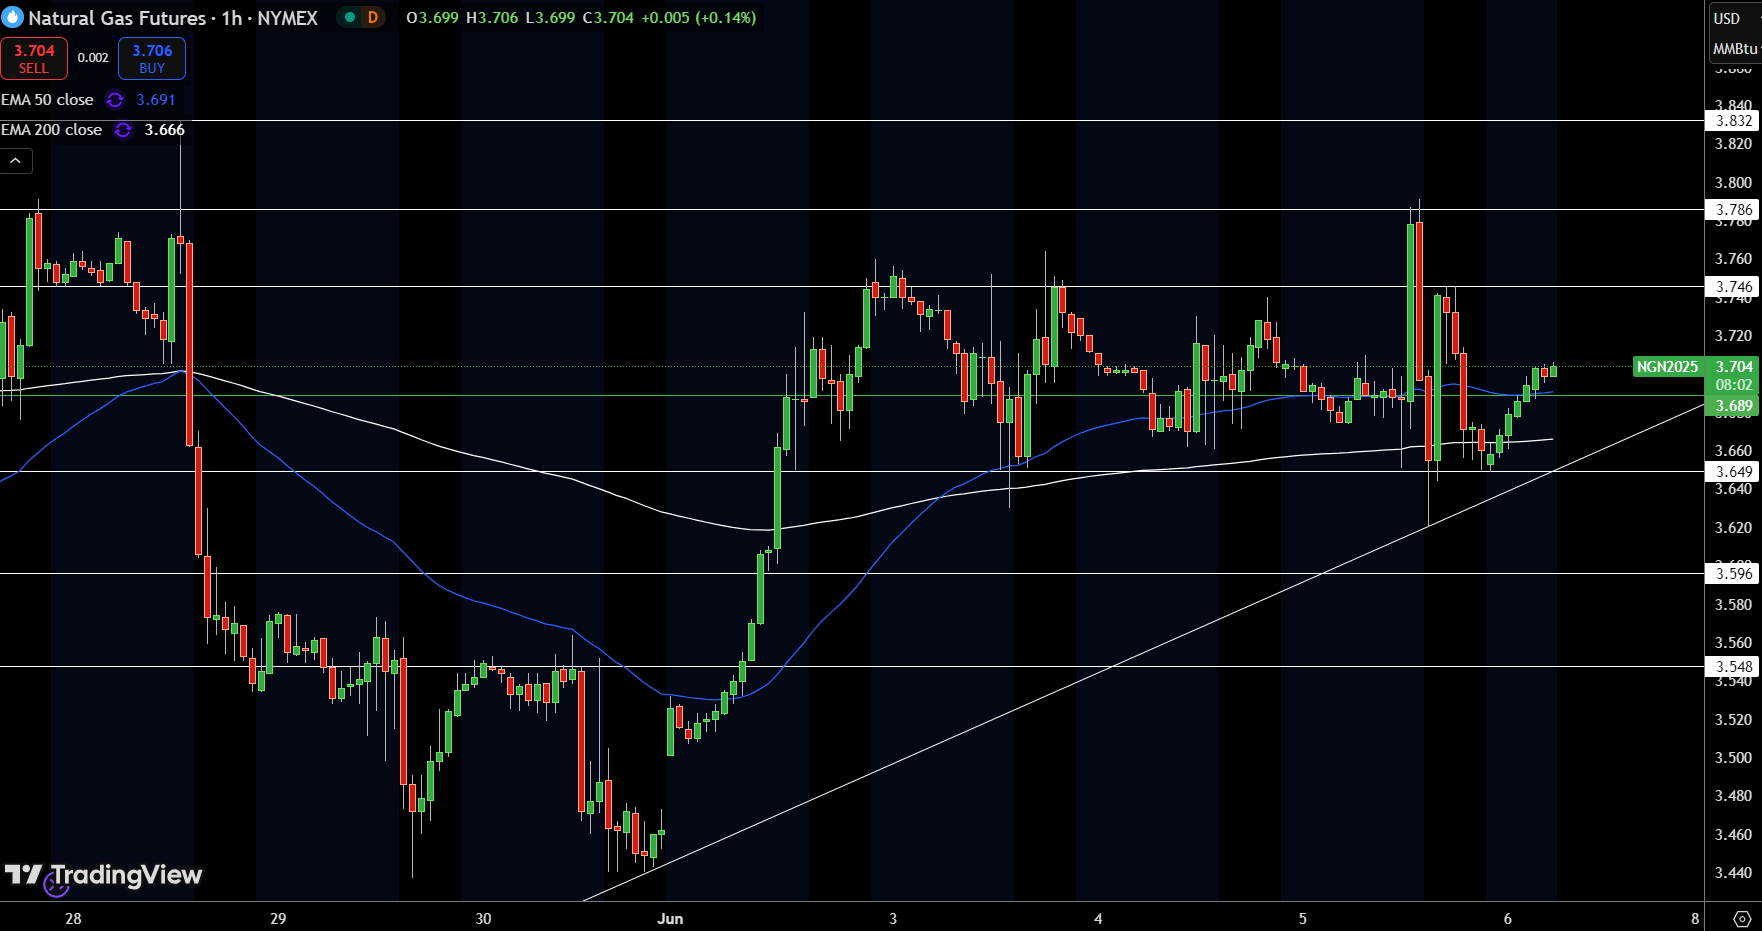
Natural gas is trading at $3.704, attempting to stabilize after bouncing off trendline support near $3.66. Price is now hovering just above both the 50 EMA at $3.691 and the 200 EMA at $3.666, creating a short-term confluence zone that could attract dip buyers.
The previous intraday high at $3.746 remains the next hurdle, and a clean break above that level could signal bullish continuation toward $3.786. On the other hand, failing to stay above $3.66 would leave $3.649 exposed.
So far, the structure remains constructive with higher lows, but the lack of strong follow-through keeps traders cautious. Momentum is building slowly—confirmation above $3.746 would offer a clearer upside signal.
WTI Oil Price Forecast
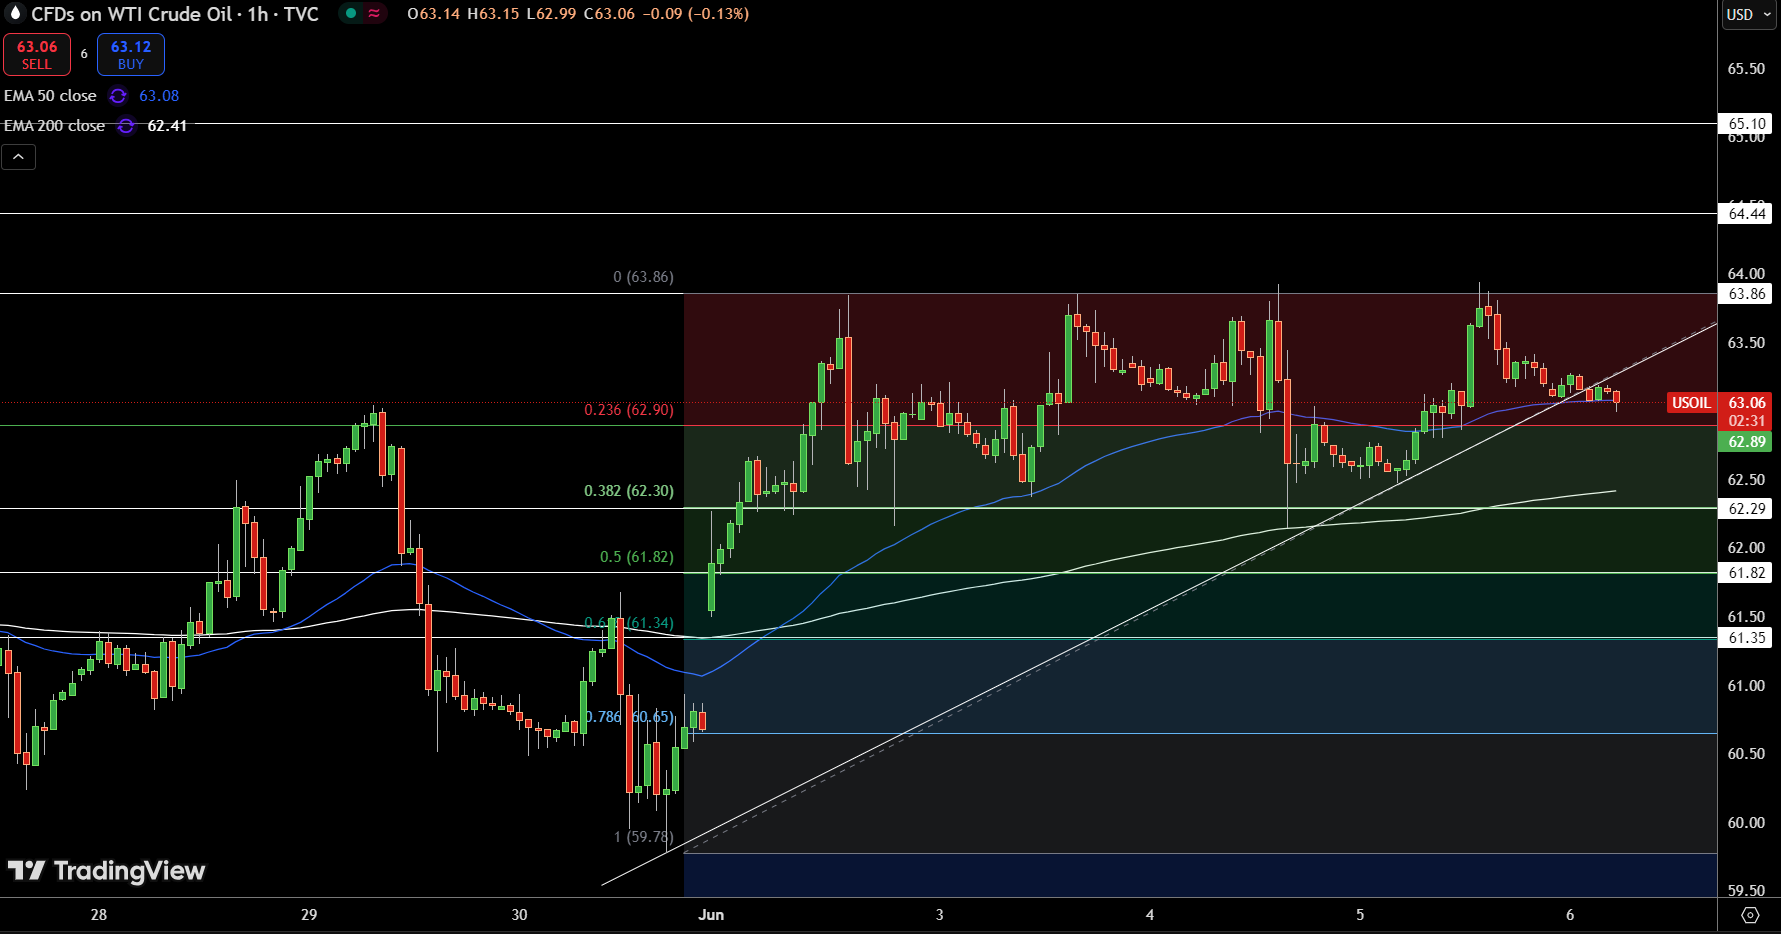
Crude oil is teetering on a critical level near $63.06 after slipping below its short-term trendline support. Price action has stalled just under $63.86, where sellers have repeatedly stepped in to counter the advance. The 50-hour EMA at $63.08 is no longer offering support, while the 200-hour EMA at $62.41 could be the next area buyers defend.
The $62.90 level, aligned with the 23.6% Fibonacci retracement, remains the pivot to watch. If that breaks convincingly, a move toward $62.30 or even $61.82 looks increasingly likely.
Momentum has waned, and buyers must regain ground quickly to avoid further pressure. A close back above $63.86 would reestablish control, but until then, the short-term outlook leans cautious.
Brent Oil Price Forecast
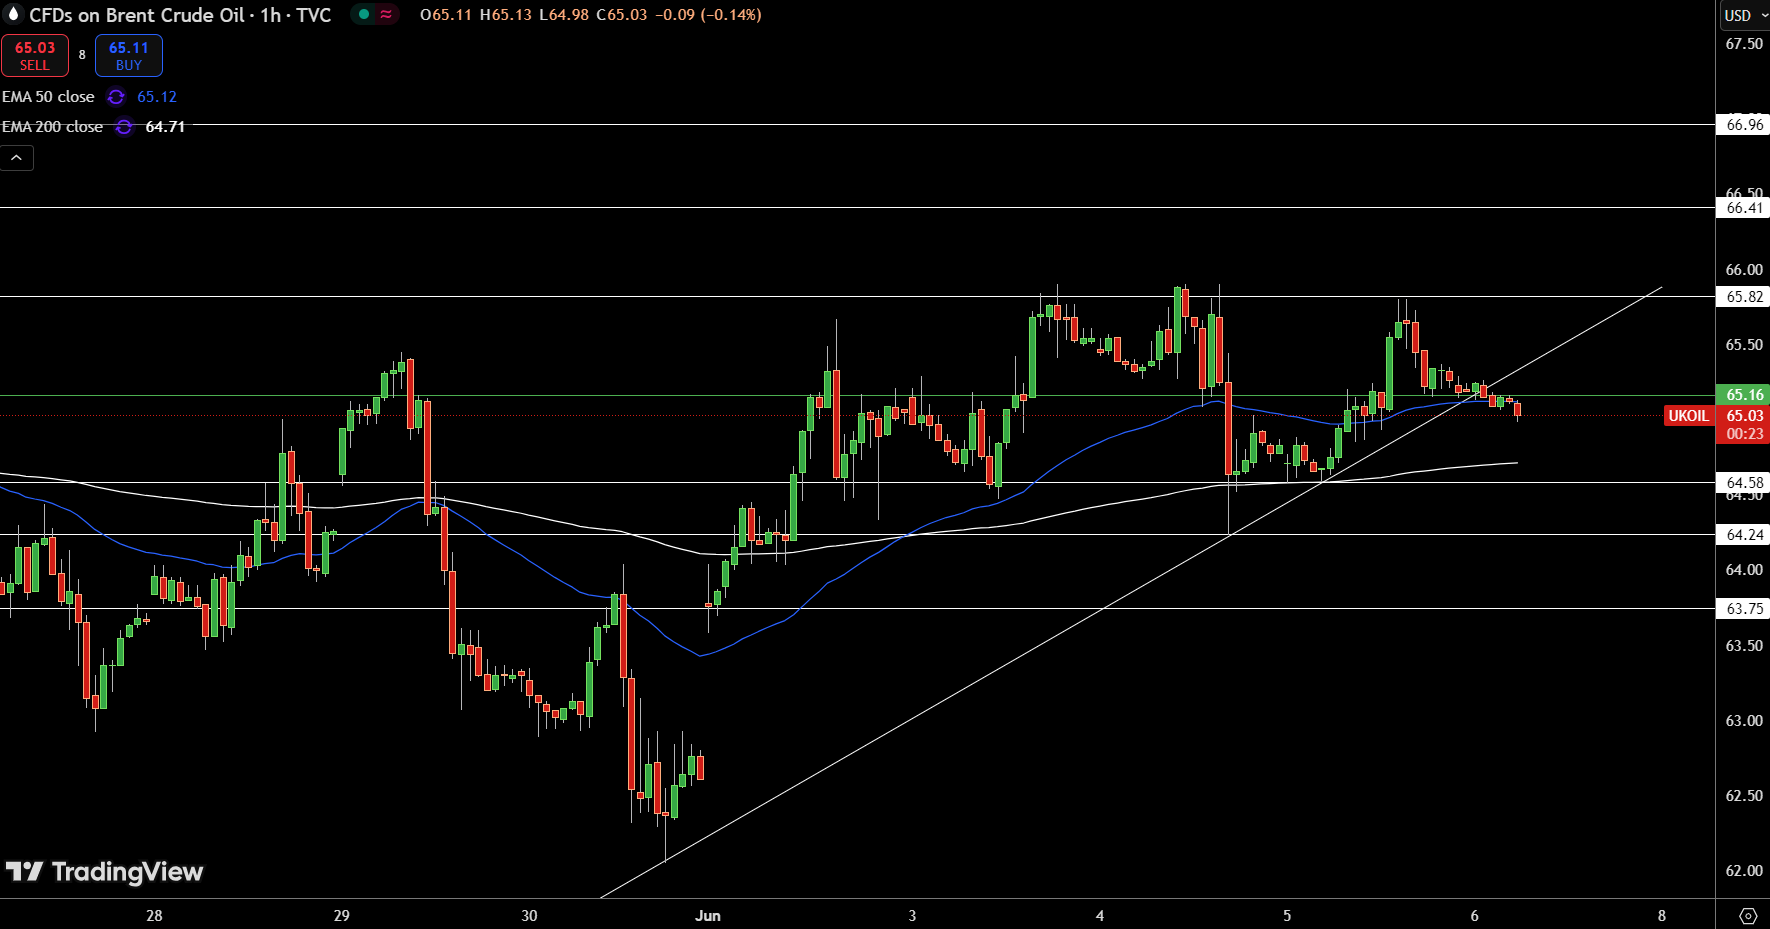
Brent crude is hovering at $65.00 after slipping just below its short-term trendline, hinting at early signs of weakness. The 50-hour EMA at $65.11 has lost influence, while the 200-hour EMA at $64.71 is the next level that could catch buyers.
The recent failure to break above $65.82 has capped bullish momentum. Price is still stuck in a range, but if $64.58 doesn’t hold, we could see a drop toward $64.24 or even $63.75. That said, the structure isn’t aggressively bearish yet—it’s more of a waiting game.
Traders will need a solid close above $65.82 to regain confidence in a push higher. For now, price action favors consolidation with a cautious tilt to the downside.
About the Author
Bob MasonChief Crypto Boss
123456789 30 He has written extensively for a broader audience and his current focus is on developments relating to the financial markets including, but not limited to currencies, commodities, alternative asset classes, and global equities.


Advertisement