
Advertisement
Advertisement
Natural Gas and Oil Forecast: Middle East Tensions Stoke Rally Across Energy Markets
By:
Key Points:
- WTI crude soared 13% intraday and closed 7% higher, fueled by Middle East supply fears and pipeline disruption risks.
- Natural gas bounced above its 50 and 200 EMA, but heavy selling near $3.74 caps momentum below a descending trendline.
- Brent crude hovers near $74.64 with resistance at $75—sideways action signals indecision following a strong price rally.

Market Overview
Crude oil futures extended gains Monday, with WTI rising to $74.10 per barrel, as geopolitical tensions in the Middle East sparked fresh supply concerns. Friday’s session saw oil prices surge over 13% intraday, closing 7% higher—the sharpest single-day gain in months—driven by fears of disruption across key energy infrastructure.
A production halt at a major Persian Gulf gas field further unsettled the market, fueling speculation of prolonged volatility. Meanwhile, uncertainty around upcoming U.S. trade policy added to investor caution.
Natural gas prices also advanced as energy traders braced for potential spillovers across the broader fossil fuel complex amid tightening global supply.
Natural Gas Price Forecast
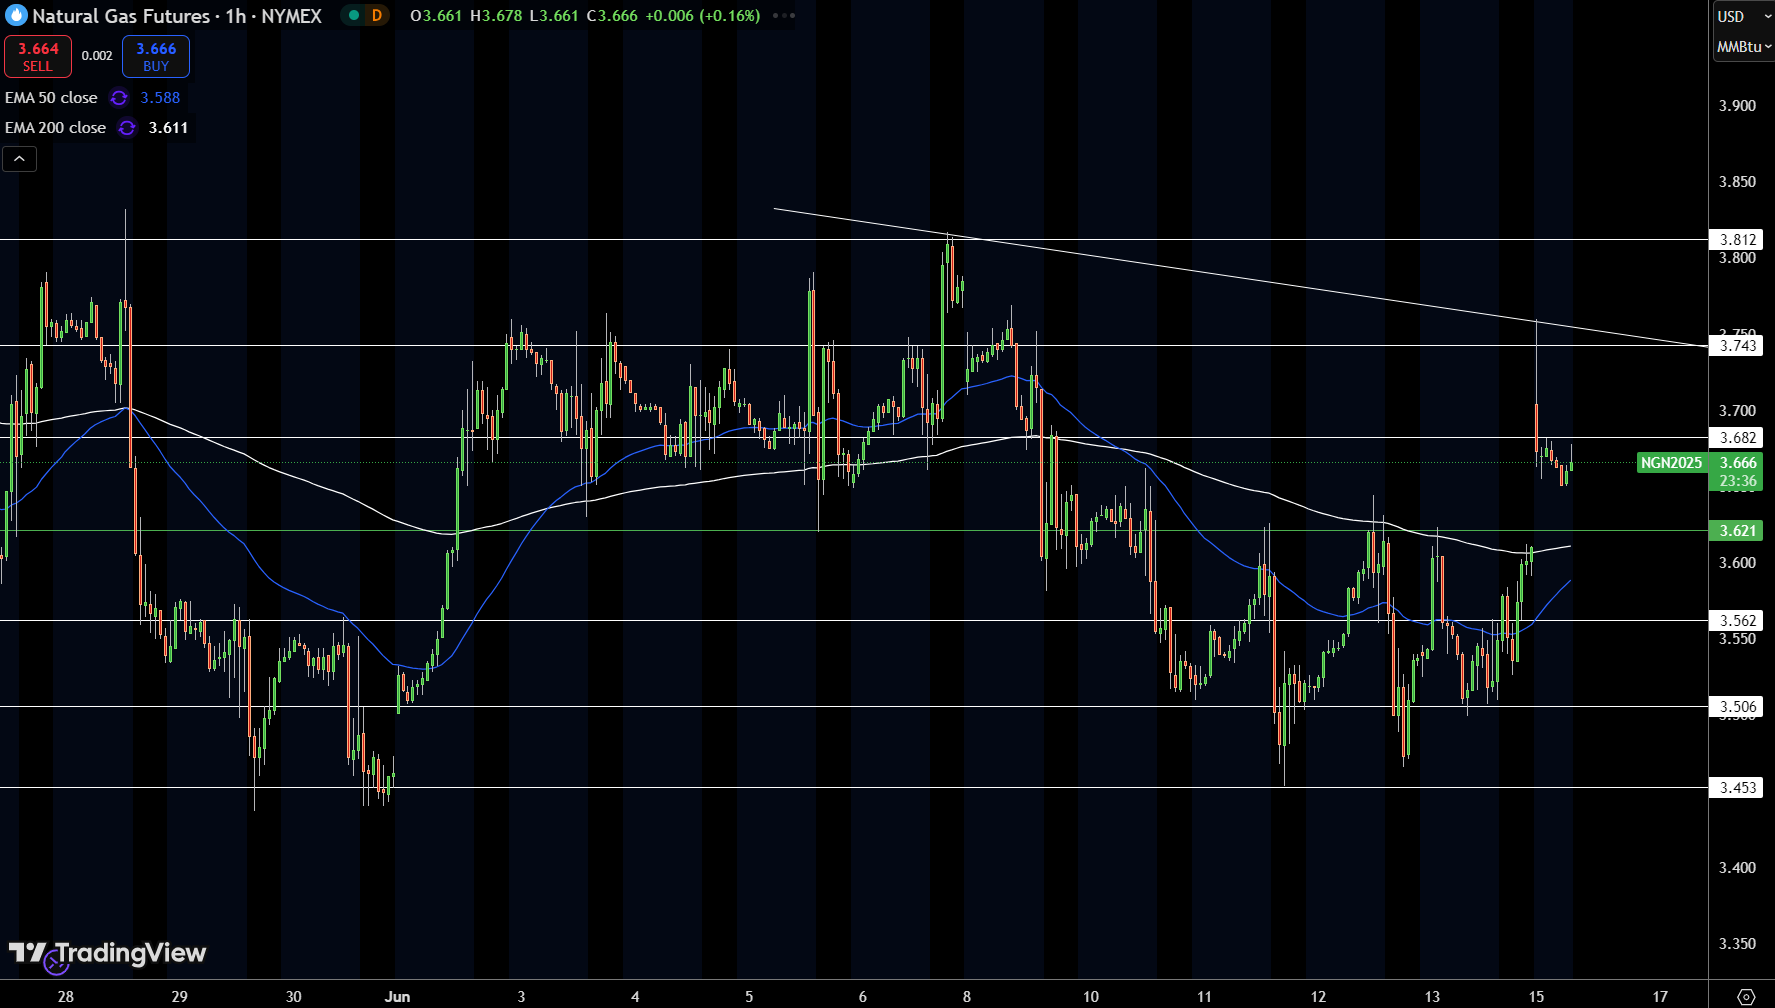
Natural gas futures are trading around $3.66 after rejecting sharply from the $3.74 resistance zone. The bounce came as price broke above both the 50 EMA ($3.58) and 200 EMA ($3.61), triggering a short-term bullish signal.
However, the move stalled beneath a descending trendline stretching from earlier June highs, where supply pressure reappeared. The wick-heavy candle near $3.74 suggests aggressive selling at that level. For now, $3.62 remains the immediate support to watch; if broken, bears could eye $3.56 and $3.50 next.
Momentum is mixed as price sits between key levels, and without a clean break above $3.74 or below $3.62, the market may chop sideways. A decisive trendline breakout could invite stronger directional flows.
WTI Oil Price Forecast
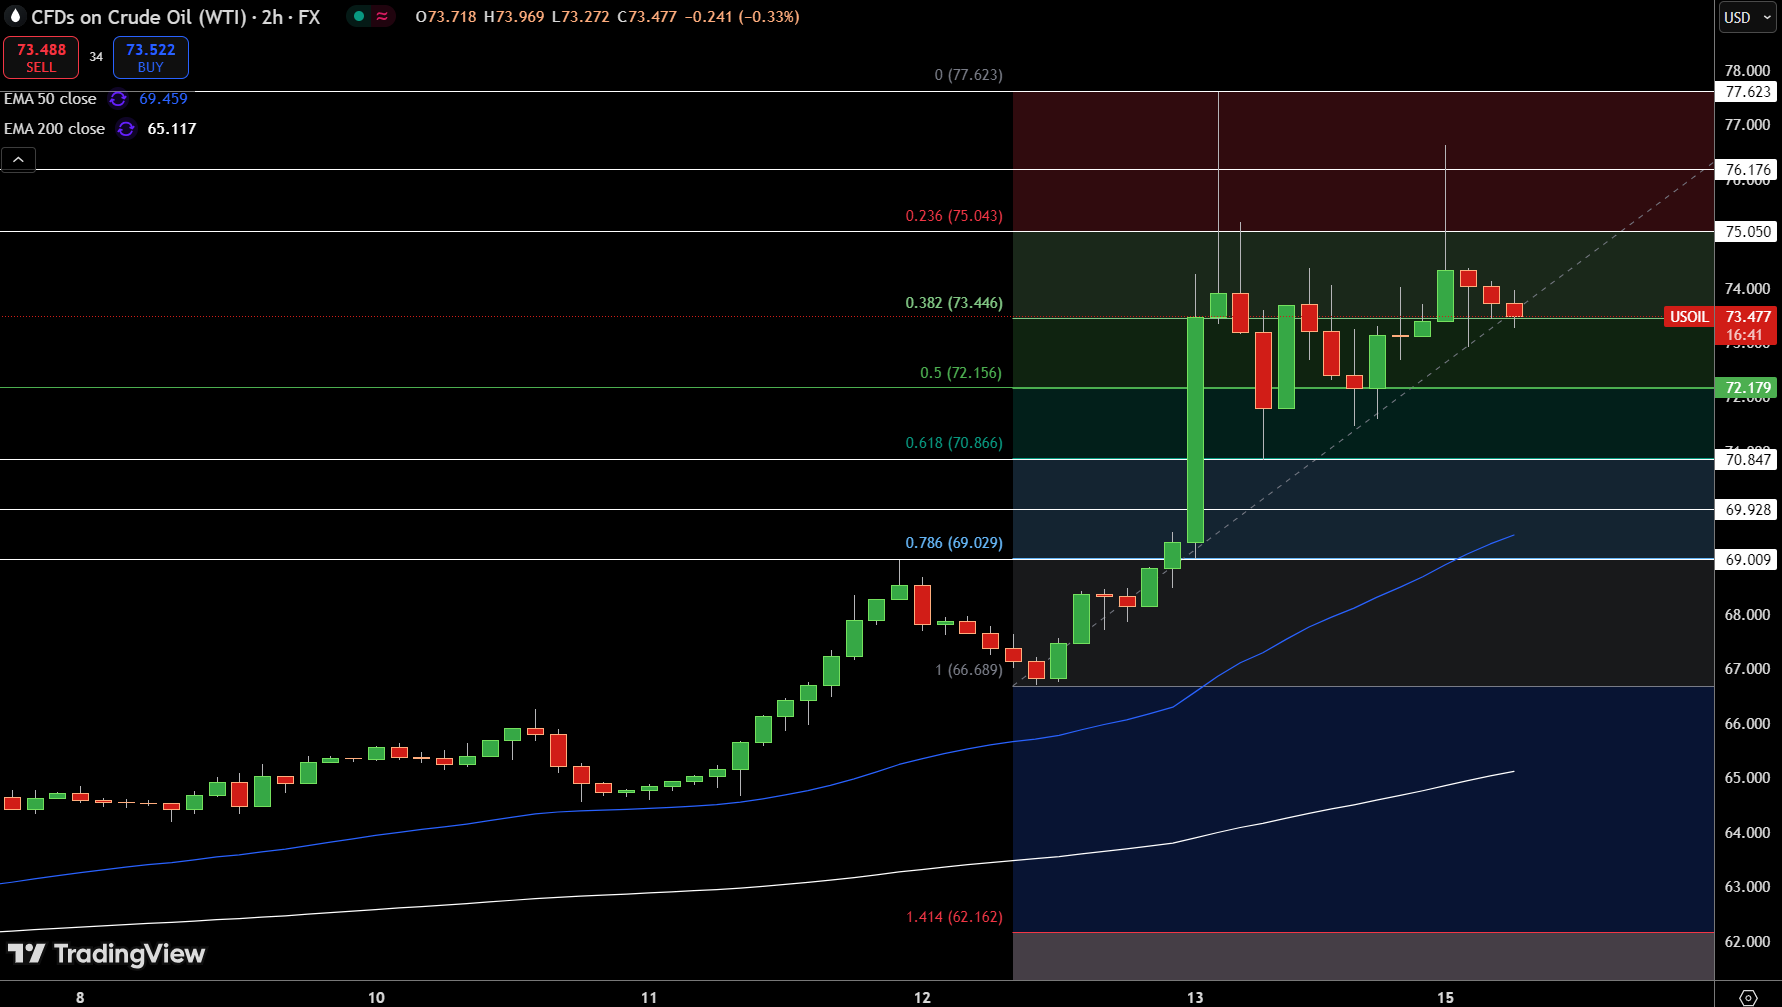
Crude oil (WTI) is pausing just above the $73.44 Fibonacci 38.2% retracement after last week’s breakout toward $77.62. Price is consolidating in a narrow range, suggesting traders are weighing whether the recent rally has legs.
A bullish trend remains intact as long as price holds above the $72.15 pivot and the rising 50 EMA at $69.45, which itself sits comfortably above the 200 EMA at $65.11—a textbook bullish crossover. Candlestick structure shows hesitation near resistance, with small-bodied candles and upper wicks indicating mild selling pressure.
Immediate resistance stands at $75.04, with $76.17 next. Support rests at $72.15, followed by $70.86. The pullback looks healthy for now, but a break below the pivot could shift momentum sharply.
Brent Oil Price Forecast
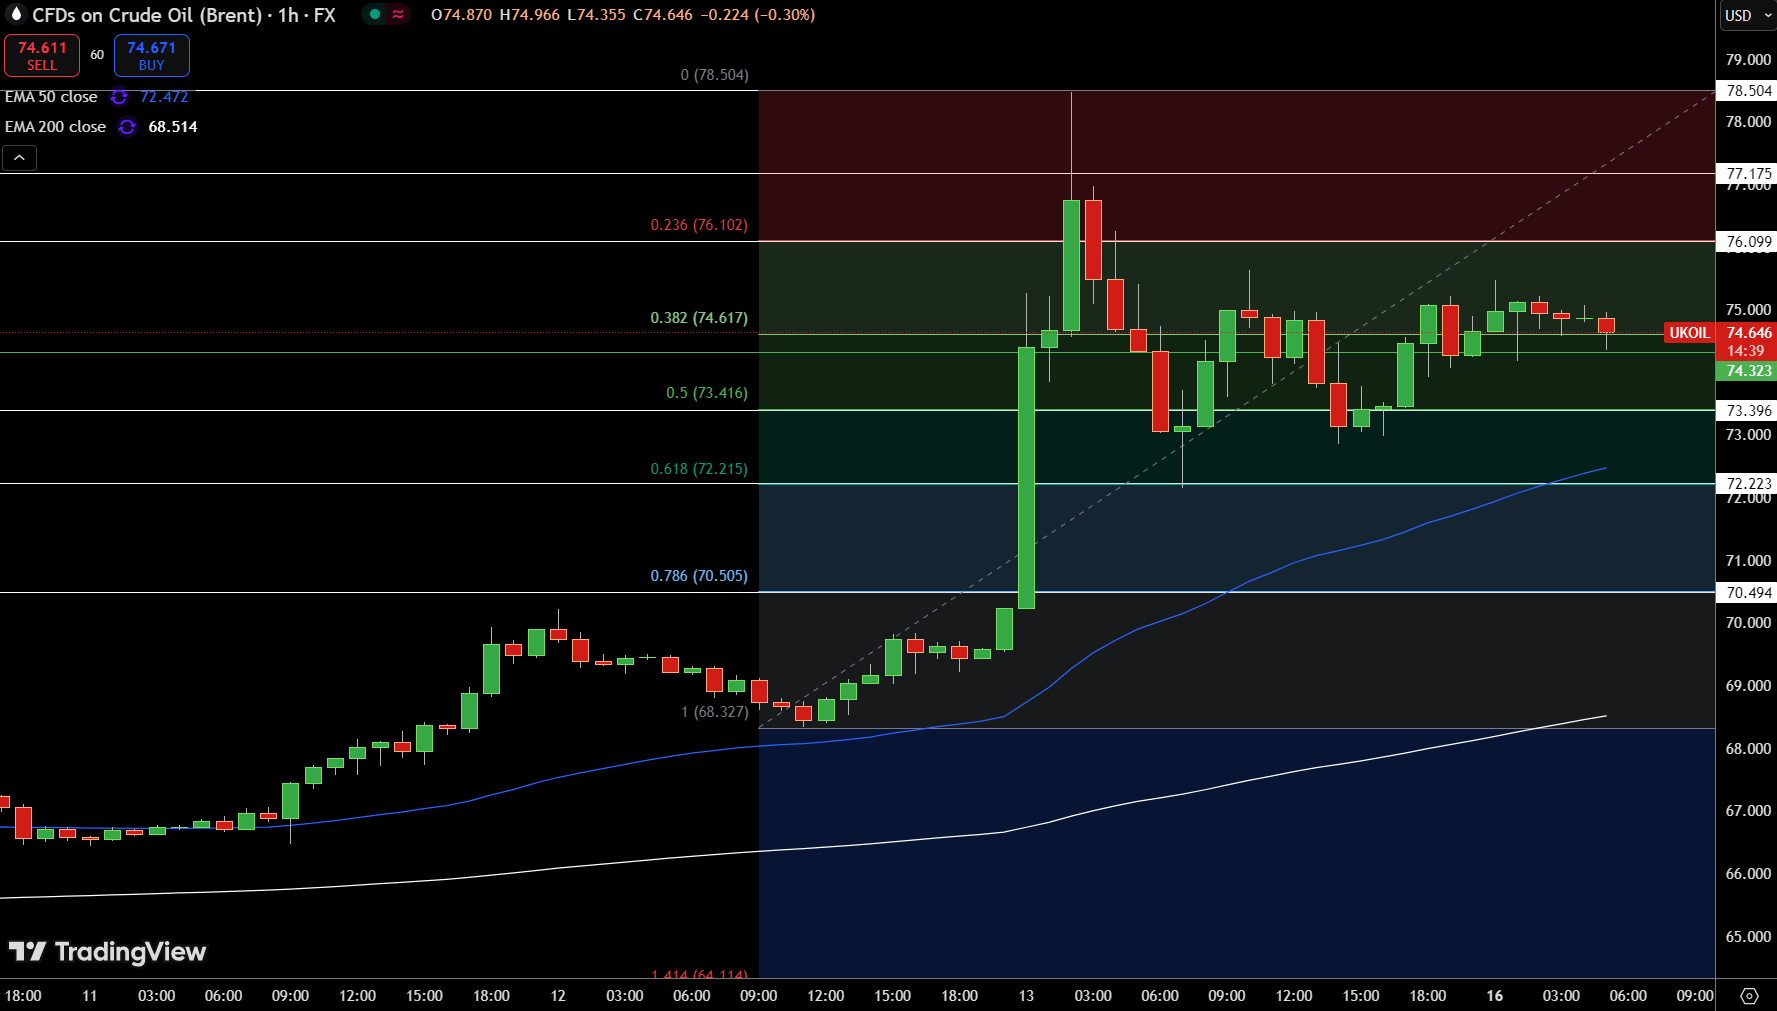
Brent crude is hovering near $74.64 after failing to hold above the $74.61 Fibonacci 38.2% retracement level. The market spiked earlier toward $76.10 but met stiff resistance, forming several upper-wick candles that point to seller presence.
Despite the pullback, price remains above the 50 EMA at $72.47, while the 200 EMA at $68.51 confirms a longer-term bullish bias. So far, the structure appears to be a sideways consolidation after a vertical move from the $68.32 base, with the $73.41 level acting as key mid-range support.
Momentum seems neutral, but a sustained break above $75 could reignite bullish interest. Conversely, slipping below $73.41 may expose $72.21. For now, Brent is caught in a tight post-breakout equilibrium.
About the Author
Bob MasonChief Crypto Boss
123456789 30 He has written extensively for a broader audience and his current focus is on developments relating to the financial markets including, but not limited to currencies, commodities, alternative asset classes, and global equities.


Advertisement