
Advertisement
Advertisement
Natural Gas and Oil Forecast: U.S. Inventory Drop Sparks Volatility—What to Expect Next
By:
Key Points:
- U.S. crude inventory drops by 6.9M barrels, sparking volatility in oil and natural gas markets. What does this mean for prices moving forward?
- OPEC+ delays production hikes, keeping pressure on oil prices as demand uncertainties and geopolitical risks grow.
- Natural gas faces key resistance at $2.277—will a breakout trigger bullish momentum, or will bearish sentiment prevail below this level?

In this article:
Market Overview
Oil prices edged higher in Asian markets on Friday, with investors cautious ahead of critical U.S. employment data. Geopolitical tensions and OPEC+’s decision to delay production hikes added complexity to the market outlook.
Despite a significant U.S. crude inventory withdrawal of 6.9 million barrels, demand concerns, driven by mixed economic data and a weaker U.S. dollar, have kept oil sentiment bearish.
For the week, Brent crude was poised for an 8% drop, while WTI looked to decline nearly 6%. Natural gas prices are also sensitive to these developments, as broader energy demand may fluctuate accordingly.
Natural Gas Price Forecast
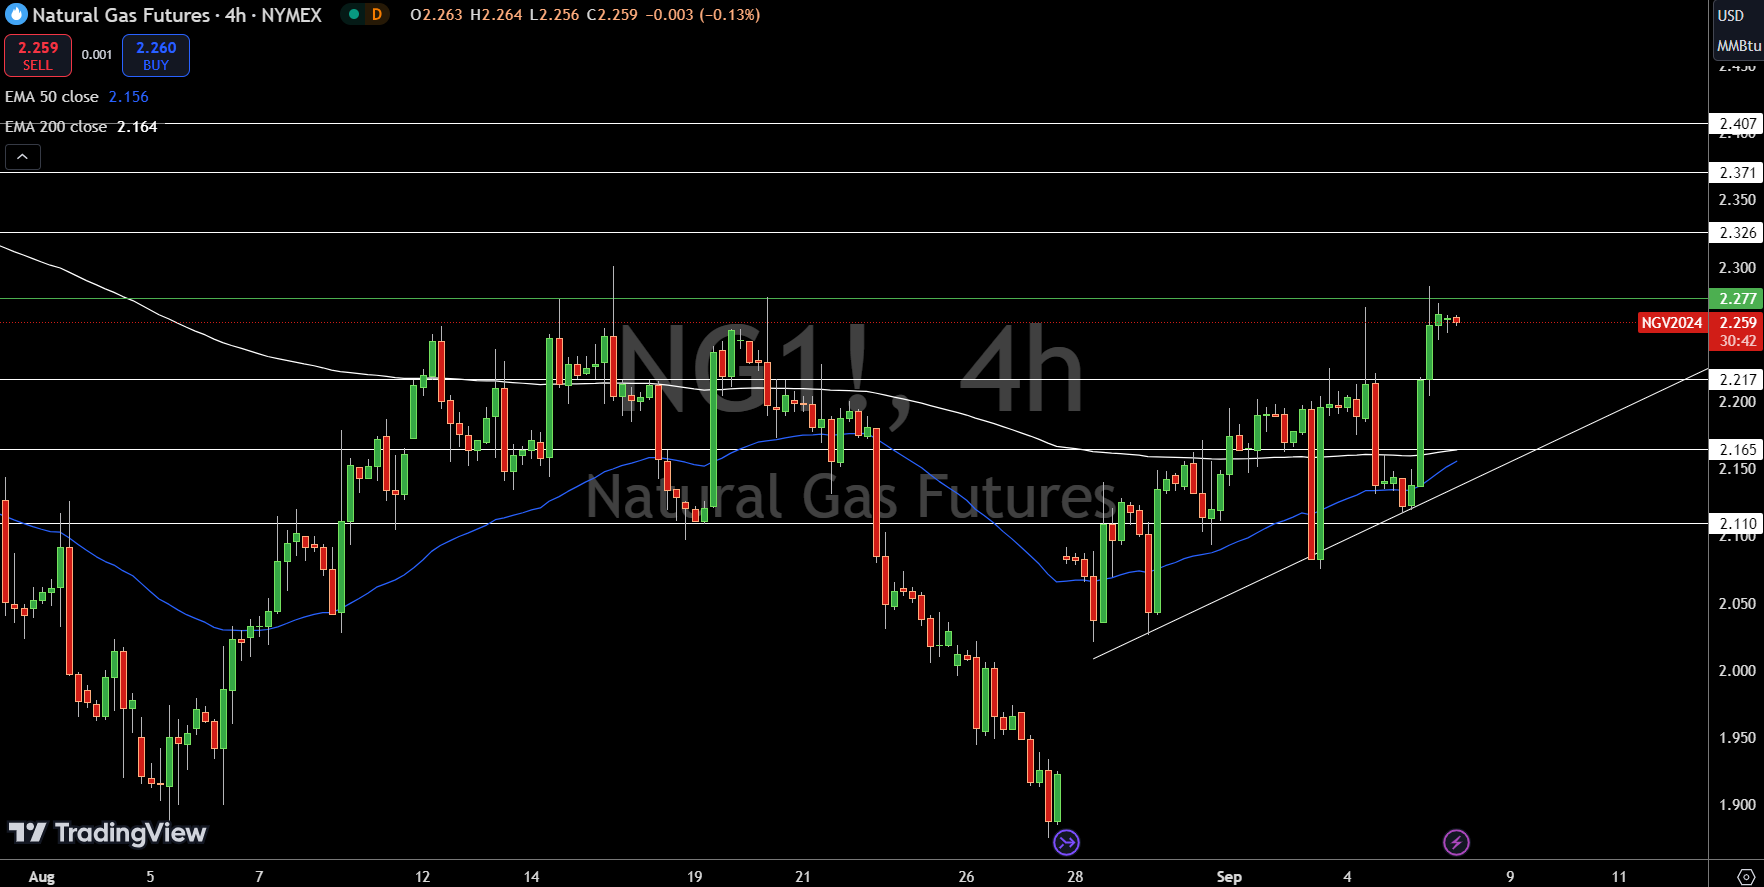
Natural Gas (NG) chart shows a developing triple top pattern, presenting a significant resistance around the $2.277 level. Currently, both the 50-day and 200-day exponential moving averages (EMA) sit at $2.156 and $2.164, respectively, indicating underlying bullish momentum.
However, a decisive breakout above $2.277 is necessary to confirm further upward movement. Immediate resistance levels are $2.326, $2.371, and $2.407, while support stands at $2.217, with the next key levels at $2.165 and $2.110.
If the price fails to break through $2.277, we could see selling pressure intensify. In summary, bearish sentiment prevails below $2.277, but a break above could fuel a more pronounced bullish trend.
WTI Oil Price Forecast
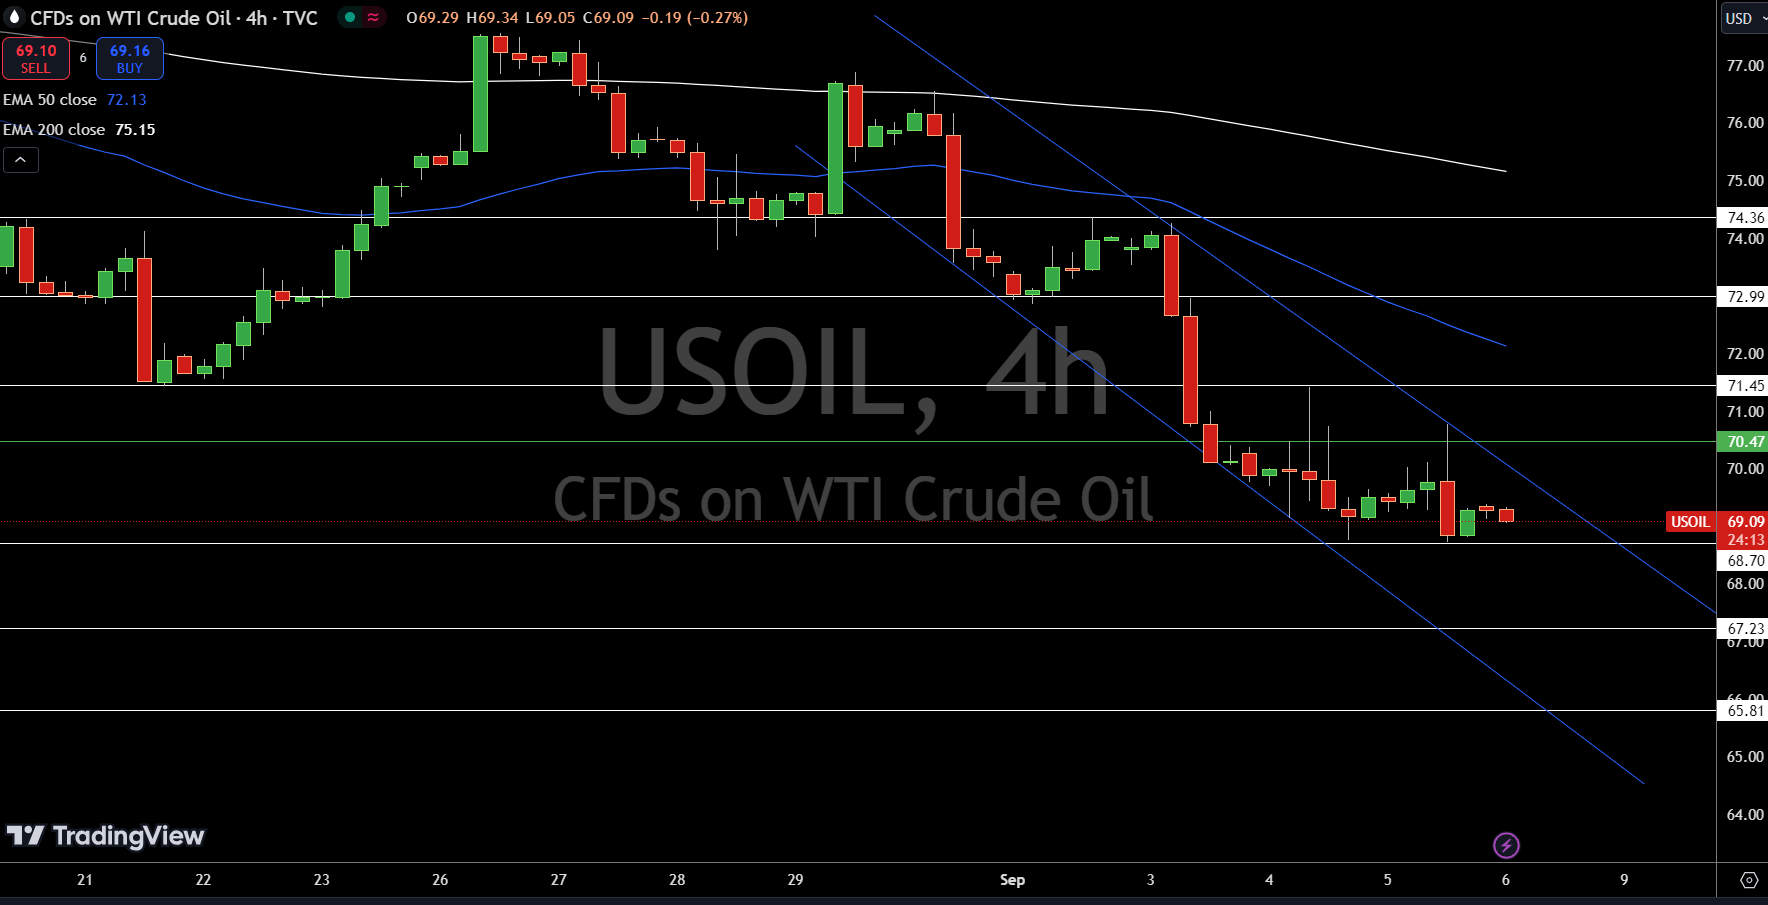
U.S. Oil (USOIL) is currently trading at $69.11, showing a slight decline of 0.22% in the 4-hour timeframe. The price is facing resistance at $70.47, which serves as today’s pivot point. The downward channel formation suggests that the bearish trend may continue unless a breakout above $70.47 occurs.
Immediate resistance levels are at $71.45, with higher targets at $72.99 and $74.36 if bullish momentum strengthens.
On the downside, immediate support is at $68.70, followed by $67.23 and $65.81. The 50-day EMA at $72.13 and 200-day EMA at $75.15 suggest that bullish momentum remains capped unless these levels are breached.
Brent Oil Price Forecast
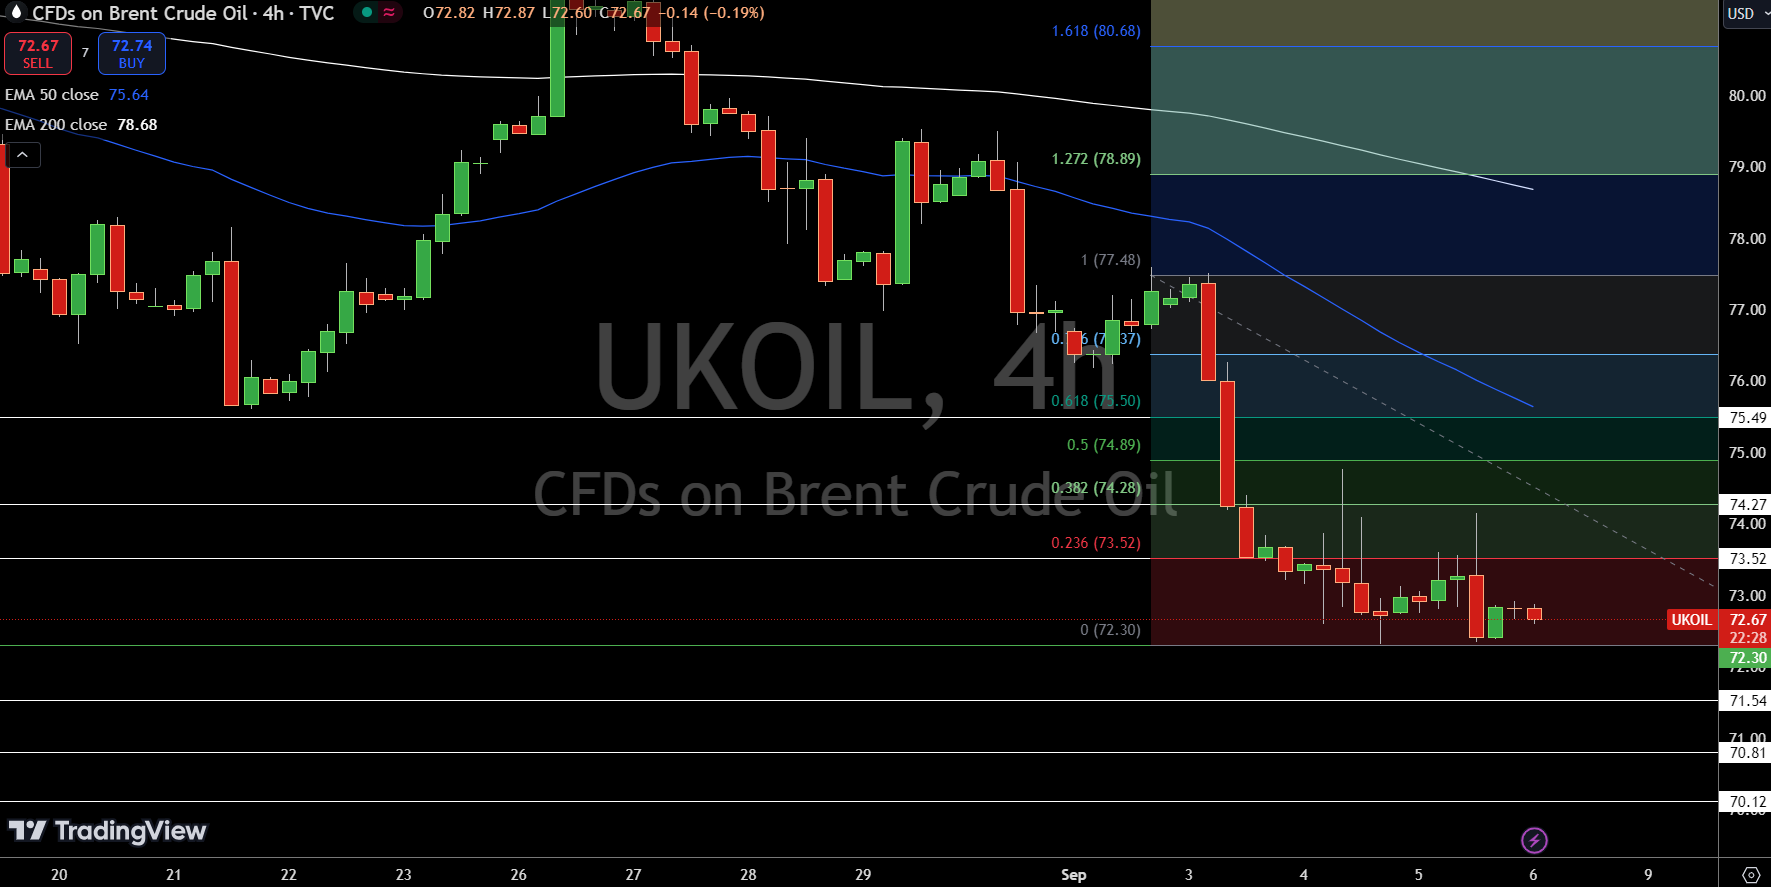
UKOIL is trading at $72.68, down 0.22% on the 4-hour chart. The price is hovering just above its pivot point at $72.30, which is a crucial level for today’s trading. If the price breaks above this level, it could encounter immediate resistance at $73.52, followed by higher targets at $74.27 and $75.49.
On the downside, immediate support is at $71.54, with lower levels of $70.81 and $70.12. The 50-day EMA at $75.64 and 200-day EMA at $78.68 show that any bullish momentum would face strong resistance unless these levels are breached.
For now, the bearish trend remains dominant below $72.30, with potential for a sell-off if the price breaks lower.
About the Author
Bob MasonChief Crypto Boss
TEST 30 He has written extensively for a broader audience and his current focus is on developments relating to the financial markets including, but not limited to currencies, commodities, alternative asset classes, and global equities.
Latest news and analysis


Advertisement