
Advertisement
Advertisement
Natural Gas Price Forecast: Faces Key Resistance at 200-Day MA
By:
Natural gas tested resistance at the 200-Day MA after breaking above the 50-Day MA, but is set to close near session lows, signaling a possible pullback.
In this article:
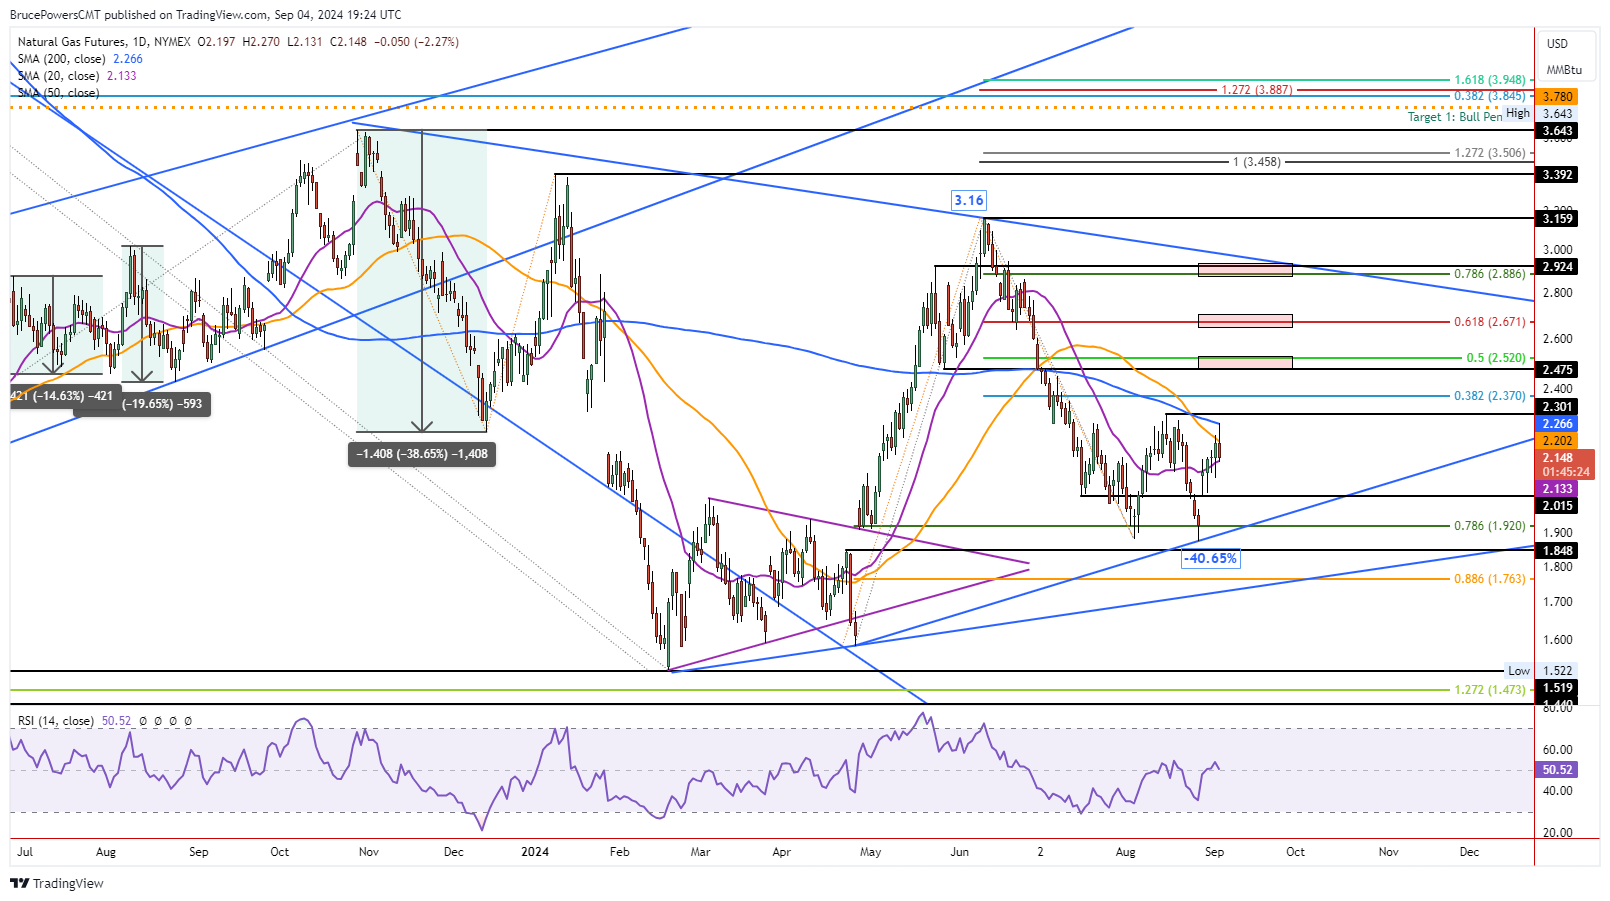
Natural gas rose to a new high of 2.27 on Wednesday before pulling back intraday. The day’s high was a successful test of resistance at the 200-Day MA (blue). A breakout above the 50-Day MA (orange) occurred earlier in the session. However, natural gas is set to end down for the day and closing near session lows. But it remains above the 20-Day MA at 2.13 at the time of this writing.
This will leave it sandwiched between the resistance around the 200-Day MA at 2.27 and the 20-Day MA at 2.13, today’s low. Therefore, today’s price range provides two price levels to watch for clues as to what is next.
Near-term Support at 2.13
A breakdown from today’s low will also trigger a drop below the 20-Day line. The 20-Day line has a chance to maintain support as the trend advances. Nonetheless, a pullback may come first and the 2.13 price level is the area to watch. Some degree of a pullback or rest would not be a surprise given the advance and test of the 200-Day line. The question is whether a sustained breakout to recapture the 200-Day MA can occur with a short rest or will a longer period be needed. There was weekly support at 2.00 two weeks ago and it could be an area of support if a pullback develops.
Breakout Above 200-Day Line Points Higher
If the 200-Day line can be recaptured, natural gas will then have a chance to breakout above the developing double bottom bullish reversal pattern. The center and most recent swing high marks the breakout level at 2.30. Subsequently, the 38.2% retracement at 2.37 should be easily surpassed, leading to the 50% retracement target at 2.52. Three price levels for to eventually reach the 78.6% retracement at 28.89. That is right near the downtrend line that marks the top of a large symmetrical triangle pattern.
Double Bottom Potential
As the double bottom pattern continues to develop there could easily be pullbacks to further test support around the 20-Day line, as well as a potential support zone from the 2.015 swing low in mid-July. Otherwise, for the bullish near-term outlook to be sustained a pullback should not fall below the internal uptrend line.
For a look at all of today’s economic events, check out our economic calendar.
About the Author
Bruce Powerscontributor
Bruce has been involved in the financial markets for over 20 years, as an analyst, trader, educator, and writer.
Latest news and analysis


Advertisement