
Advertisement
Advertisement
Natural Gas Price Forecast: Support Holds as Gas Targets Key Upside Resistance
By:
Support held at key levels, including the 20-Day MA, as natural gas builds toward a breakout with upside potential into the $4.08–$4.12 zone.

Demand remained strong for natural gas on Tuesday as it rallied slightly above Monday’s high to reach a high for the day of $3.76. The low for the day was $3.64, which was a successful test of support at the mid-line of a rising trend channel (dashed). Buyers stepped up following that low and drove prices higher. At the time of this writing, trading continues near the highs of the day, leaving gas in a position to complete a potential bullish momentum hammer candle pattern, and possibly with a doji.
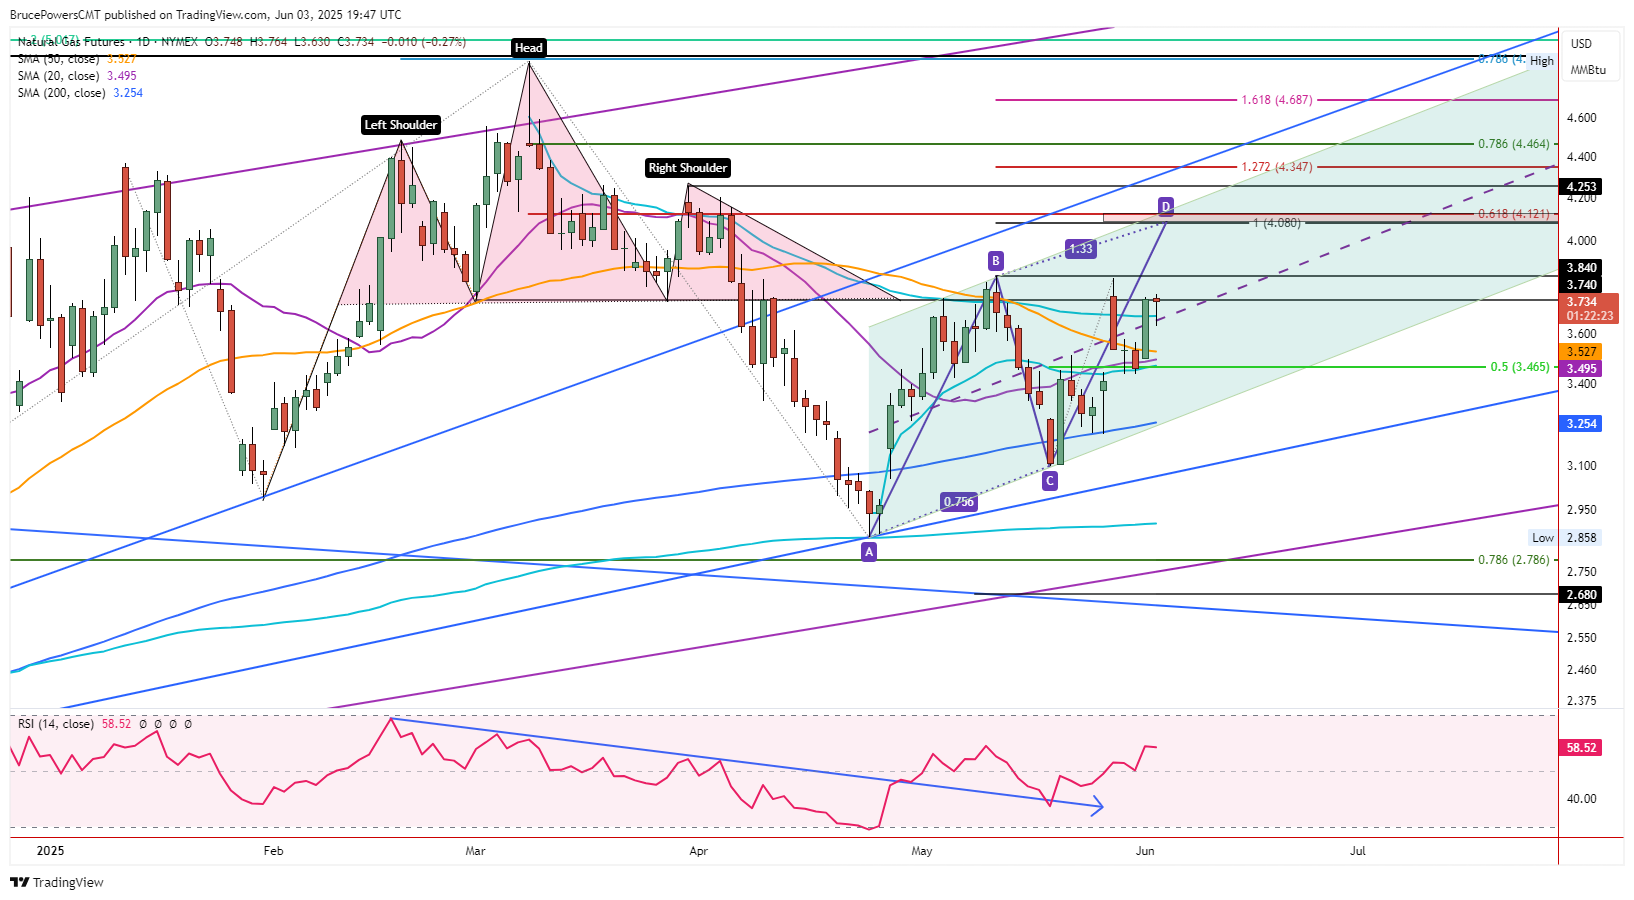
Above $3.84 Leads Higher
The next key upside pivot level is the prior lower swing high at $3.84 (B). A decisive rally above that higher level will trigger the continuation of a rising ABCD pattern with an initial upside target around $4.08. That price level can be considered as the beginning of a price range up the 61.8% Fibonacci retracement at $4.12.
Recent Signs of Strength
Given recent signs of strength, it looks like there is a good chance the breakout may trigger. Notice that the prior three days found support around the 20-Day MA (purple). A breakout above the 50-Day MA was confirmed yesterday with a daily close above the line. Once reclaimed both the 20-Day and 50-Day lines are potential support and will likely be used by traders as an area to enter or add in anticipation of rising prices.
In addition, support last week was also confirmed by a 50% retracement level and an AVWAP (light blue) support level anchored from the April swing low. Notice that previously, the AVWAP line represented an area of resistance from May 15 to May 27. Again, once a prior resistance line is successfully tested as support the stage is set for the trend to move higher.
20-Day May About to Rise Above 50-Day Line
The 20-Day and 50-Day lines have been converging, with the faster 20-Day line targeting a rise above the 50-Day soon. That would provide another bullish sign in support of a strengthening trend. If the parameters of the rising trend channel are retained, there is the potential for resistance to be seen near the top line of the channel. The timing could coincide with the approach to the $4.08 target zone. There are three hits of the top channel line thereby confirming the line. If a third hit leads to a bearish reversal the bottom of the channel becomes a potential target.
For a look at all of today’s economic events, check out our economic calendar.
About the Author
Bruce Powerscontributor
Bruce has been involved in the financial markets for over 20 years, as an analyst, trader, educator, and writer.


Advertisement