
Advertisement
Advertisement
Natural Gas, WTI Oil, Brent Oil Forecasts – Oil Rebounds From Yearly Lows
By:
Key Points:
- Natural gas gains ground as traders focus on potential supply disruptions due to Hurricane Francine.
- WTI oil rebounds after strong sell-off as traders react to the EIA report and monitor the path of the hurricane.
- Brent oil is trying to settle back above the $71.00 level.

In this article:
Natural Gas
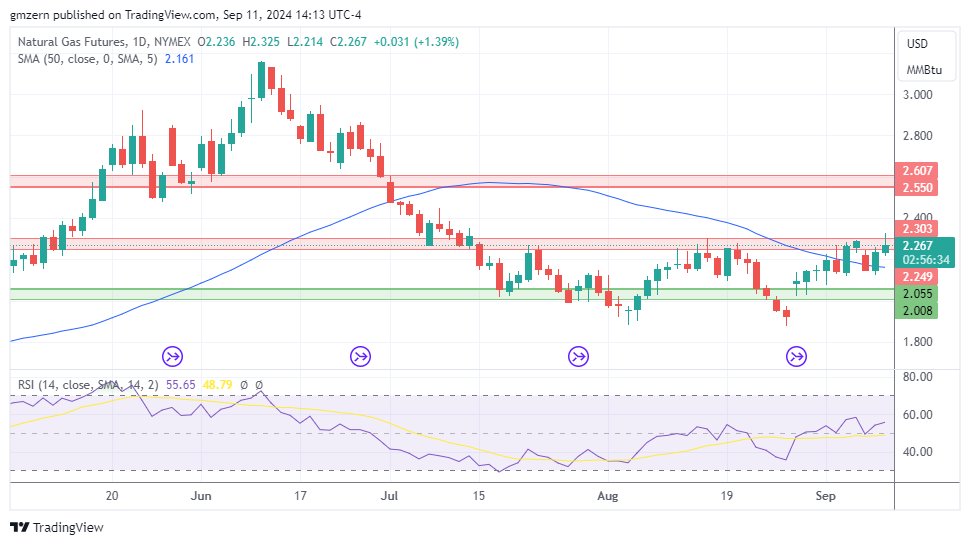
Natural gas tests resistance at $2.25 – $2.30 as traders bet that Hurricane Francine may disrupt supply.
In case natural gas climbs above the $2.30 level, it will move towards the next resistance at $2.55 – $2.60.
WTI Oil
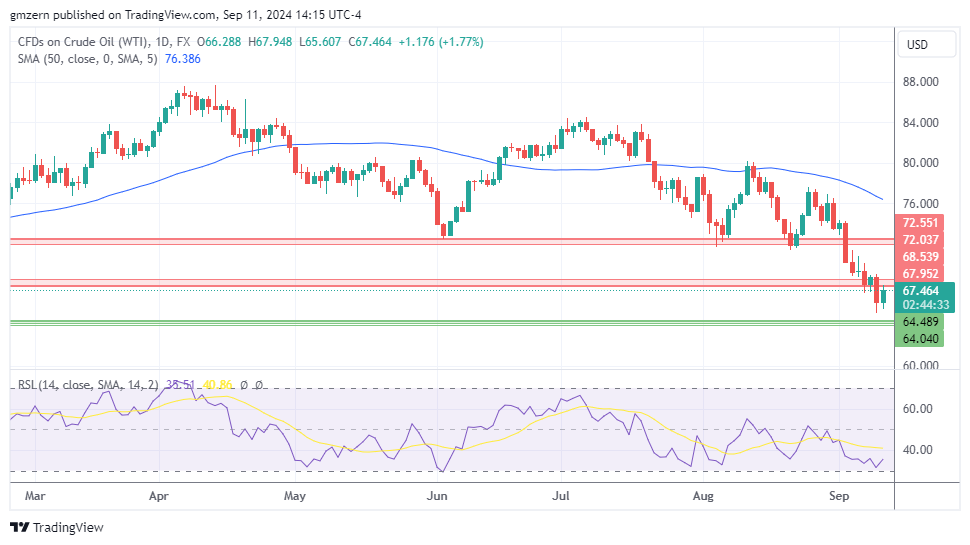
WTI oil rebounds from yearly lows as traders react to the EIA report, which indicated that crude inventories increased by 0.8 million barrels from the previous week.
A move above the resistance at $68.00 – $68.50 will open the way to the test of the next resistance level at $72.00 – $72.50.
Brent Oil
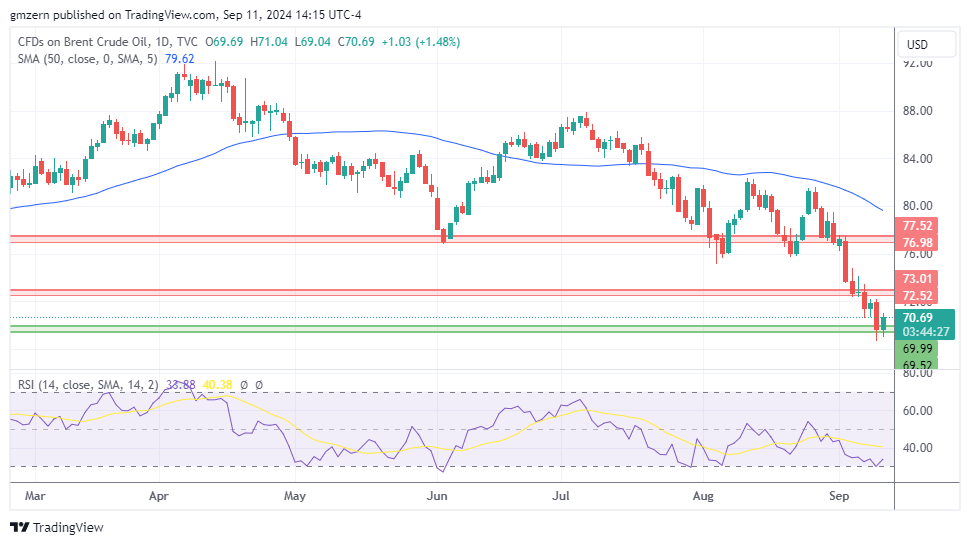
Brent oil gained ground as traders focused on Hurricane Francine. According to recent reports, about 24% of oil production in the Gulf of Mexico was shut.
If Brent oil settles back above the $71.00 level, it will head towards the resistance at $72.50 – $73.00.
For a look at all of today’s economic events, check out our economic calendar.
About the Author
Vladimir Zernovauthor
In more than 15 years of trading in the financial markets, Vladimir dealt with a wide range of brokers and financial instruments. His career as a day-trader at a proprietary trading firm goes back to 2007. Later, Vladimir turned to longer time frames and became an independent trader and analyst managing his own portfolio. Using his experience, he helps traders find the best broker in his reviews.
Latest news and analysis


Advertisement