
Advertisement
Advertisement
Natural Gas, WTI Oil, Brent Oil Forecasts – WTI Oil Dives 4.5% As OPEC Cuts Demand Forecasts
By:
Key Points:
- Natural gas rebounds after yesterday's pullback as traders stay focused on the potential impact of Hurricane Francine.
- WTI oil pulled back below the $66.00 level as OPEC cut its demand forecasts for 2024 and 2025.
- Brent oil settled below the psychologically important $70.00 level.

In this article:
Natural Gas
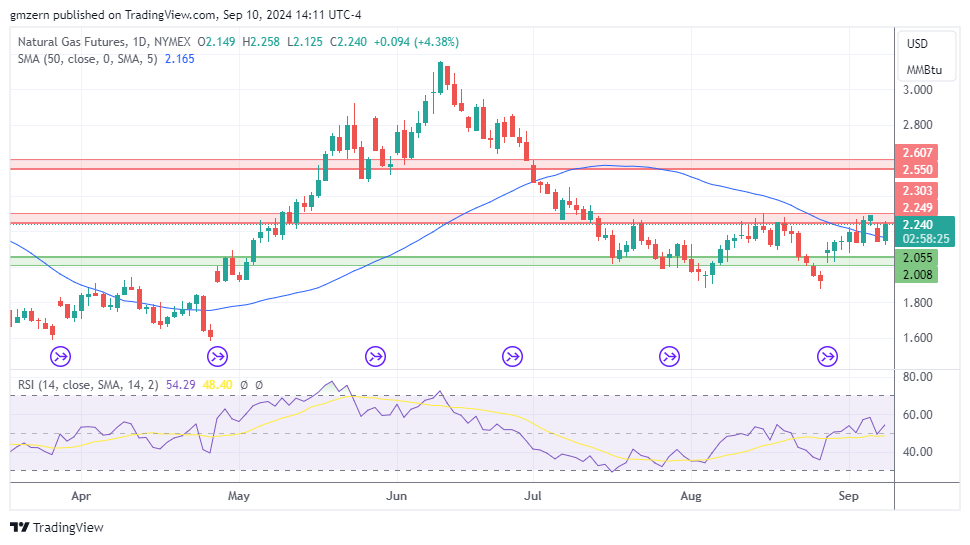
Natural gas gains ground as traders remain focused on the potential impact of Hurricane Francine.
A successful test of the resistance at $2.25 – $2.30 will push natural gas towards the next resistance at $2.55 – $2.60.
WTI Oil
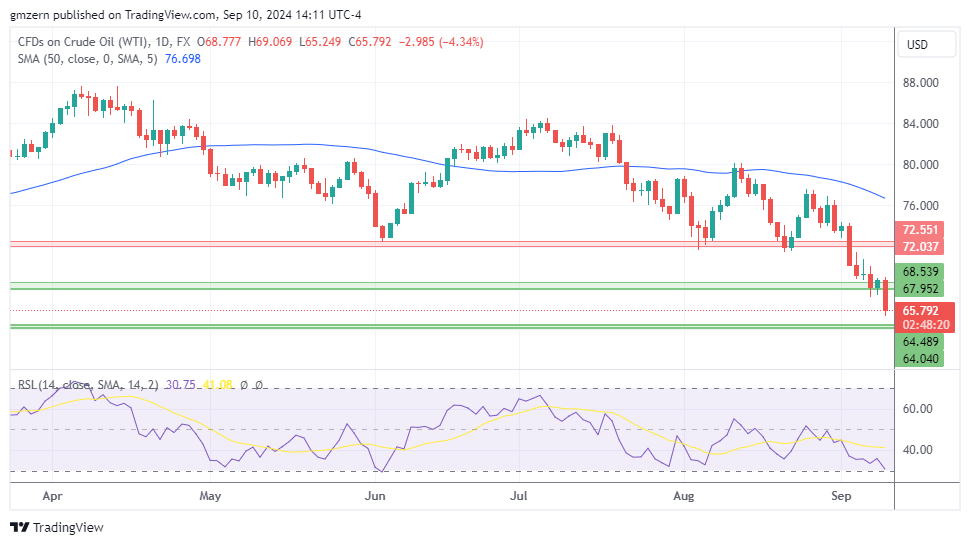
WTI oil tests yearly lows as traders react to the OPEC report, which indicated that the organization had cut its demand growth forecasts for 2024 and 2025.
If WTI oil settles below the $65.00 level, it will head towards the next support at $64.00 – $64.50.
Brent Oil
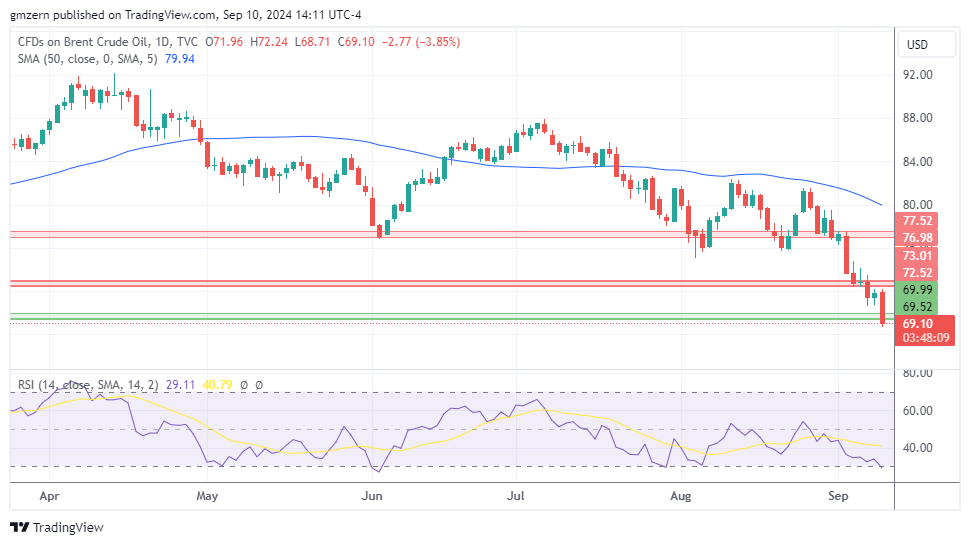
Brent oil is under strong pressure amid demand concerns. The revision of OPEC’s forecasts had a major negative impact on oil markets today.
Traders should note that RSI has recently moved into the oversold territory, so the risks of a rebound are increasing.
For a look at all of today’s economic events, check out our economic calendar.
About the Author
Vladimir Zernovauthor
In more than 15 years of trading in the financial markets, Vladimir dealt with a wide range of brokers and financial instruments. His career as a day-trader at a proprietary trading firm goes back to 2007. Later, Vladimir turned to longer time frames and became an independent trader and analyst managing his own portfolio. Using his experience, he helps traders find the best broker in his reviews.
Latest news and analysis


Advertisement