
Advertisement
Advertisement
Oil, Natural Gas, and US Dollar Analysis: WTI Faces Pressure as OPEC+ Decision Looms
By:
Key Points:
- WTI Crude Oil (CL) remains under bearish pressure below the 50-day SMA.
- Natural Gas (NG) is consolidating within a range and looking for its next direction.
- US Dollar Index (DXY) remains bearish and continues to trade lower.

WTI crude oil (CL) trades near $61.25 as traders await the OPEC+ decision on May 31. The market remains cautious ahead of the meeting, where the group may confirm an additional 411,000 barrels per day of production for July. If OPEC+ increases supply as expected, it could put downward pressure on oil prices. Comments from Russian officials suggest no final agreement has been reached, adding to the uncertainty. The current price consolidation reflects market indecision and the growing risk of oversupply.
At the same time, Trump’s remarks on progress in the Iran nuclear talks may limit the upside in oil prices. Any breakthrough could increase the Iranian oil supply, further weighing the market. However, the tariff delay on the EU adds a positive tone to risk sentiment and offers modest support to crude. The combined effect of potential supply increases and ongoing geopolitical shifts keeps oil prices fragile, with a downward bias if OPEC+ confirms production hikes.
WTI Crude Oil (CL) Technical Analysis
WTI Oil Daily Chart – Bearish Pressure
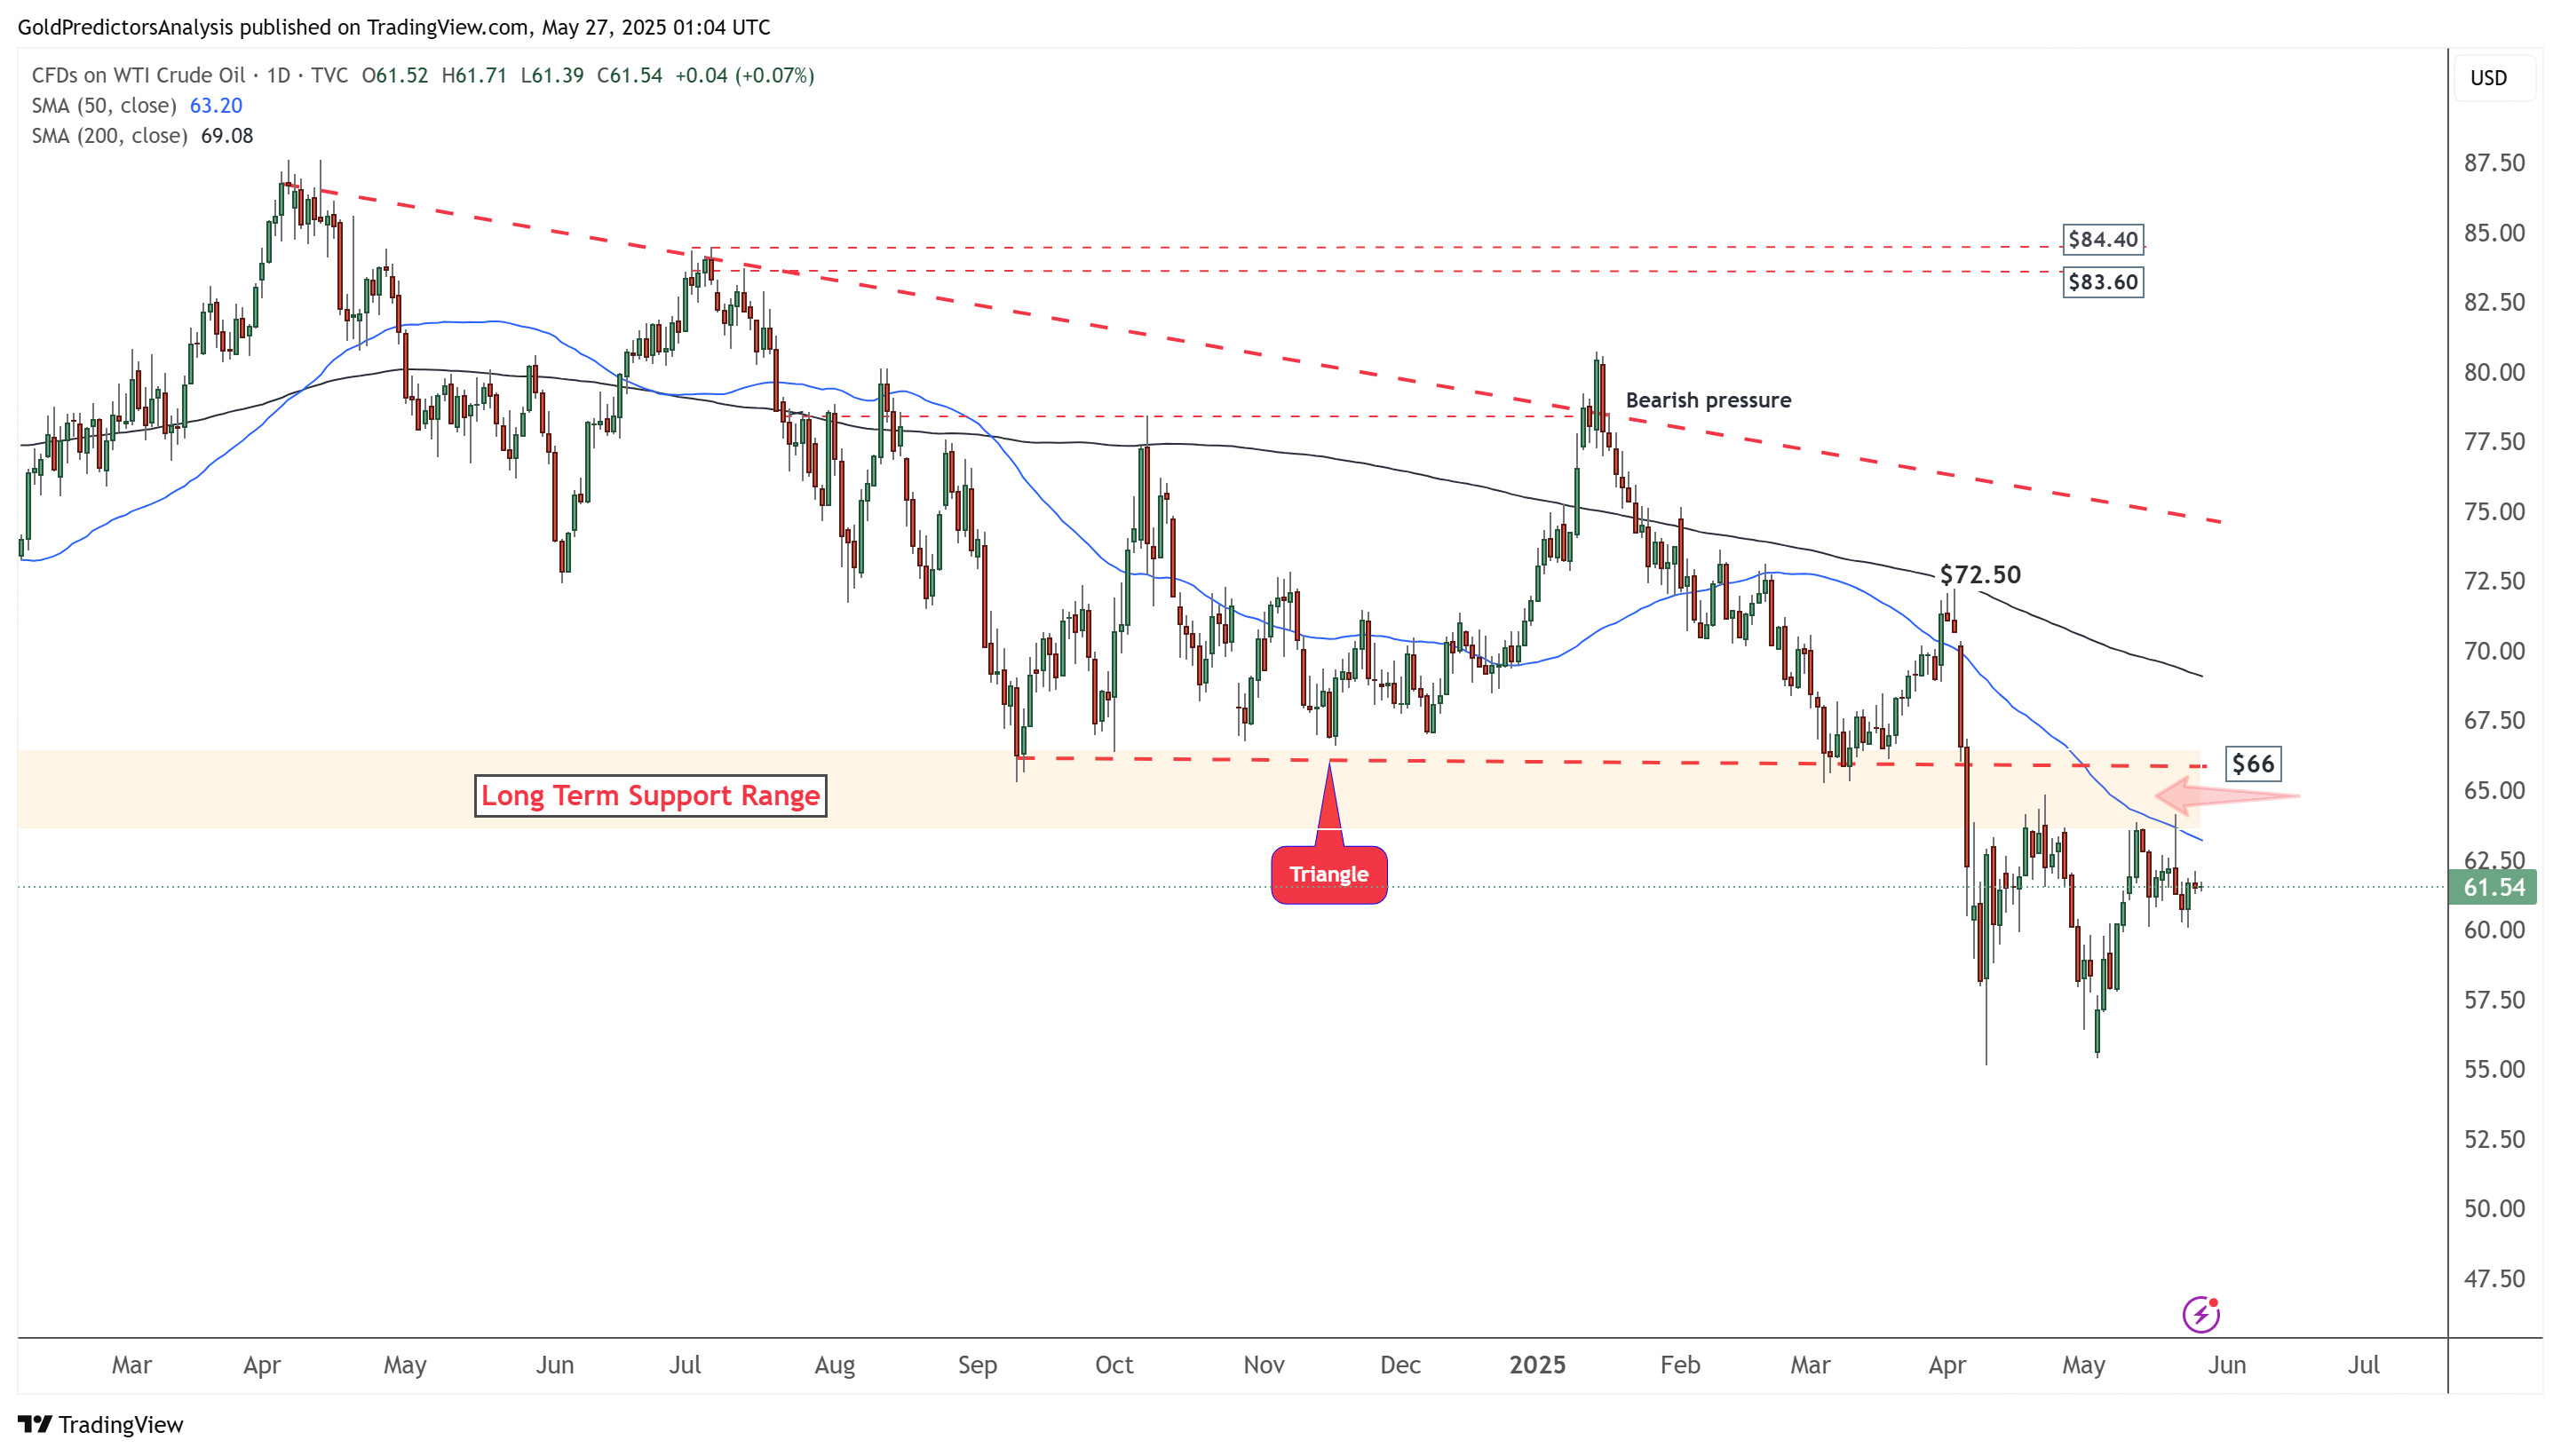
The daily chart for WTI crude oil shows that the price remains under bearish pressure after rejecting the 50-day SMA. It is now trading below the orange zone, which has been defined as a long-term pivotal area. Bearish pressure will continue if WTI fails to break above the $66 level. If the price remains below this resistance, it may decline to $55. A break below $55 would signal a potential move toward the $50 area.
WTI Oil 4-Hour Chart – Descending Broadening Wedge
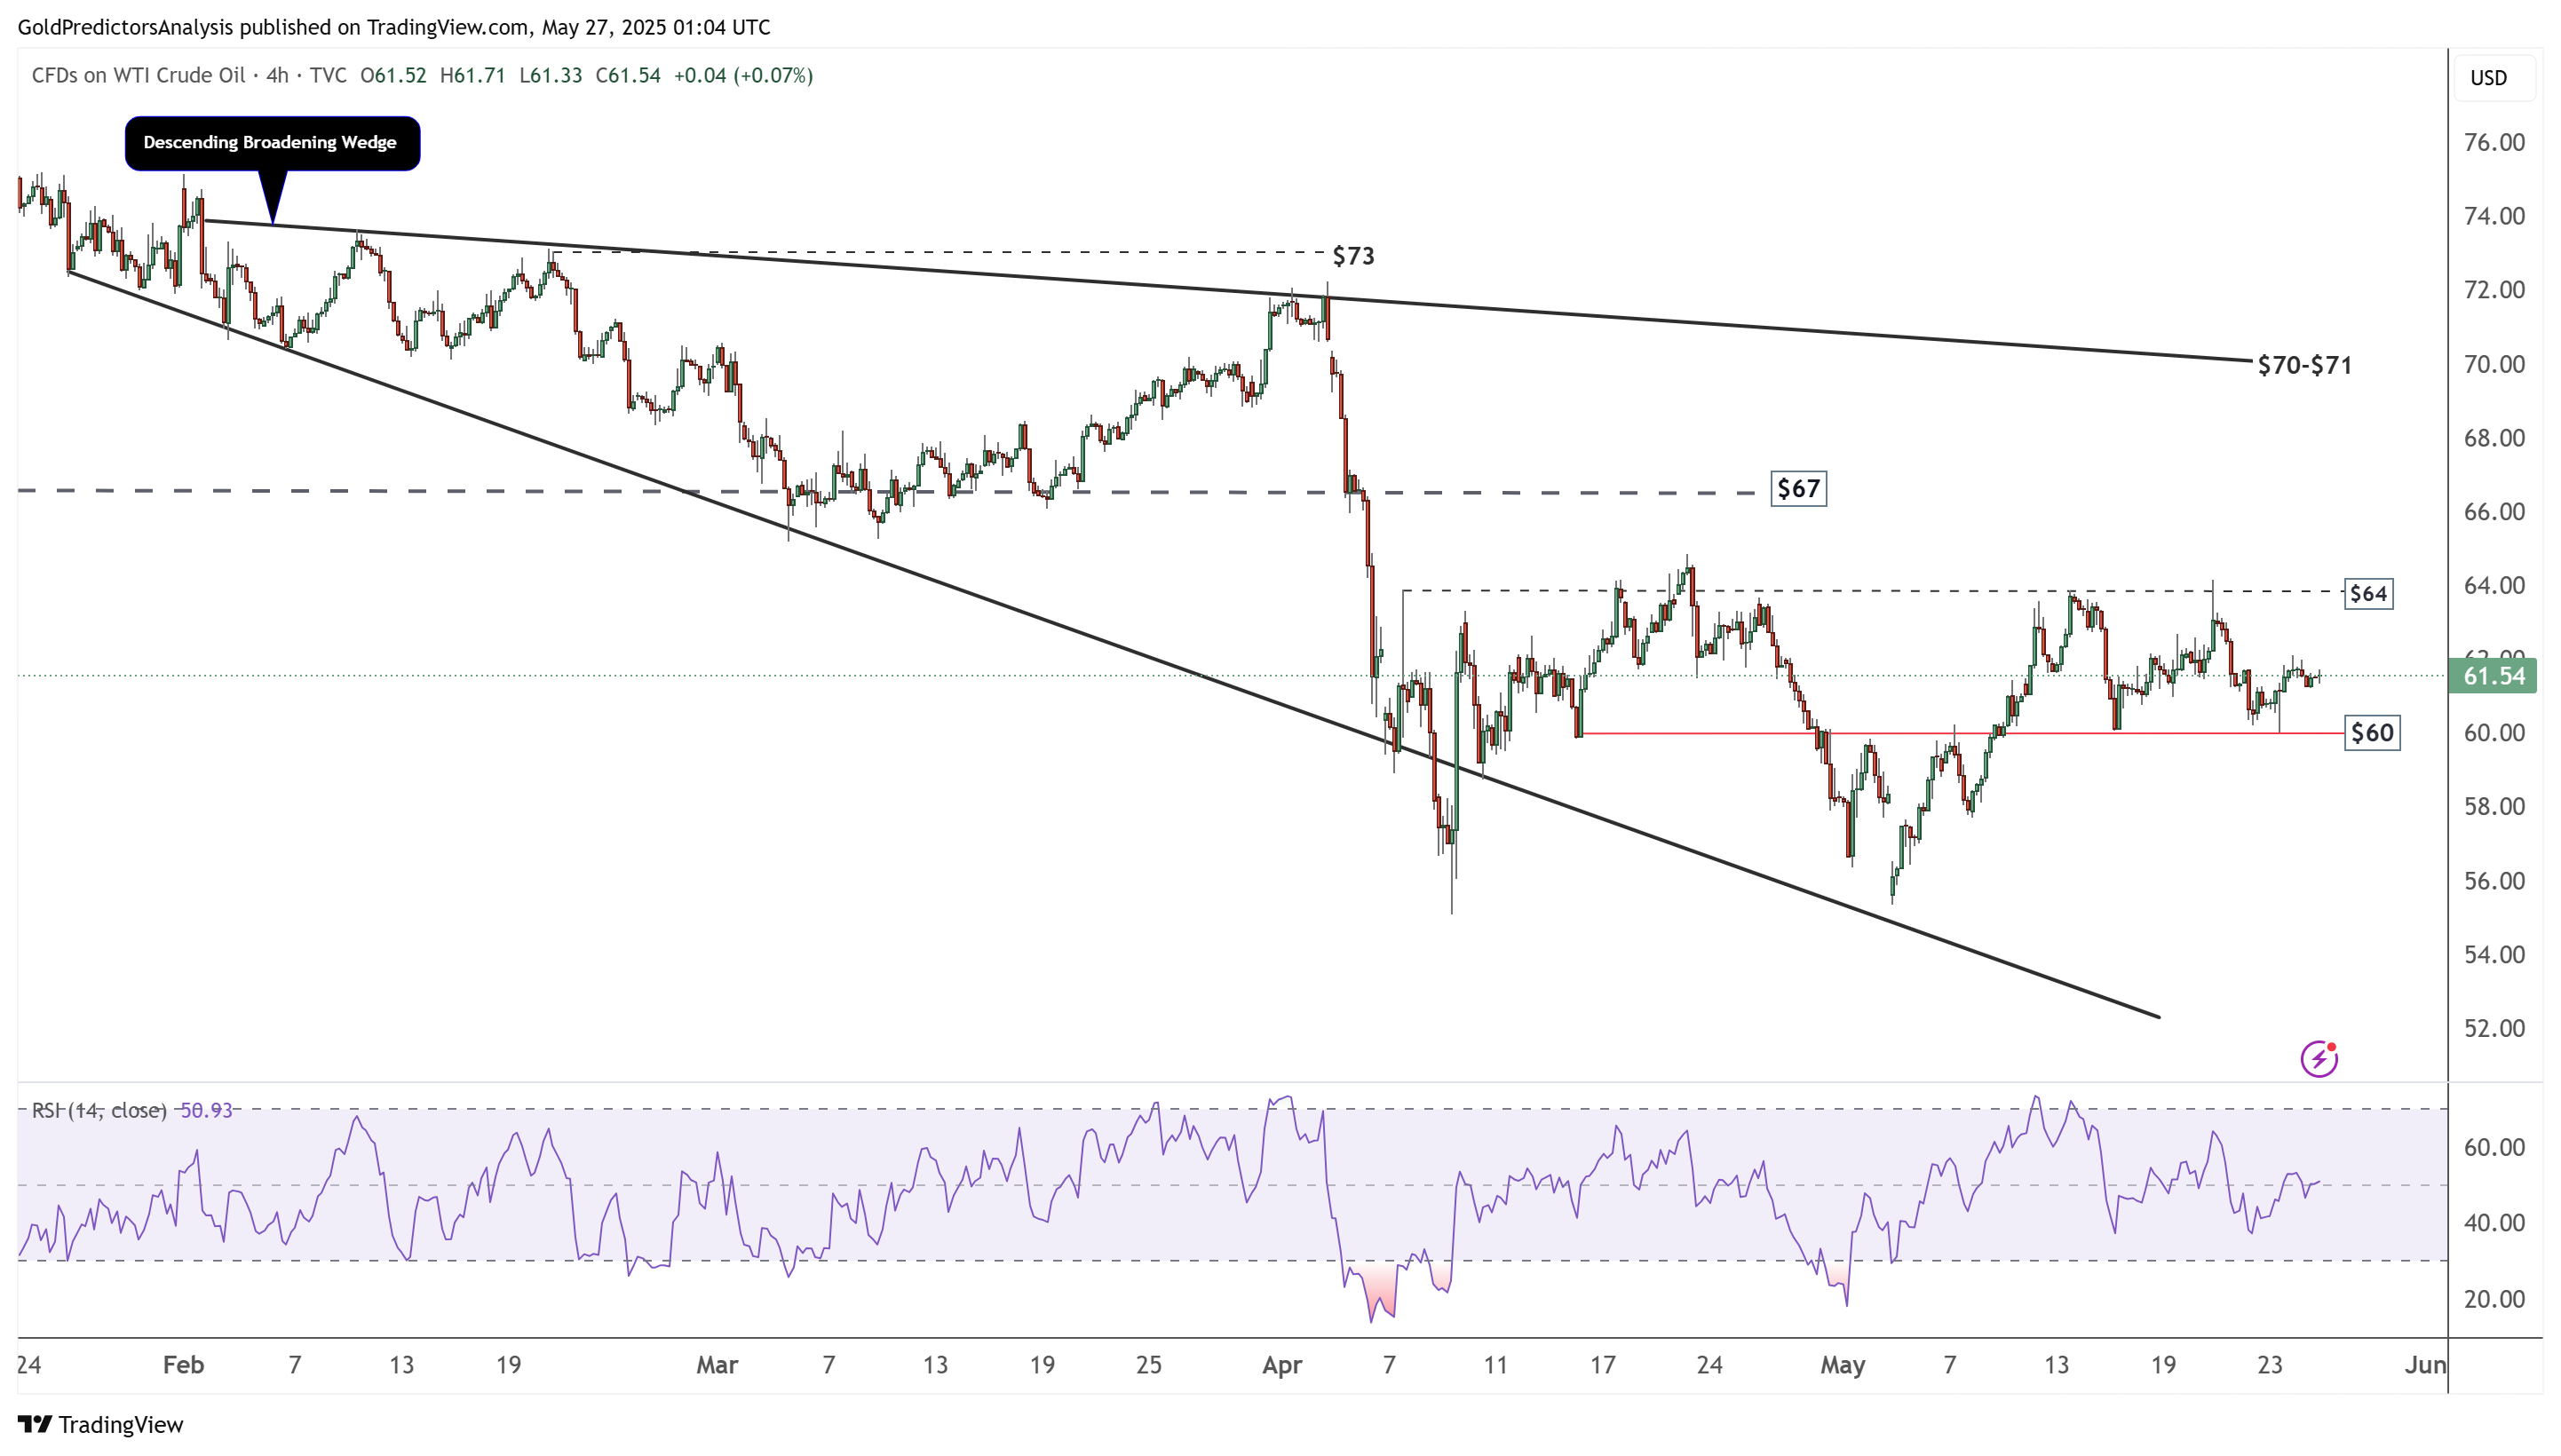
The 4-hour chart for WTI crude oil shows that the price is trading within a descending broadening wedge pattern. It is consolidating between the $60 and $64 levels, and a breakout from this range will likely determine the next direction. A break above $64 would signal upward momentum toward the $70 level, while a break below $60 would indicate continued downside toward lower price levels.
Natural Gas (NG) Technical Analysis
Natural Gas Daily Chart – Consolidation
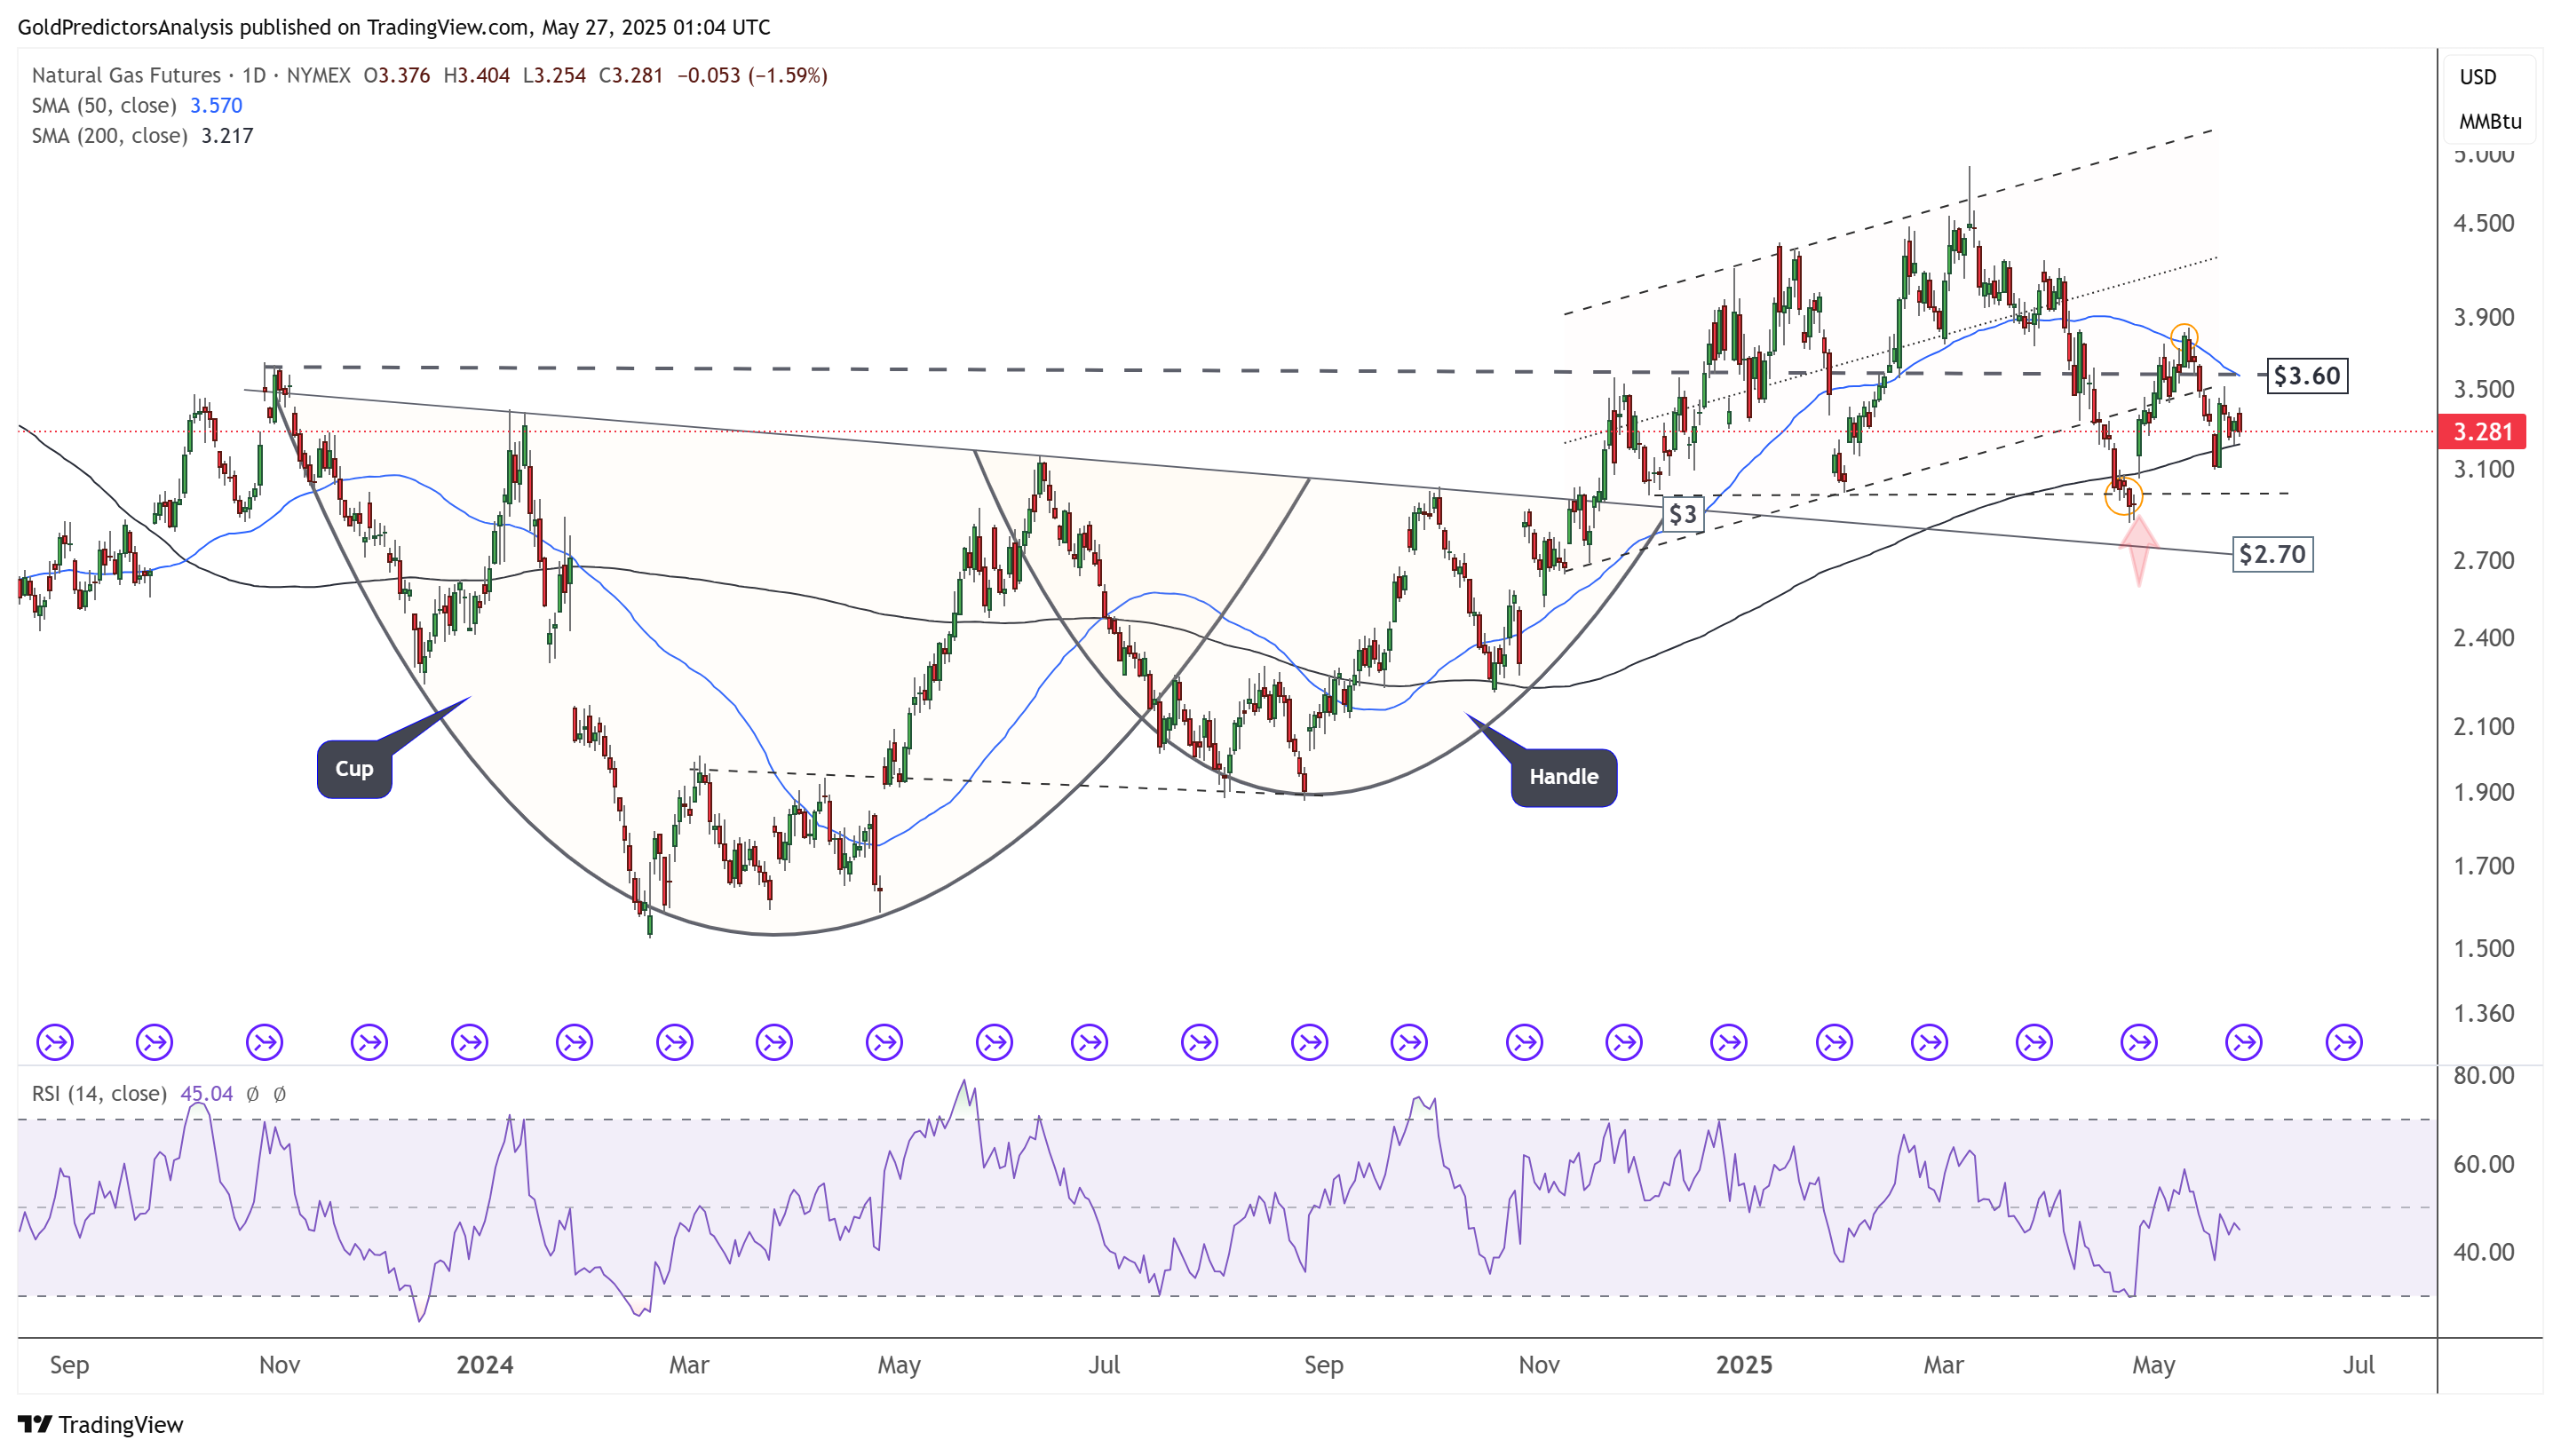
The daily chart for natural gas (NG) shows that the price is consolidating below the 50-day SMA. The consolidation between the 50-day and 200-day SMAs indicates sideways momentum. However, the upward trend will likely continue if the price stays above $2.70. A break below $3.00 would signal a downward move toward the $2.70 area.
Natural Gas 4-Hour Chart – Consolidation
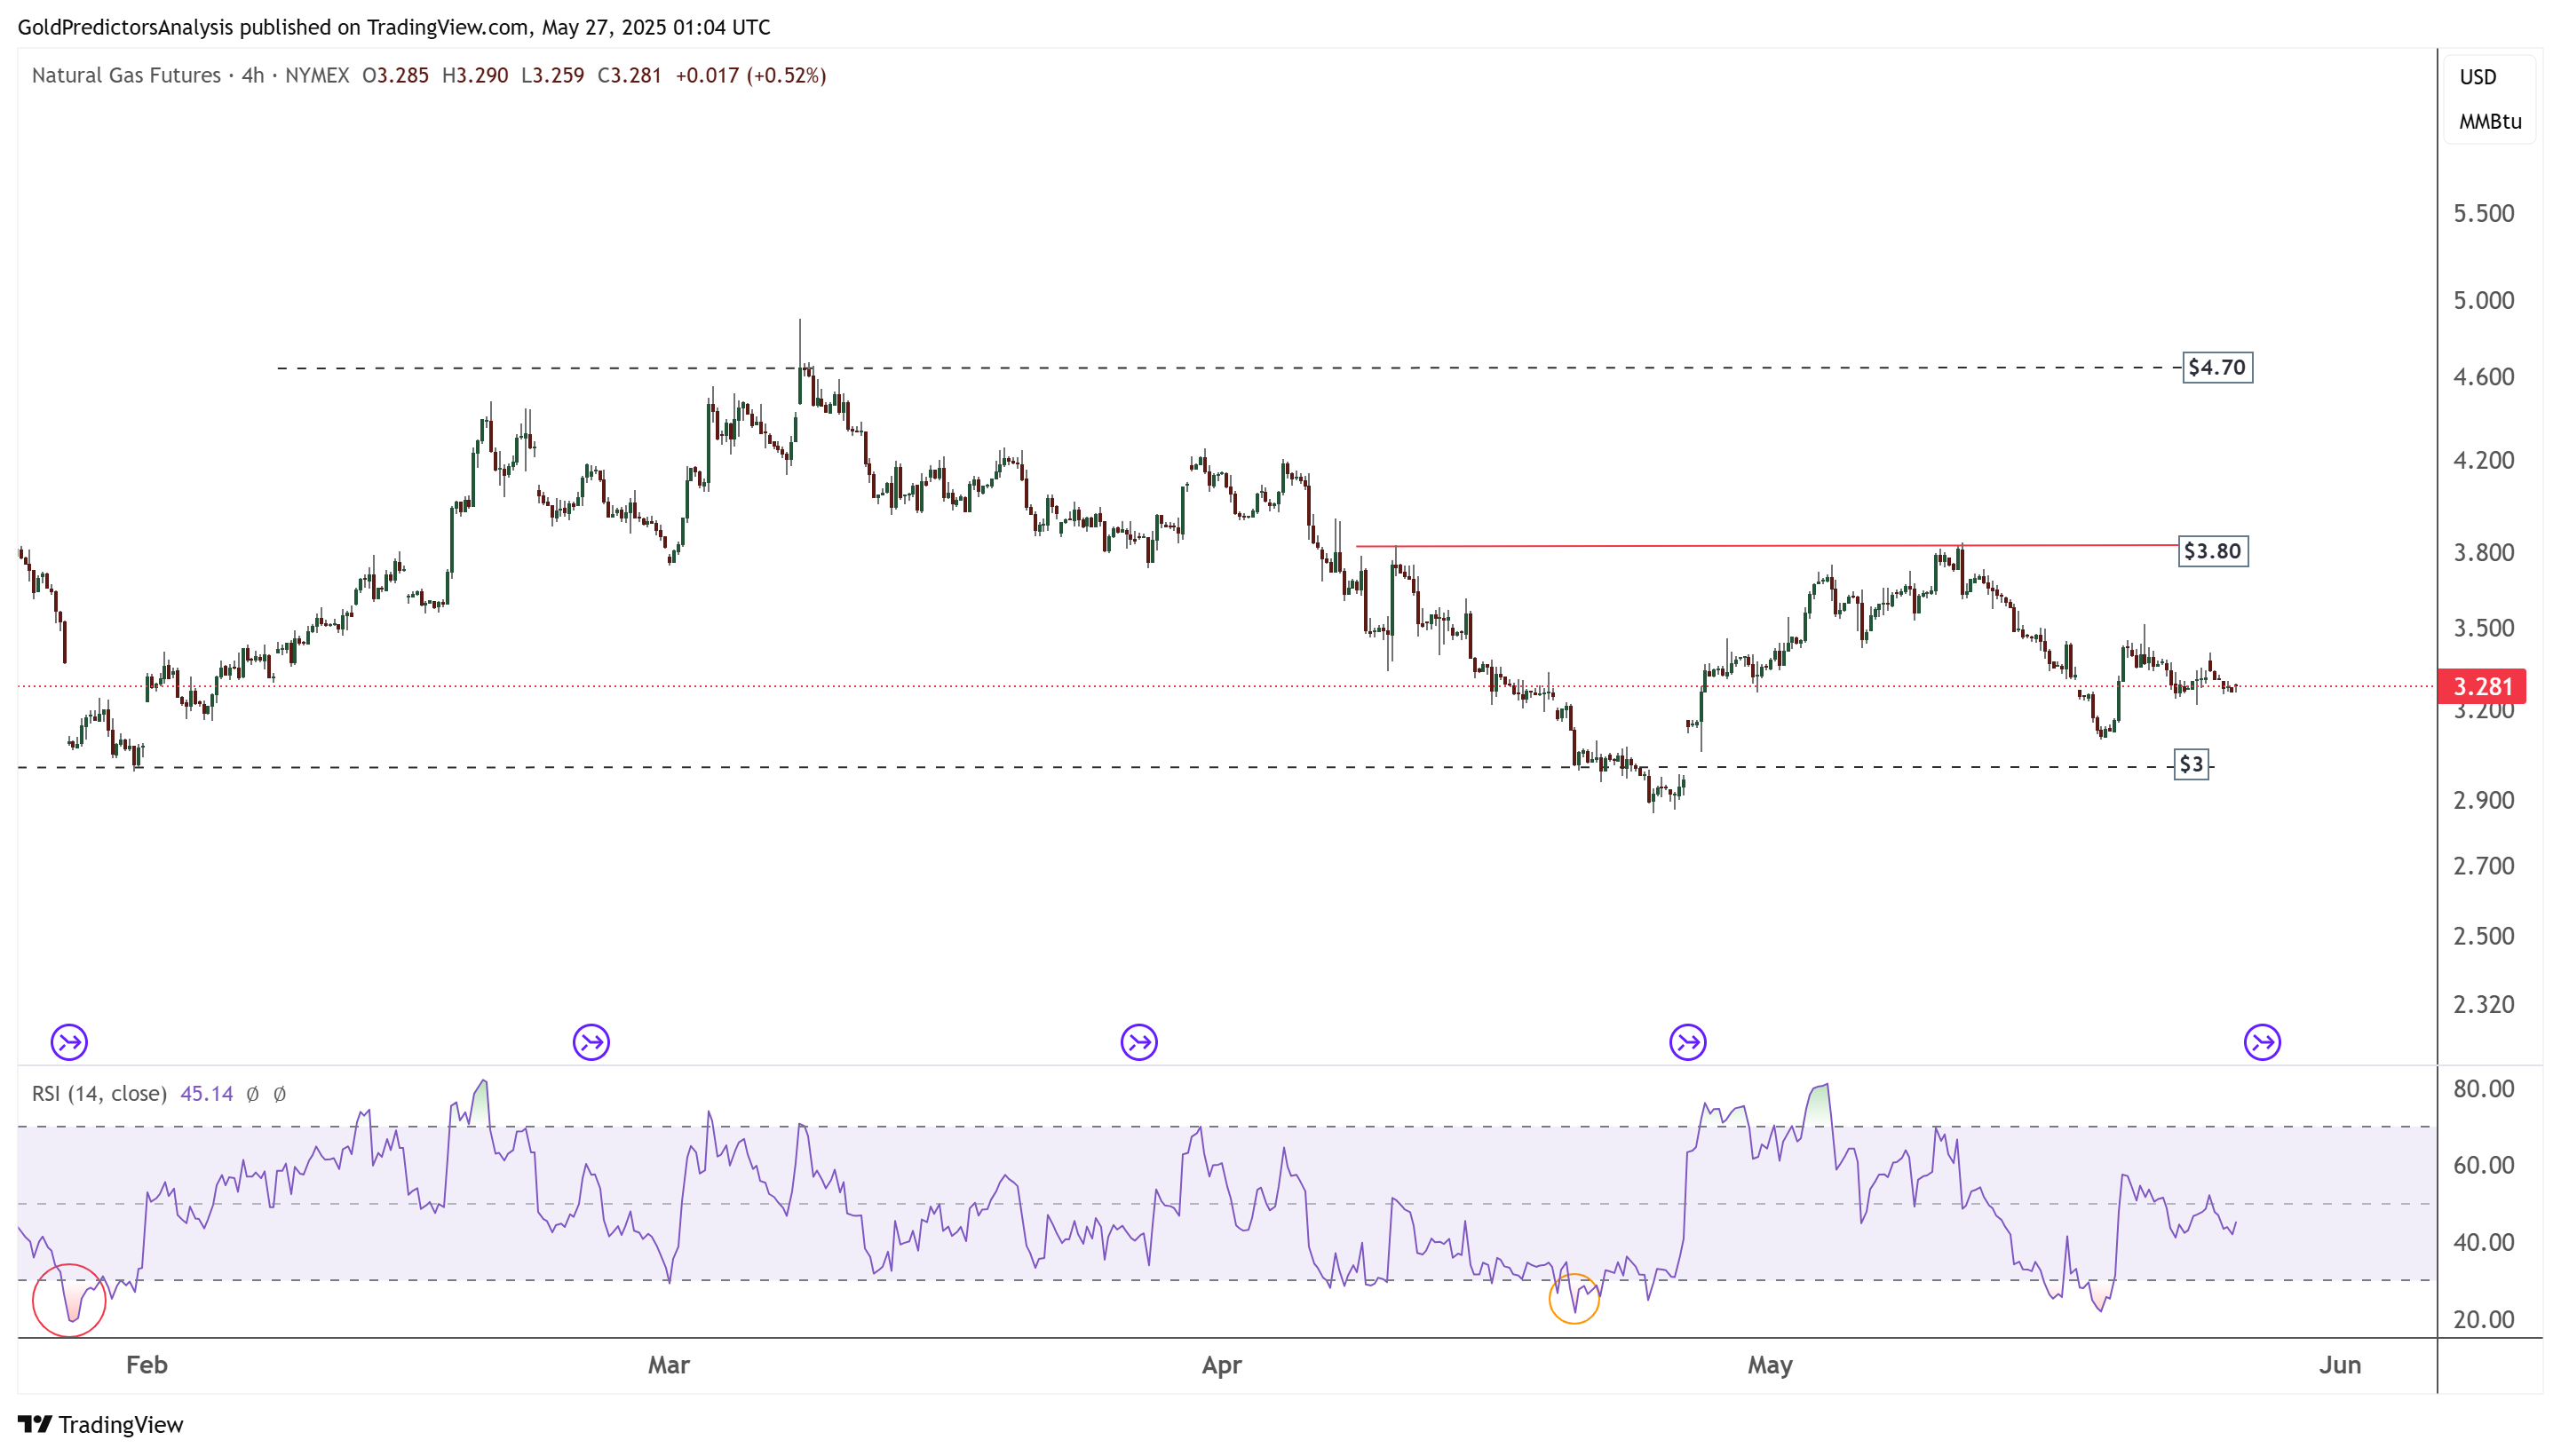
The consolidation in natural gas prices is also evident in the 4-hour chart below. The price is trading within a range of $3.00 to $3.80. A break above $3.80 would indicate further momentum toward $4.70. However, a clear break above $4.70 must confirm sustained upside momentum in natural gas prices.
US Dollar (DXY) Technical Analysis
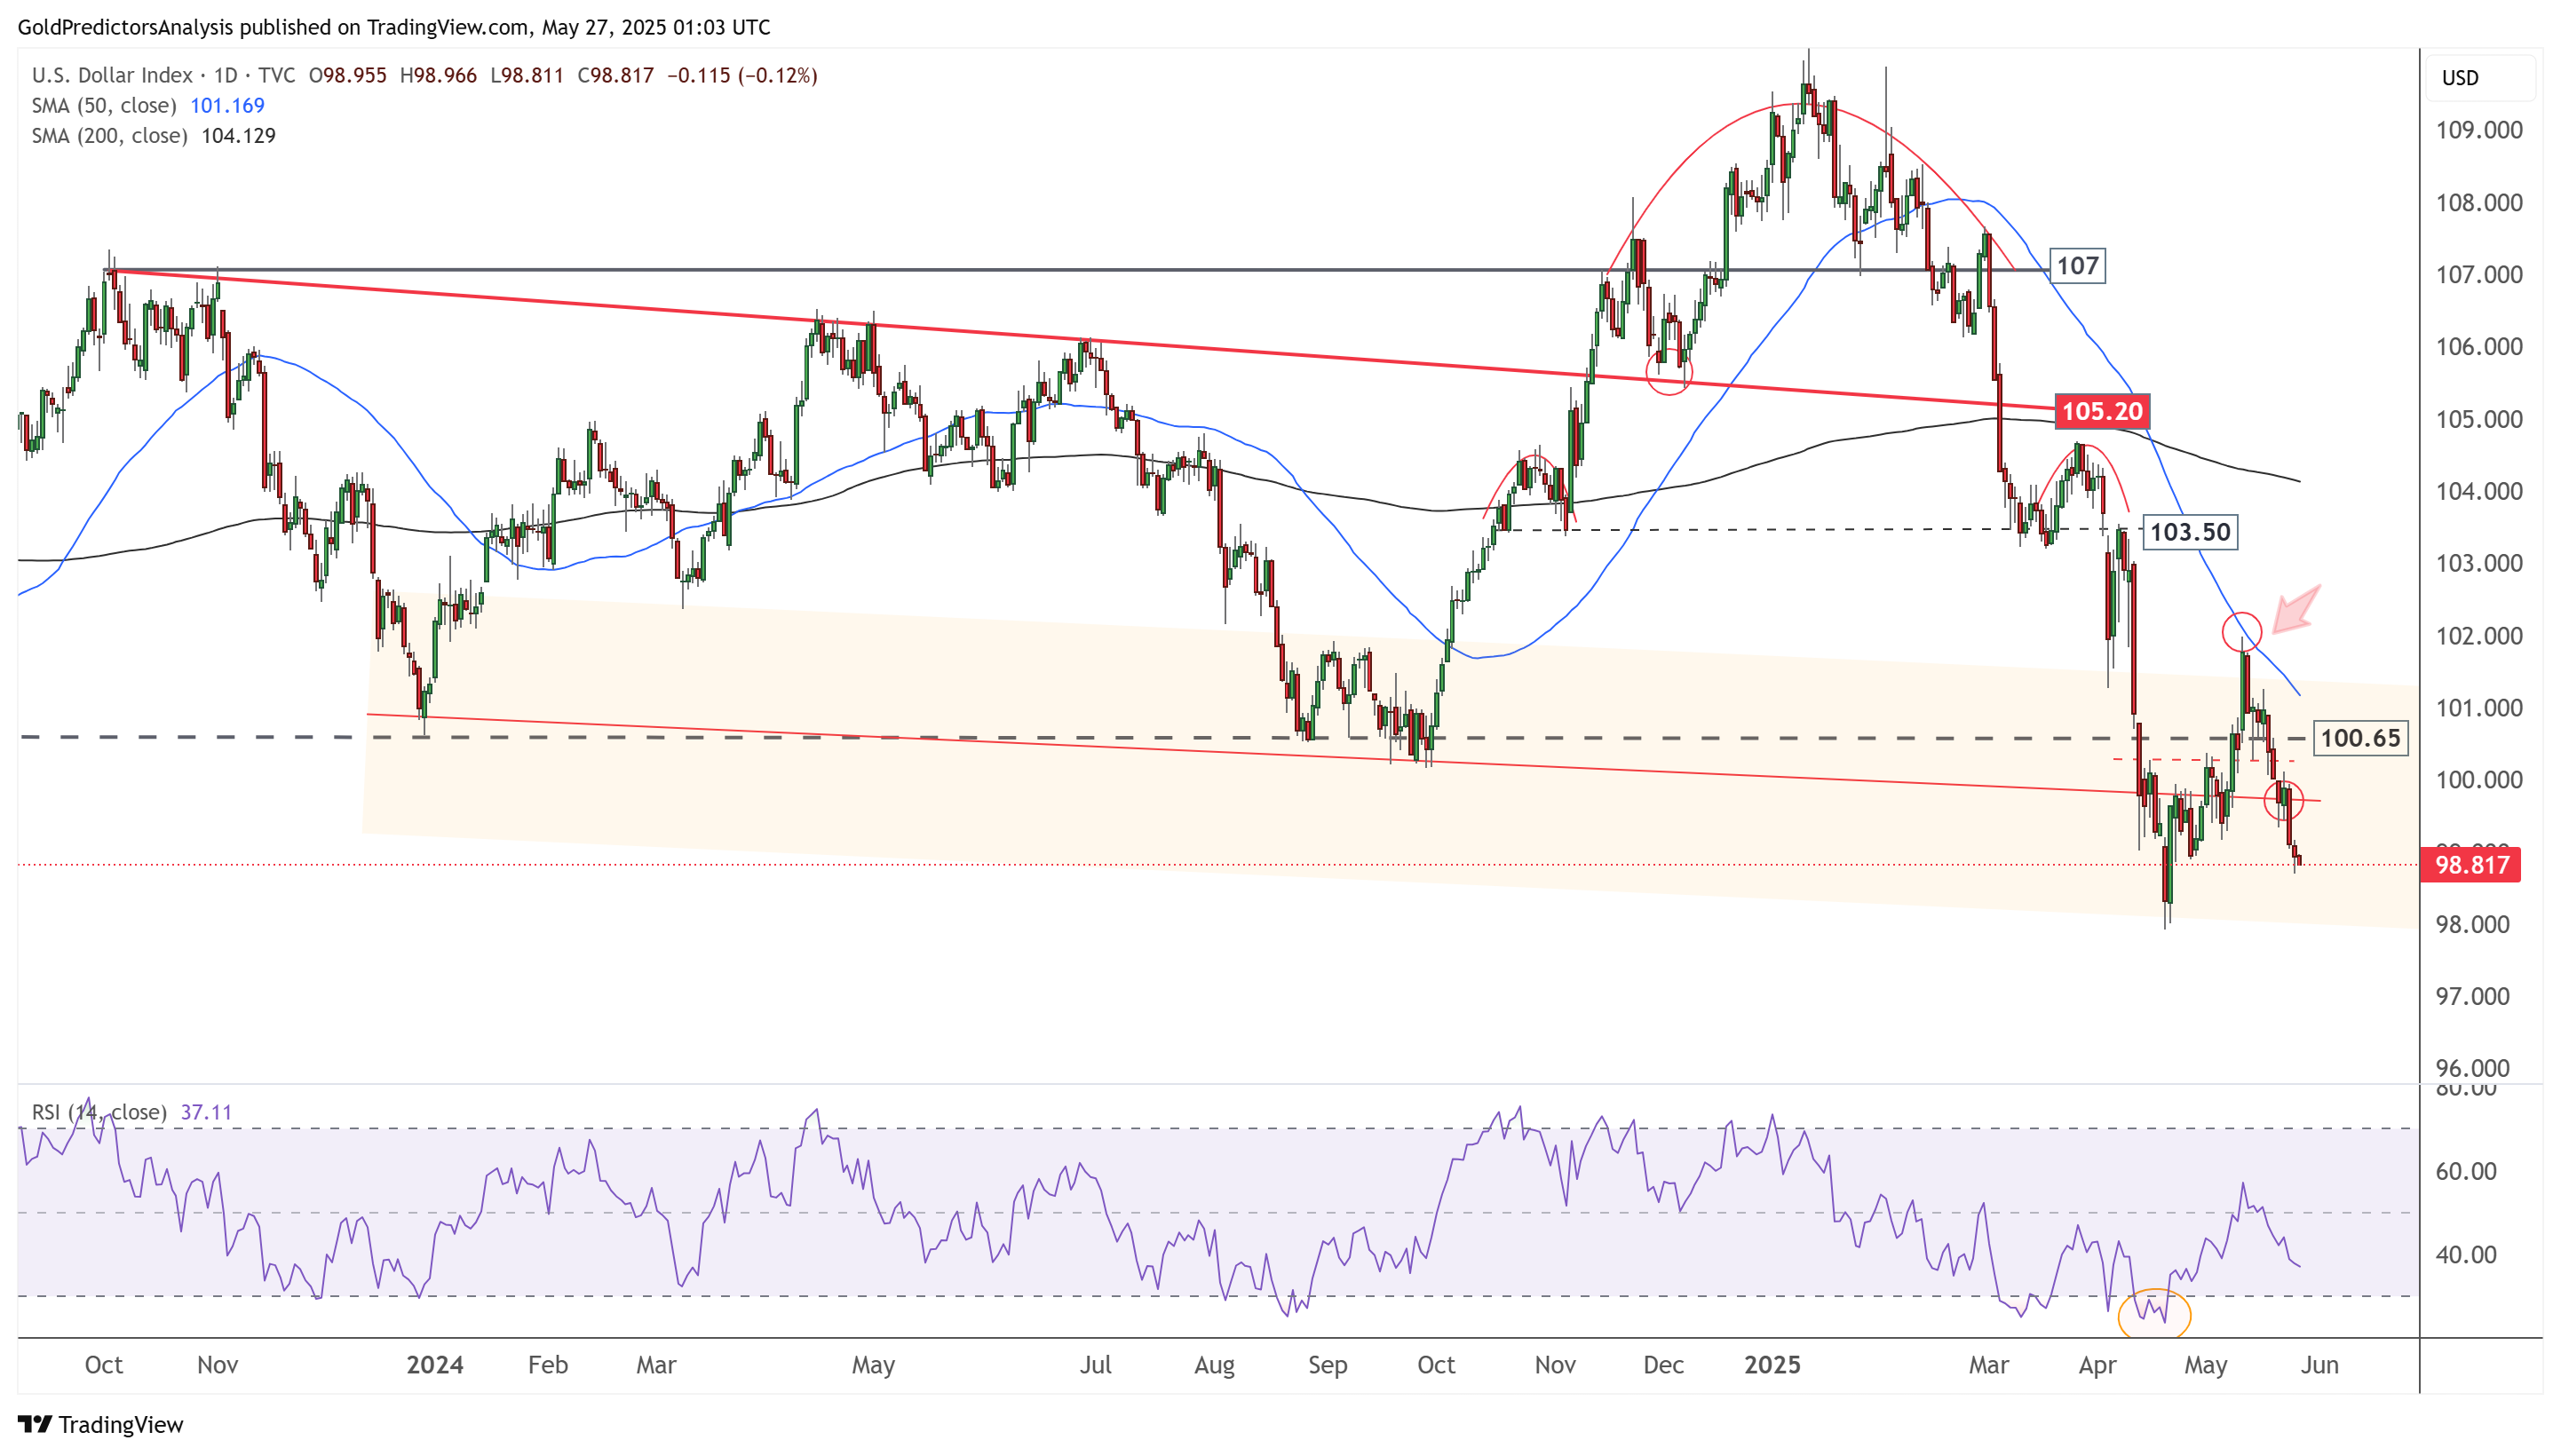
US Dollar Daily Chart – Bearish Pressure
The daily chart for the USD Index shows that the index is trading under strong bearish pressure. The failure to break above 102, near the 50-day SMA, has pushed the index toward the 98 region. A break below 98 would signal a further downside toward 96. If the index breaks below 96, the decline will likely continue toward the 90 area.
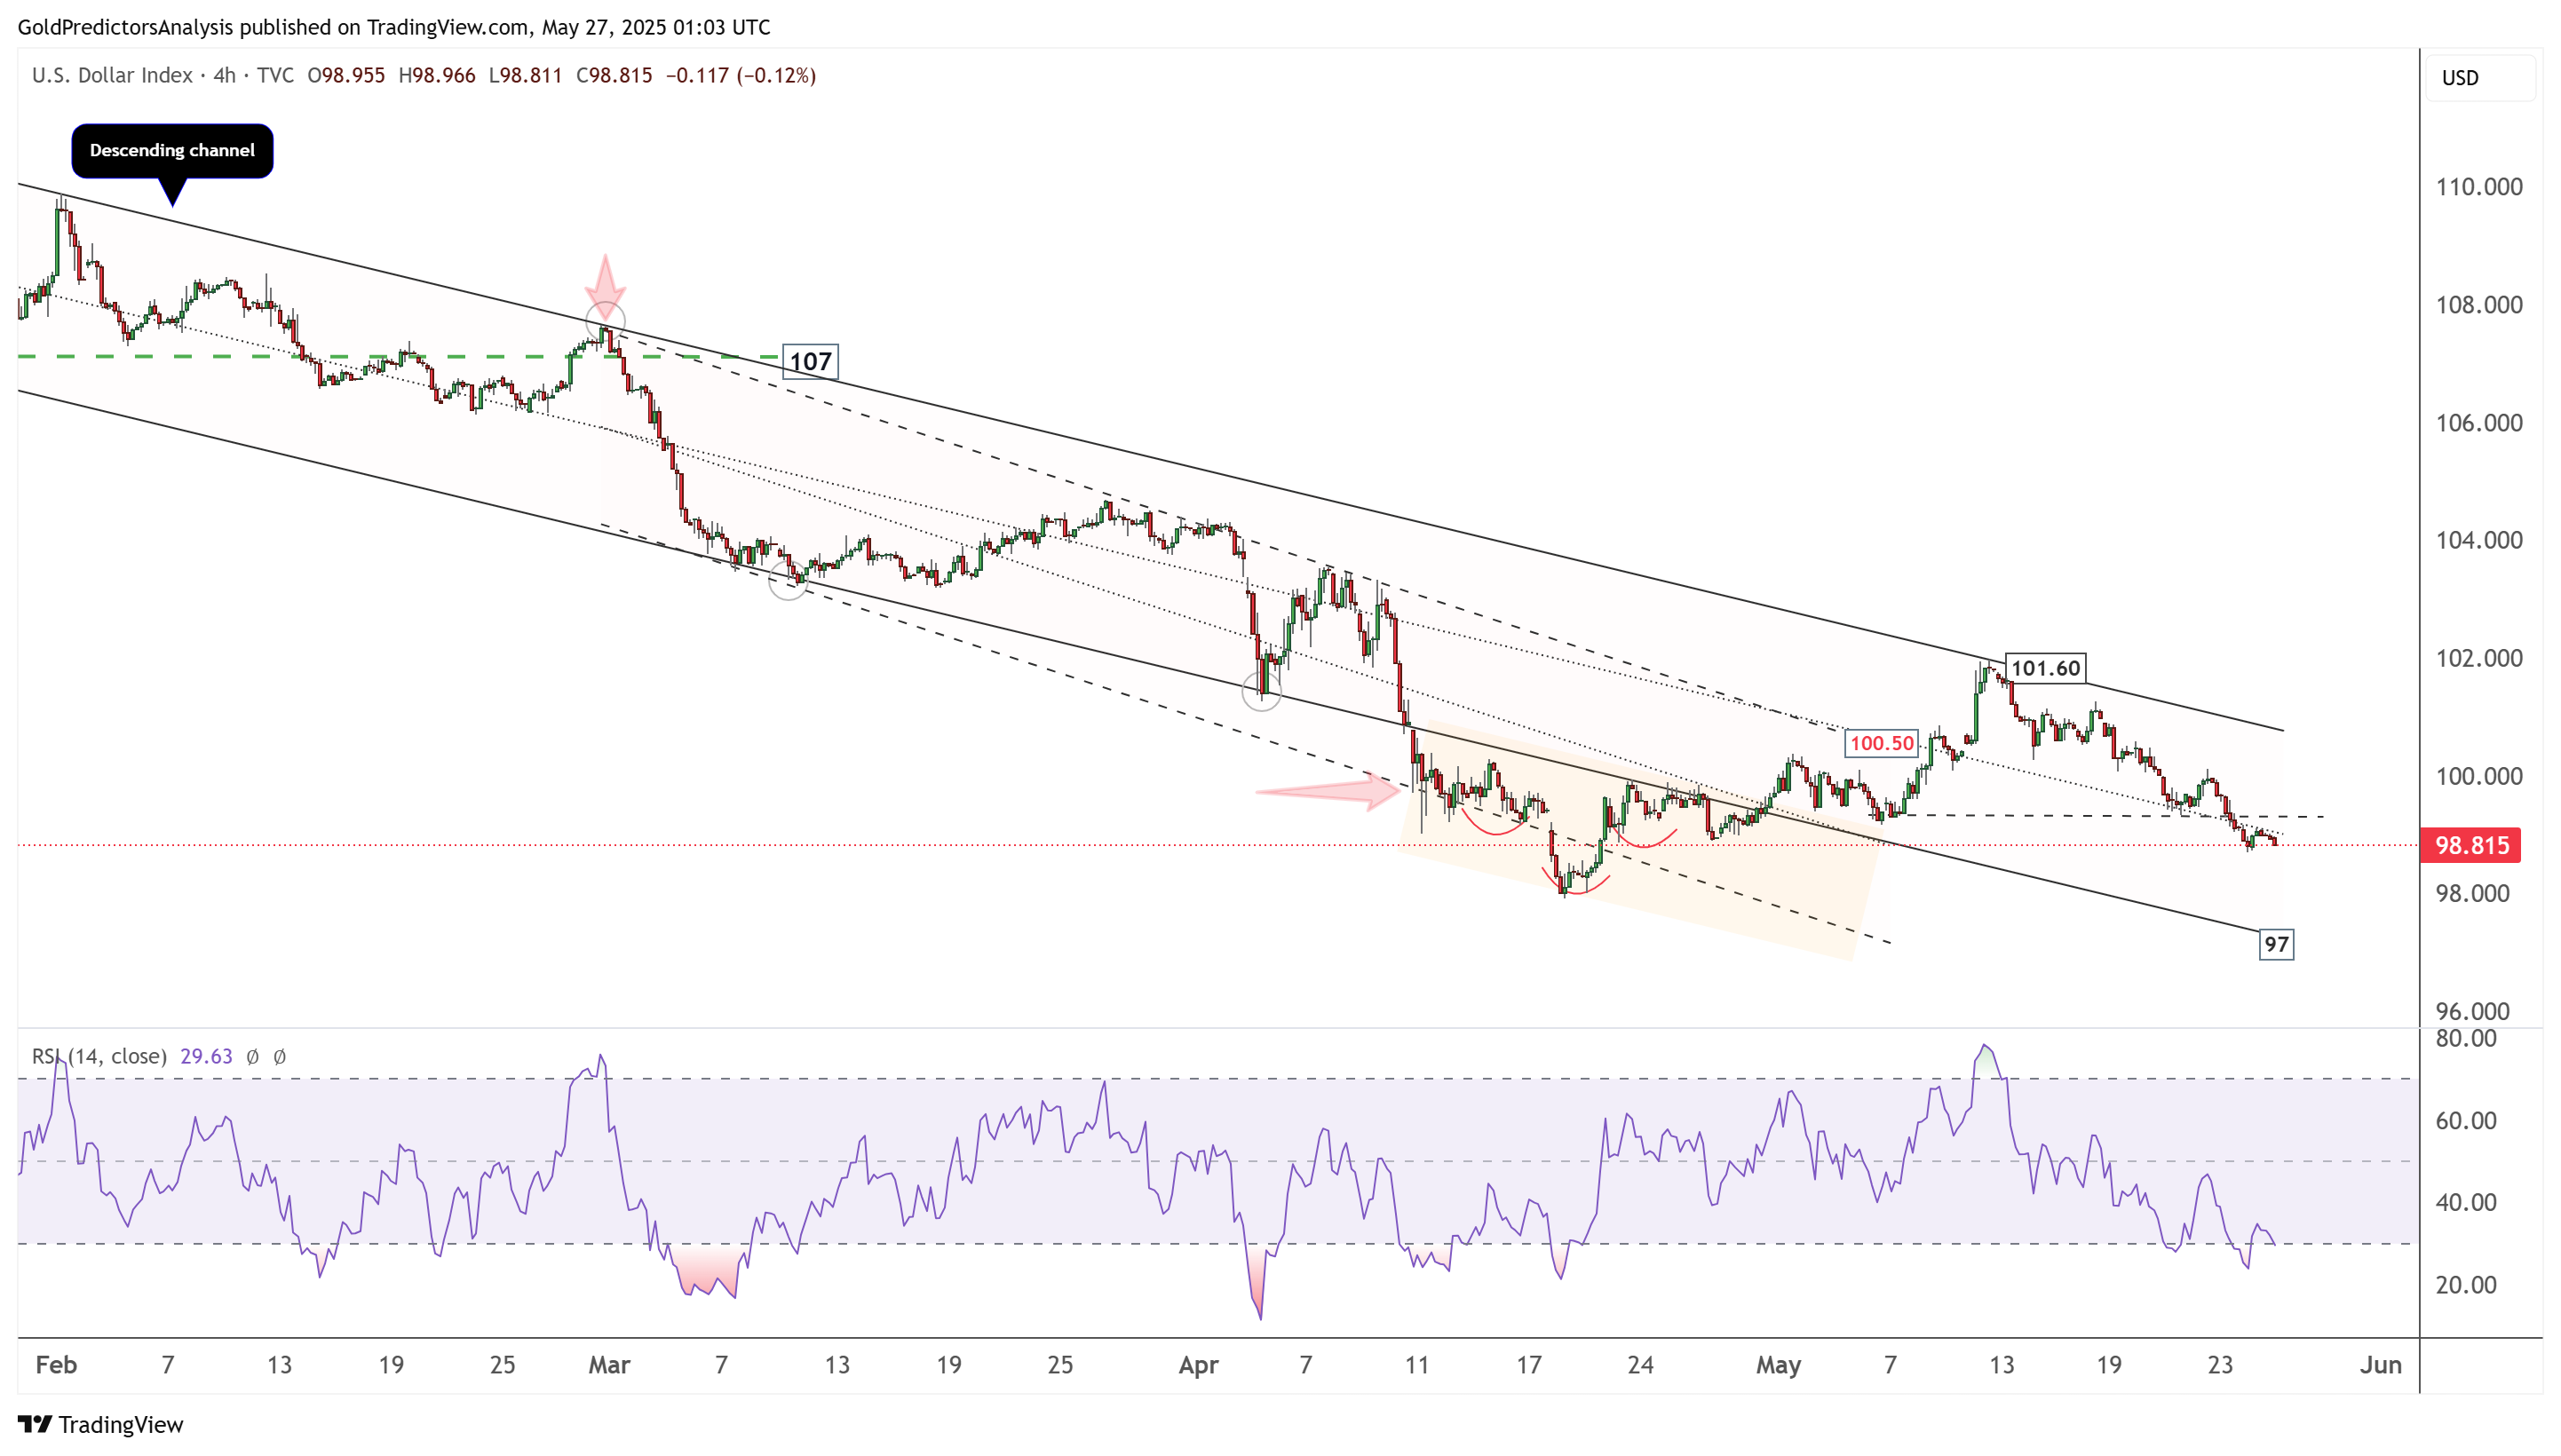
US Dollar 4-Hour Chart – Bearish Pressure
The 4-hour chart for the US Dollar Index shows that the index is trading under bearish pressure within a descending channel. It failed to break above the resistance at 101.60 and continued to move lower. Strong support lies near the 97 area, which aligns with the lower boundary of the descending channel.
About the Author
Bob MasonChief Crypto Boss
123456789 30 He has written extensively for a broader audience and his current focus is on developments relating to the financial markets including, but not limited to currencies, commodities, alternative asset classes, and global equities.


Advertisement