
Advertisement
Advertisement
Quant Price News: Can ECB Collaboration Announcement Make QNT Retest $170?
By:
Key Points:
- Quant was picked by the European Central Bank to participate in its digital euro project.
- QNT’s demand is influenced by the adoption of the project’s Overledger platform.
- QNT could rise to $170 again if a bullish inverse head and shoulders pattern is confirmed.

Alongside another 70 companies, Quant was selected to provide the infrastructure required for a P2P platform that allows users to transact with the digital euro.
The ECB has been exploring the advantages and risks of a digital currency since 2023 and has selected multiple partners to test the implementation of this type of currency in the European Union recently.
Digital Euro Could Boost the Demand for QNT
According to a statement about the program’s selected partners, the ECB said: “Pioneers will be exploring how to integrate the simulated digital euro interfaces with their platforms.”

The demand for QNT is influenced by the adoption of its Overledger payments solution – a proprietary decentralized ledger technology that facilitates peer-to-peer remittances.
If Quant is ultimately picked as a key piece of the puzzle for the official launch of the digital euro, this could have massive implications for the project’s credibility and adoption by prospective clients – including countries – who may be exploring the possibility of developing similar platforms and solutions.
In the past 24 hours, QNT has gone up by nearly 16% as trading volumes have exploded by 400%.
This may have caused a big short squeeze as QNT dropped from around $170 to $60 per token from December to April.
The crypto market’s overall recovery, paired with this project-specific bullish news, seem to have drawn significant demand for the token. Can these tailwinds lift QNT to $170 again?
Inverse H&S Pattern Supports Push to $170
Looking at the daily chart, QNT has been approaching a key resistance at $115. A few months ago, selling pressure was strong at these levels.
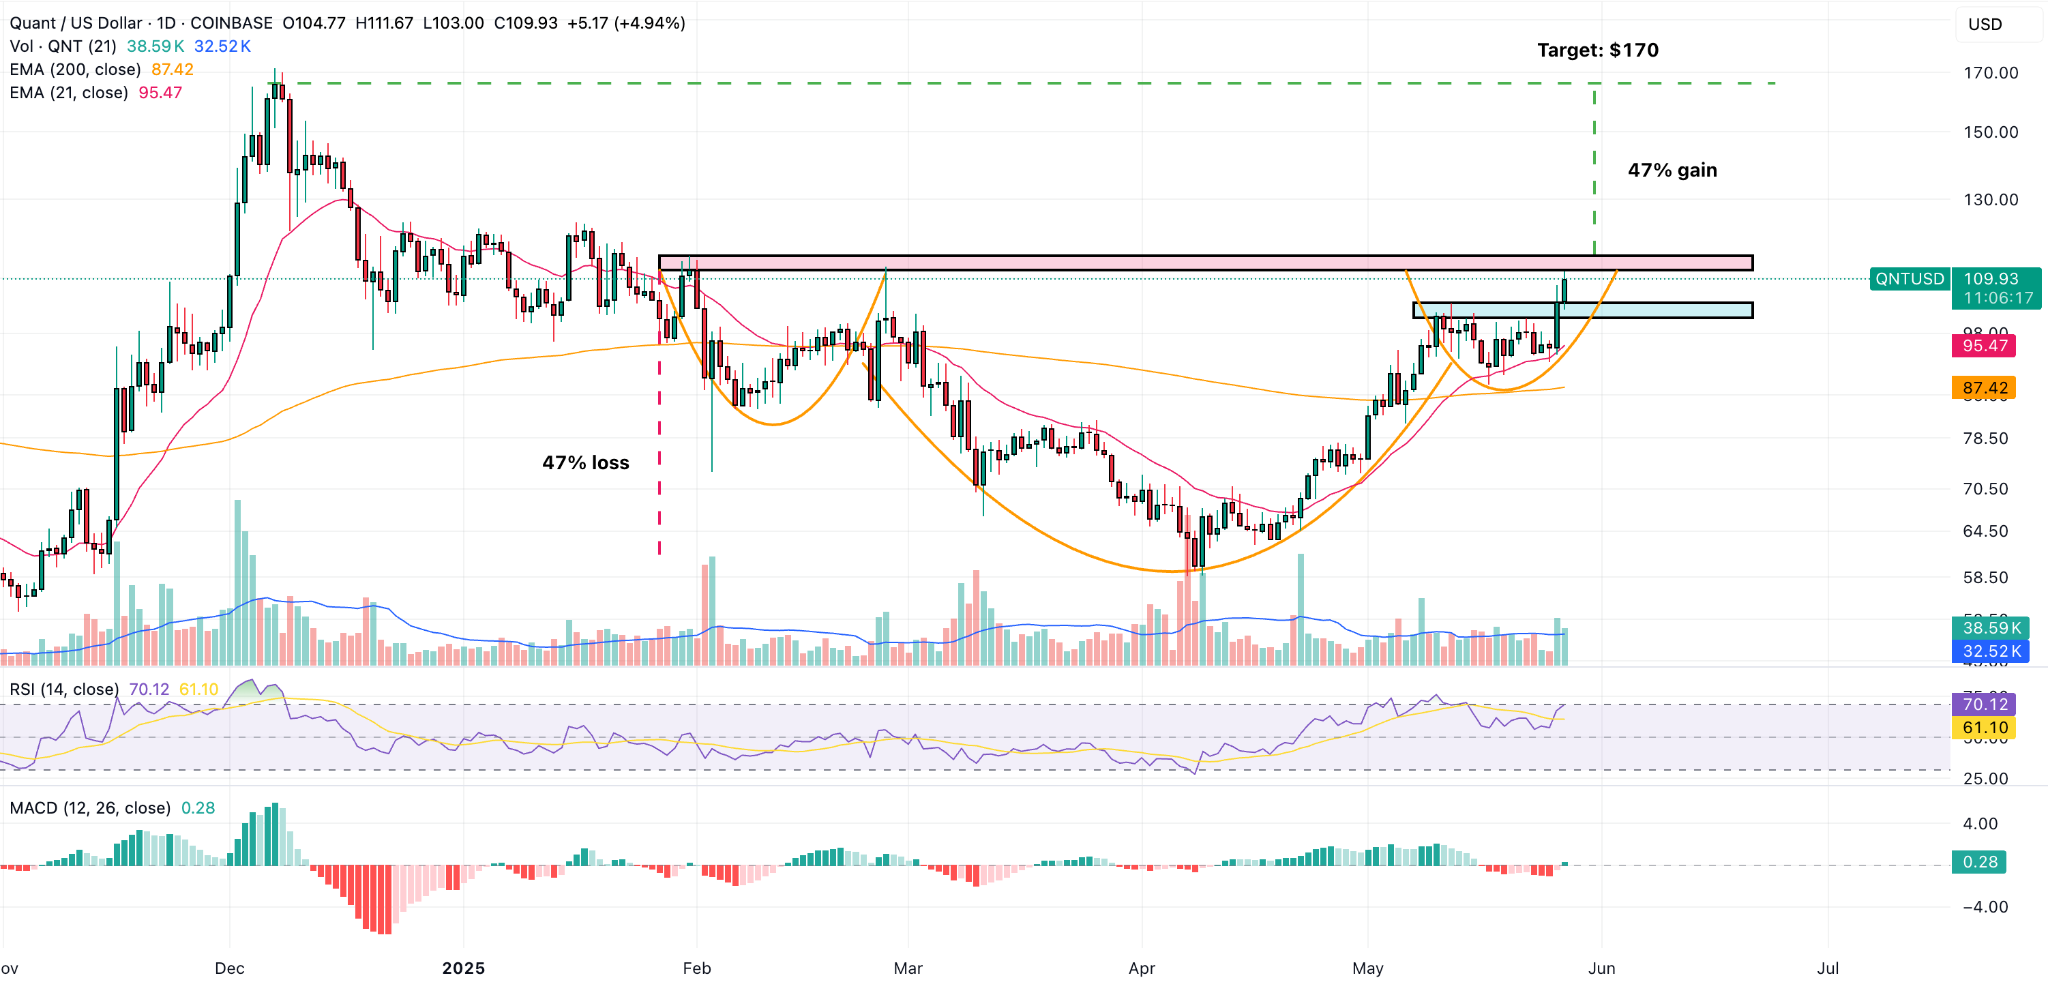
However, the token just broke above the $105 area – its nearest higher high – as the rally regained steam in the past couple of days.
Trading volumes have been above the average in the past 48 hours or so, which favors a bullish short-term outlook following such a strong breakout.
The $105 level has now turned into the key support to watch down the road for QNT. Meanwhile, the token’s volume profile shows that the $90 – $100 level has also drawn significant volumes. These are, then, the key supports to watch in case of a pullback.
Momentum indicators show that the uptrend is still quite strong as the Relative Strength Index (RSI) currently sits at 70 and has just entered overbought levels.
The daily chart also shows a potential inverse head and shoulder’s pattern forming as a result of the price action of the past few months.
If this pattern is confirmed by a breakout of the neckline – which stands at $115 – it could result in a 47% short-term gain that matches the height of the pattern’s head.
This means that QNT could rise to $170 based on what technical indicators are pointing out at the time.
About the Author
Bob MasonChief Crypto Boss
123456789 30 He has written extensively for a broader audience and his current focus is on developments relating to the financial markets including, but not limited to currencies, commodities, alternative asset classes, and global equities.


Advertisement