
Advertisement
Advertisement
Silver (XAGUSD) Price Forecast: XAG Breaks Out, Targets $37 in Bullish Continuation
By:
Monday’s breakout above $34.59 signals bullish continuation in silver, with strong demand and support levels setting the stage for a potential rally toward $37.05.
Silver broke out of an eight-day tight consolidation pattern on Monday and spiked to a high of $34.74 with conviction. The advance showed strength by establishing a wide range green candle and breakout above the secondary high of $34.59 from late-March. Also, notice that support for the day at $32.96 was a successful test of the 20-Day MA. This was not the first time that an intraday launch from support around the 20-Day line began a sharp move.
Buyers remain in charge at the time of this writing and a daily close for Monday looks likely to be near the highs of the day. A daily close above the $34.59 price level would further confirm the strength of the breakout above the prior high and give a new bullish indication. That would set silver on a path to challenge and possibly exceed an initial trend high of $34.87 that was established in October.
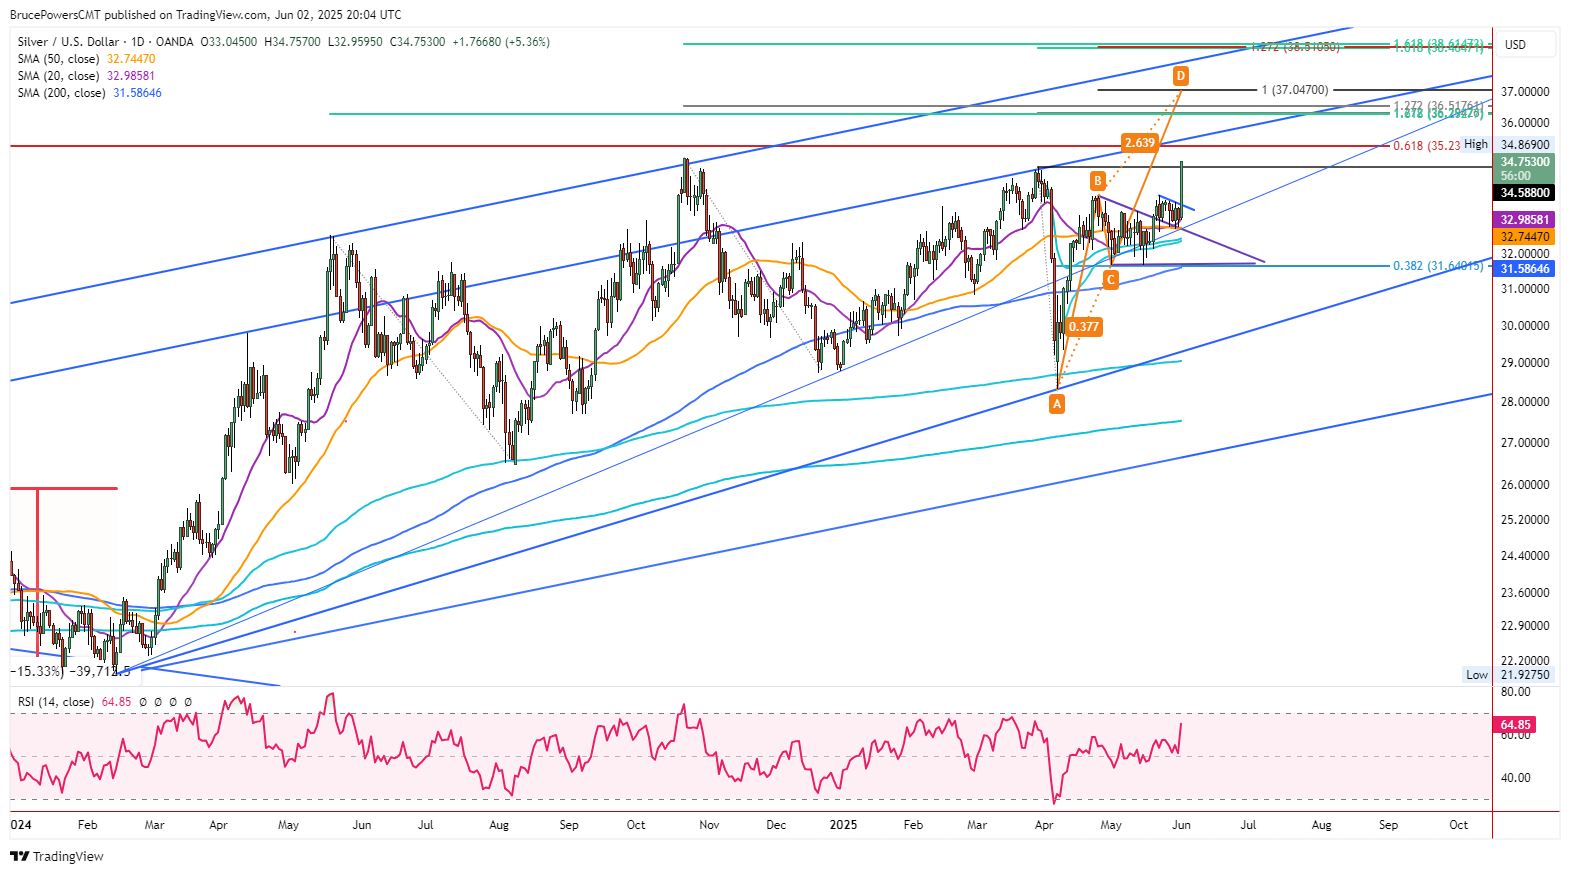
Demand Spike May Return
Indications of strong demand that followed the recent higher swing low at $28.32 generated in early April may return. The price of silver rallied to an initial trend high of $33.68 following that low, thereby ending a sharp $5.36 or 18.9% advance in just 11 days. Today’s advance triggered a consolidation breakout and a continuation of a rising ABCD pattern. A daily close above the $33.70 high confirms the continuation of the ABCD pattern that began from the April swing low (A) and it will establish a higher swing high. An initial potential target of $37.05 is suggested by the pattern.
Bulls Take Back Control
Notice that the fractal nature of the market is represented by the two recent consolidation patterns. The bull breakout today is from a small tight pattern that has a similar shape. It was created around support of the top line of a larger descending triangle shaped consolidation pattern that was established at support around the 38.2% Fibonacci retracement. A bull breakout of the pattern was triggered on May 21 and the top boundary line of the pattern along with the 50-Day MA was then successfully tested as support since then. Once prior resistance becomes support, the trend may be ready to continue. That certainly looks to be the case with silver.
For a look at all of today’s economic events, check out our economic calendar.
About the Author
Bruce Powerscontributor
Bruce has been involved in the financial markets for over 20 years, as an analyst, trader, educator, and writer.


Advertisement