
Advertisement
Advertisement
Solana Memecoins TRUMP, FARTCOIN Tank After Pump.fun’s X Ban
By:
Key Points:
- Pump.fun’s X suspension triggered sharp losses in Solana memecoins, with TRUMP and FARTCOIN falling up to 9%.
- FARTCOIN risks a deeper drop to $0.54 if its double top pattern confirms below $0.92.
- TRUMP is testing a falling wedge breakout; success could drive a rally toward $15.50, while failure may send it to $7.34.

Solana-based memecoins plunged on June 17 after X suspended Pump.fun—the launchpad behind dozens of viral tokens—along with accounts tied to its co-founder, Alon Cohen, and several meme communities.
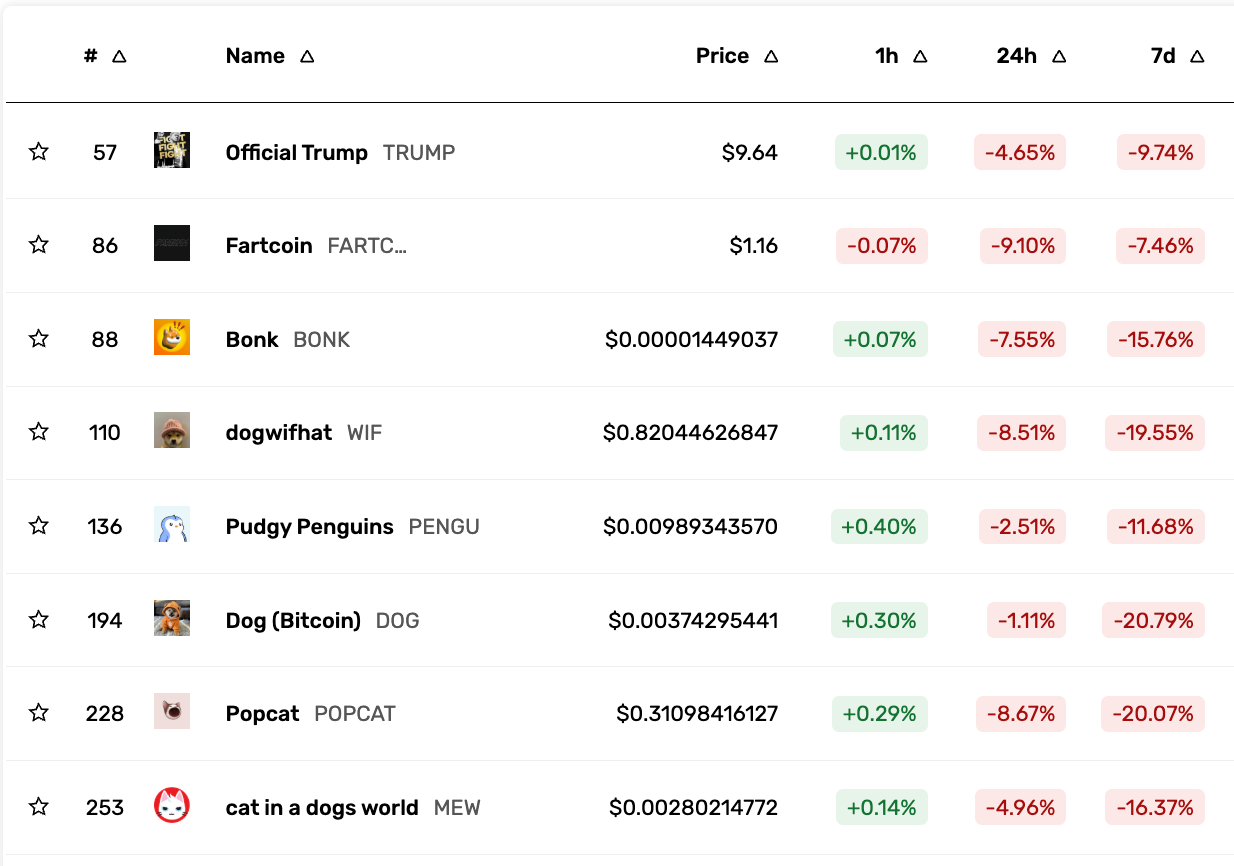
Official Trump (TRUMP), a memecoin launched by US President Donald Trump, was down 4.65% in the past 24 hours, while the second-largest Solana memecoin, Fartcoin (FARTCOIN), dropped by over 9% in the same period.
X did not provide a detailed explanation, but developers suspect violations of API policies. The timing of the ban, just ahead of Pump.fun’s planned $PUMP token sale raises further uncertainty for Solana’s memecoin ecosystem, which relies heavily on X for traction and user growth.
Let’s examine how TRUMP and FARTCOIN may fare amid the growing X-Pump.fun standoff.
FARTCOIN Risks Deeper Correction on Double Top Breakdown
FARTCOIN is holding marginally above its 50-day exponential moving average (EMA), currently near $1.14. However, the memecoin’s latest price action appears to confirm a double top pattern—a classic bearish reversal structure.
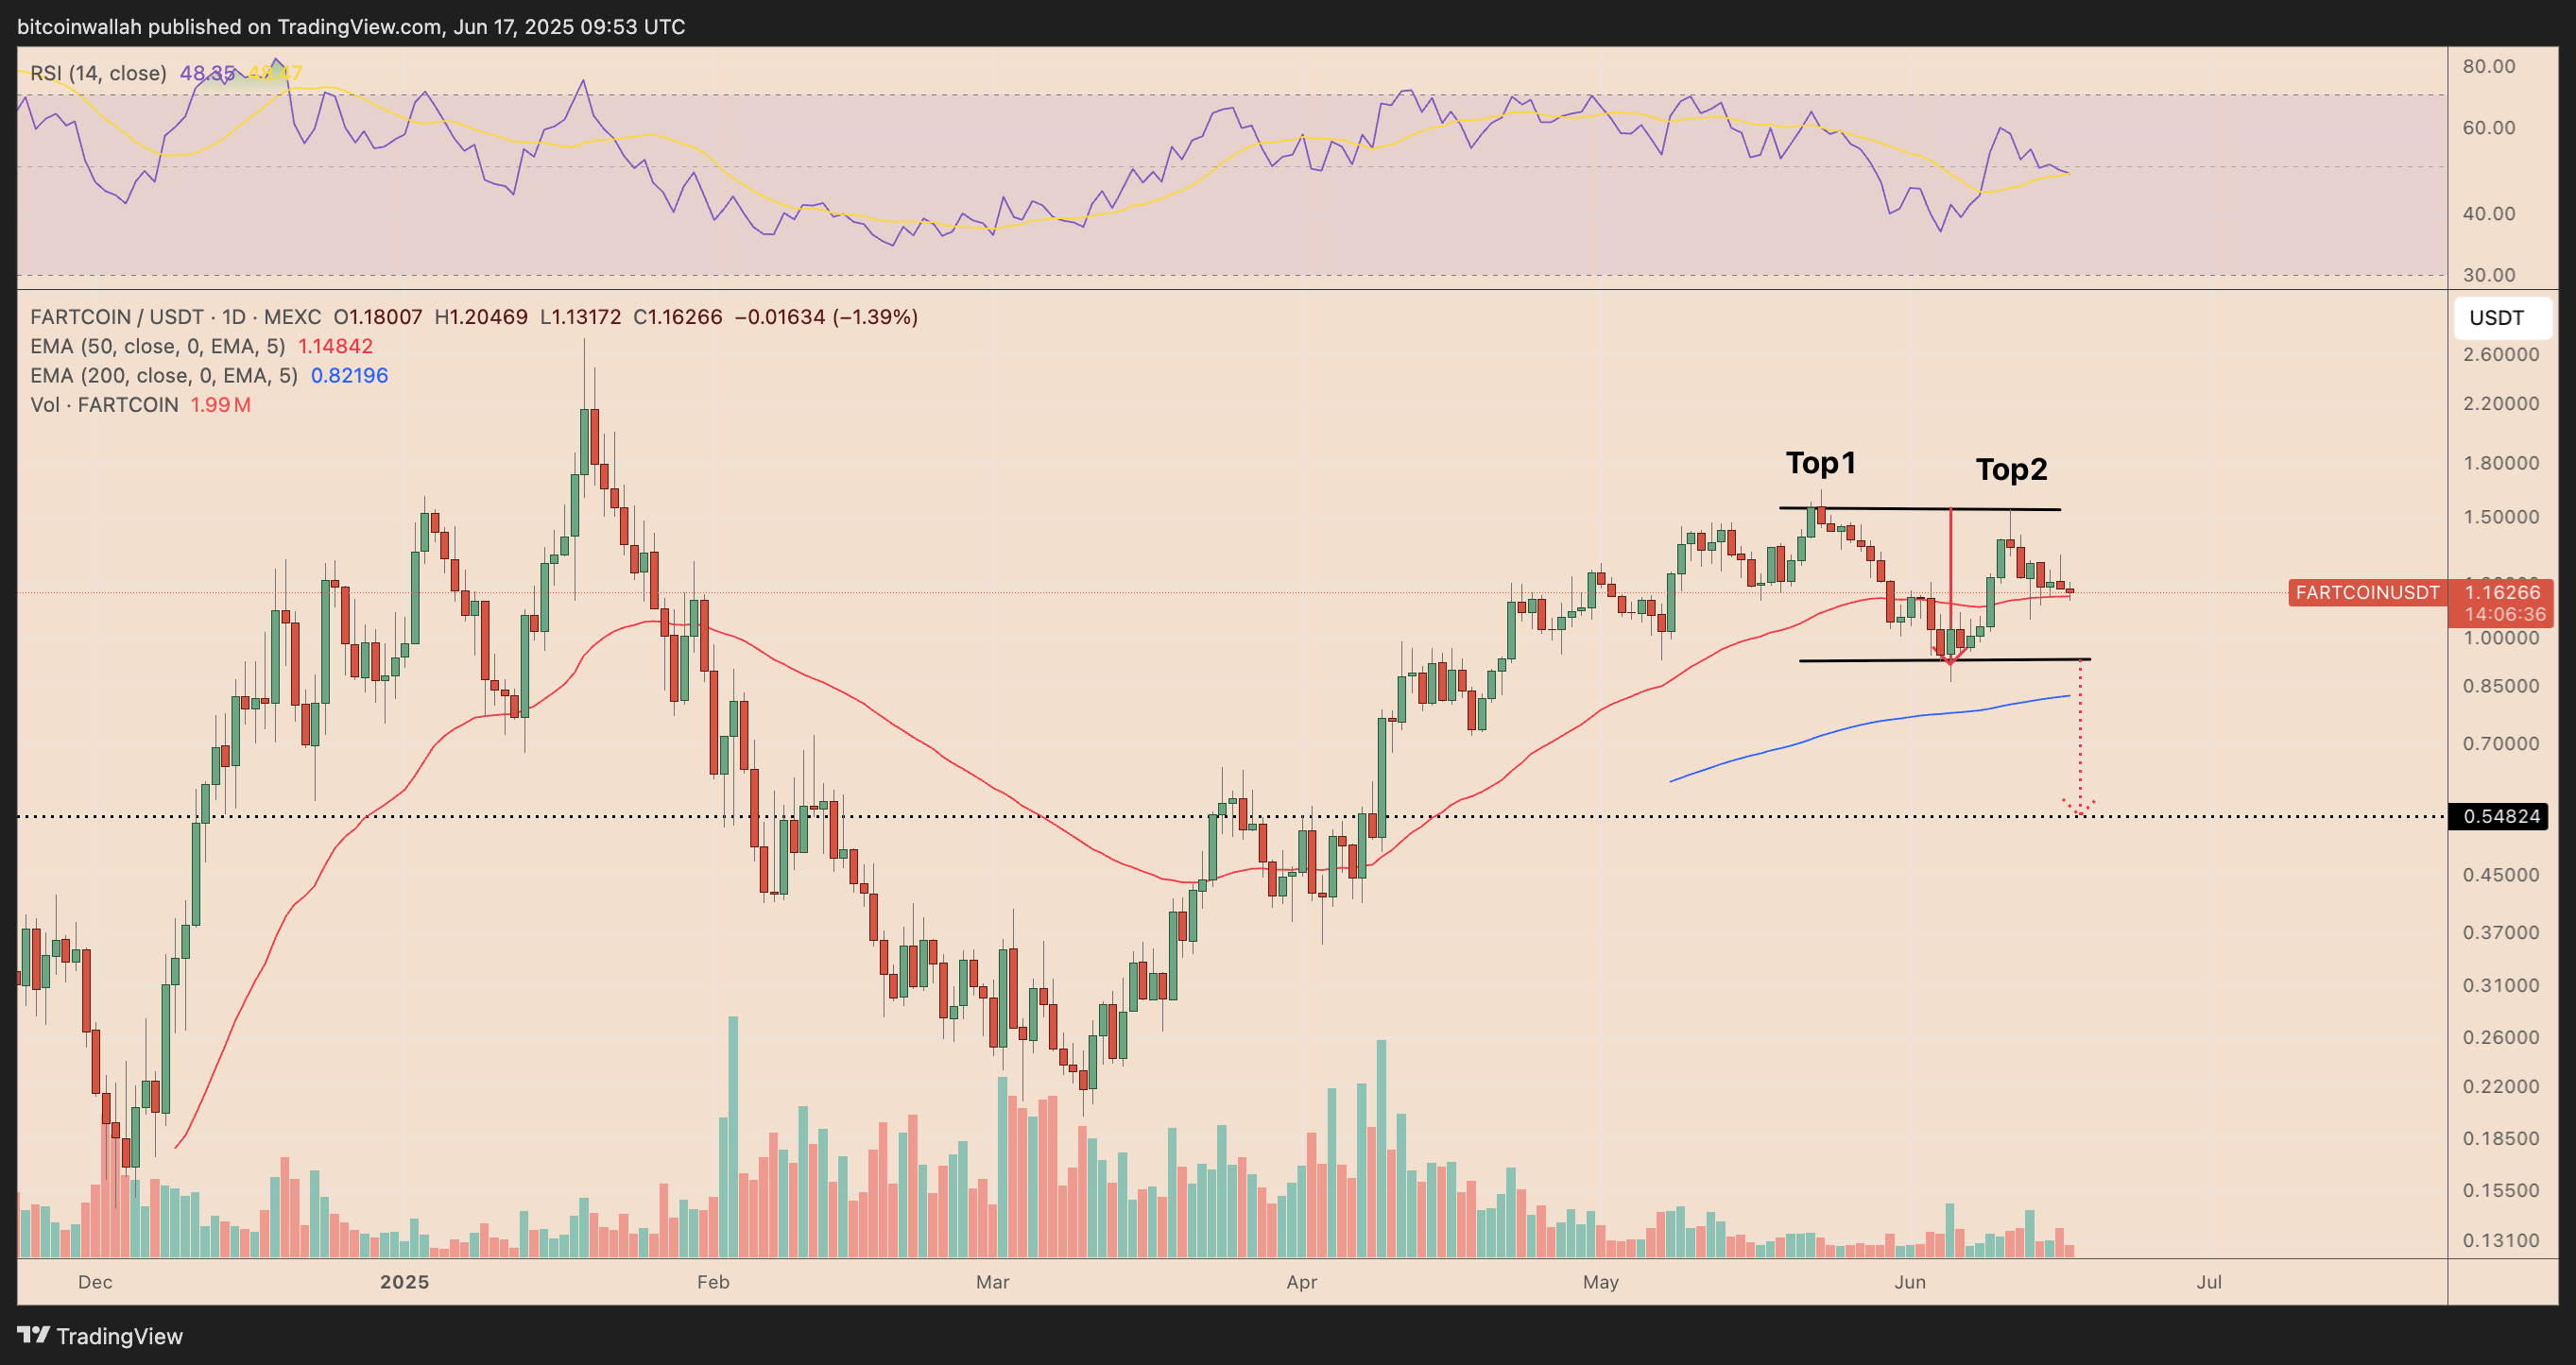
If the 50-day EMA fails to hold as support, selling pressure may accelerate toward the double top’s neckline support at $0.92. A decisive close below it would confirm the breakdown, potentially triggering an extended decline toward the $0.54 level.
That target corresponds to the height of the double top projected from the neckline. The daily RSI sits near 48, signaling weakening bullish momentum.
TRUMP Faces Key Test at Falling Wedge Resistance
TRUMP, the meme token associated with former President Donald Trump, is flashing a classic falling wedge pattern, a structure that typically precedes bullish reversals.
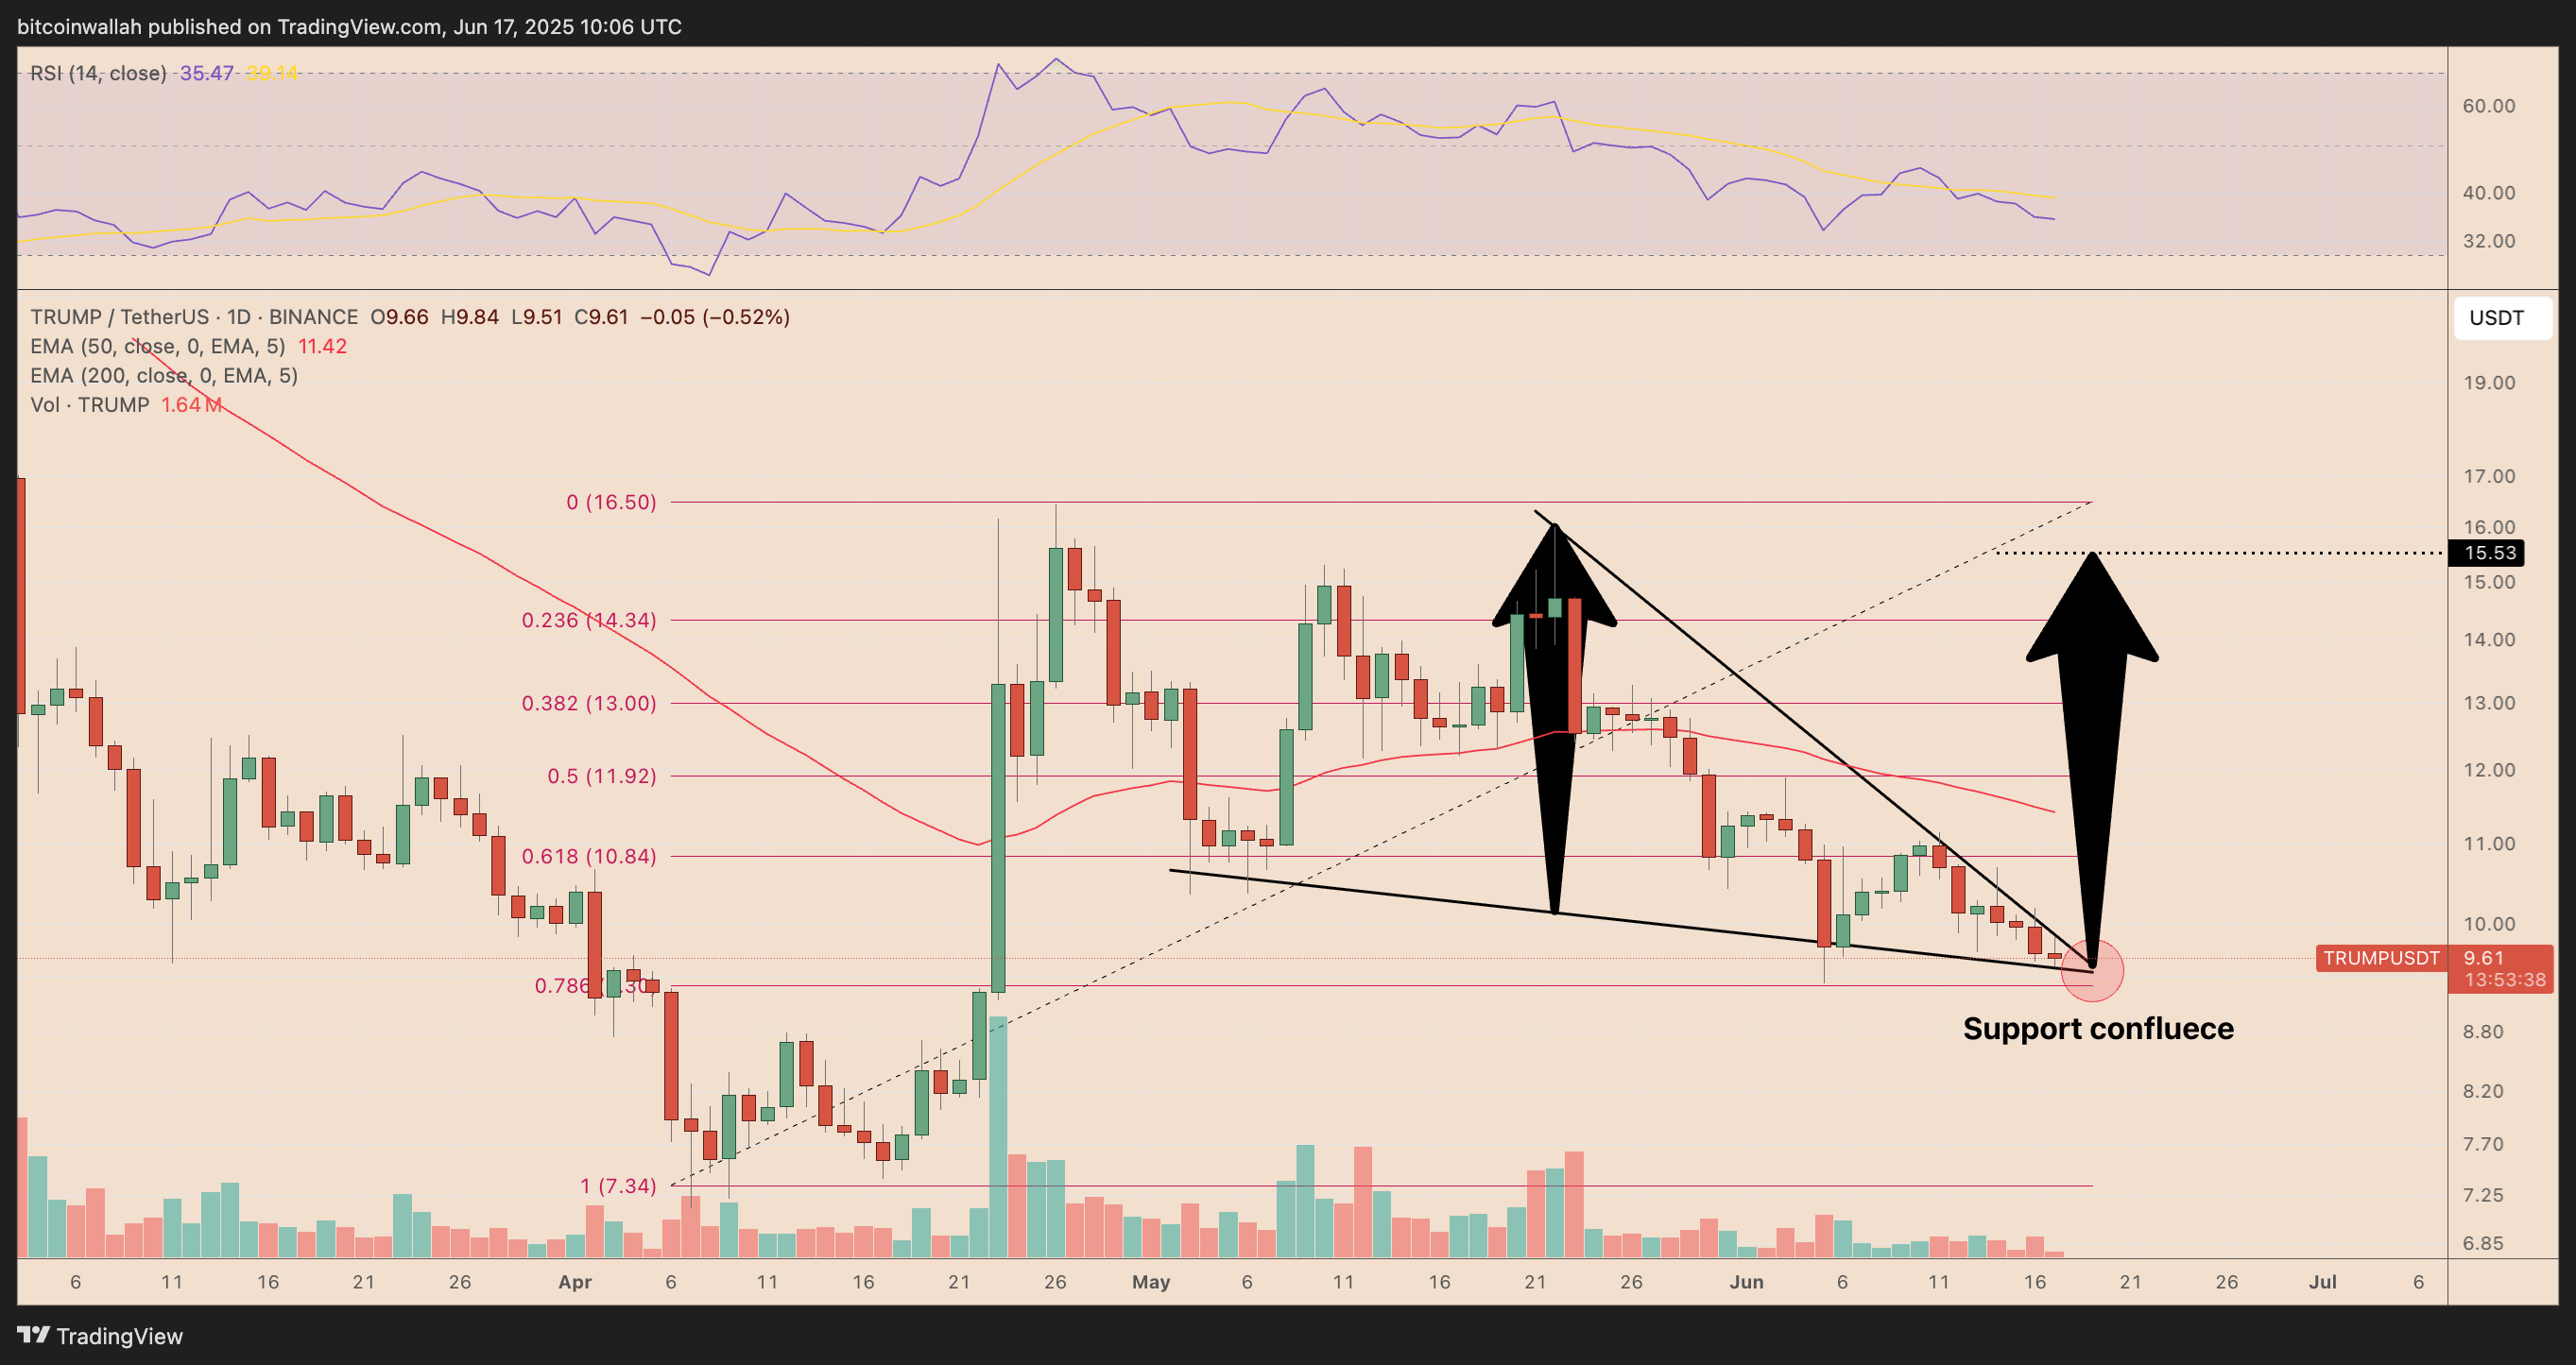
A successful breakout above the wedge resistance could initiate a rally toward $15.50, aligning with the 0.0 Fibonacci retracement level from the April–May downtrend.
Some analysts see a breakout next due to the buzz around Trump’s upcoming smartphone launch.
📲 TRUMPPHONES ARE REAL.
World Liberty Financial and Eric Trump just confirmed:
Trump Mobile is coming soon.
🧢 That means $TRUMP isn’t just a token anymore —
it’s part of a mobile ecosystem with political energy.
Now ask yourself:
What happens to the chart when the first phone… pic.twitter.com/TZX8q5Yv1c— CHOW TRADE (@TradeChow) June 16, 2025
Conversely, failure to reclaim the wedge resistance may prompt a deeper correction toward $7.34, matching the 1.0 Fib level.
About the Author
Bob MasonChief Crypto Boss
123456789 30 He has written extensively for a broader audience and his current focus is on developments relating to the financial markets including, but not limited to currencies, commodities, alternative asset classes, and global equities.


Advertisement