
Advertisement
Advertisement
Solana (SOL) Price Analysis: Bearish Trend Persists Amid ETF Speculation
By:
Key Points:
- SOL continues its decline within a structured Elliott Wave correction.
- Price nearing key support zone, potential for short-term bounce.
- Fibonacci levels indicate key resistance zones for reversal confirmation.

Solana (SOL) has been in a strong downtrend, with the price experiencing a significant drop from its recent highs. The latest developments around potential Solana futures ETFs and the possibility of a spot ETF have sparked renewed interest in the asset. However, technical indicators show that SOL remains in a corrective phase, adhering to an Elliott Wave structure that suggests further downside before a potential rebound. The daily chart outlines a larger five-wave cycle completion, while the lower timeframe chart shows continued downward pressure within a descending channel.
Solana Futures ETFs Listed on DTCC
The Depository Trust & Clearing Corporation (DTCC) has recently added Solana (SOL) futures ETFs to its listings, signaling a significant advancement in the cryptocurrency investment landscape. This development aligns with the broader trend of increasing institutional interest in crypto assets, as evidenced by the substantial inflows into Bitcoin ETFs, which amassed $65 billion in 2024, propelling Bitcoin’s price to over $100,000.
The success of these products, particularly BlackRock’s iShares Bitcoin Trust, has set a precedent, encouraging asset managers to explore ETFs tied to other cryptocurrencies. With a more crypto-friendly regulatory environment anticipated under the incoming administration, exemplified by Paul Atkins’ expected appointment as SEC chair, the industry is optimistic about the approval of spot ETFs for assets like Solana.
Companies such as VanEck and 21Shares have already filed applications for new crypto products, including those linked to Solana, indicating a potential expansion of accessible investment vehicles in the near future.
SOL Price Analysis
Solana has completed a five-wave impulse structure on the daily chart, reaching a peak near $294 before entering a corrective phase. The price has since fallen sharply, breaking below key support levels and now testing a crucial green demand zone around the $120–130 range.
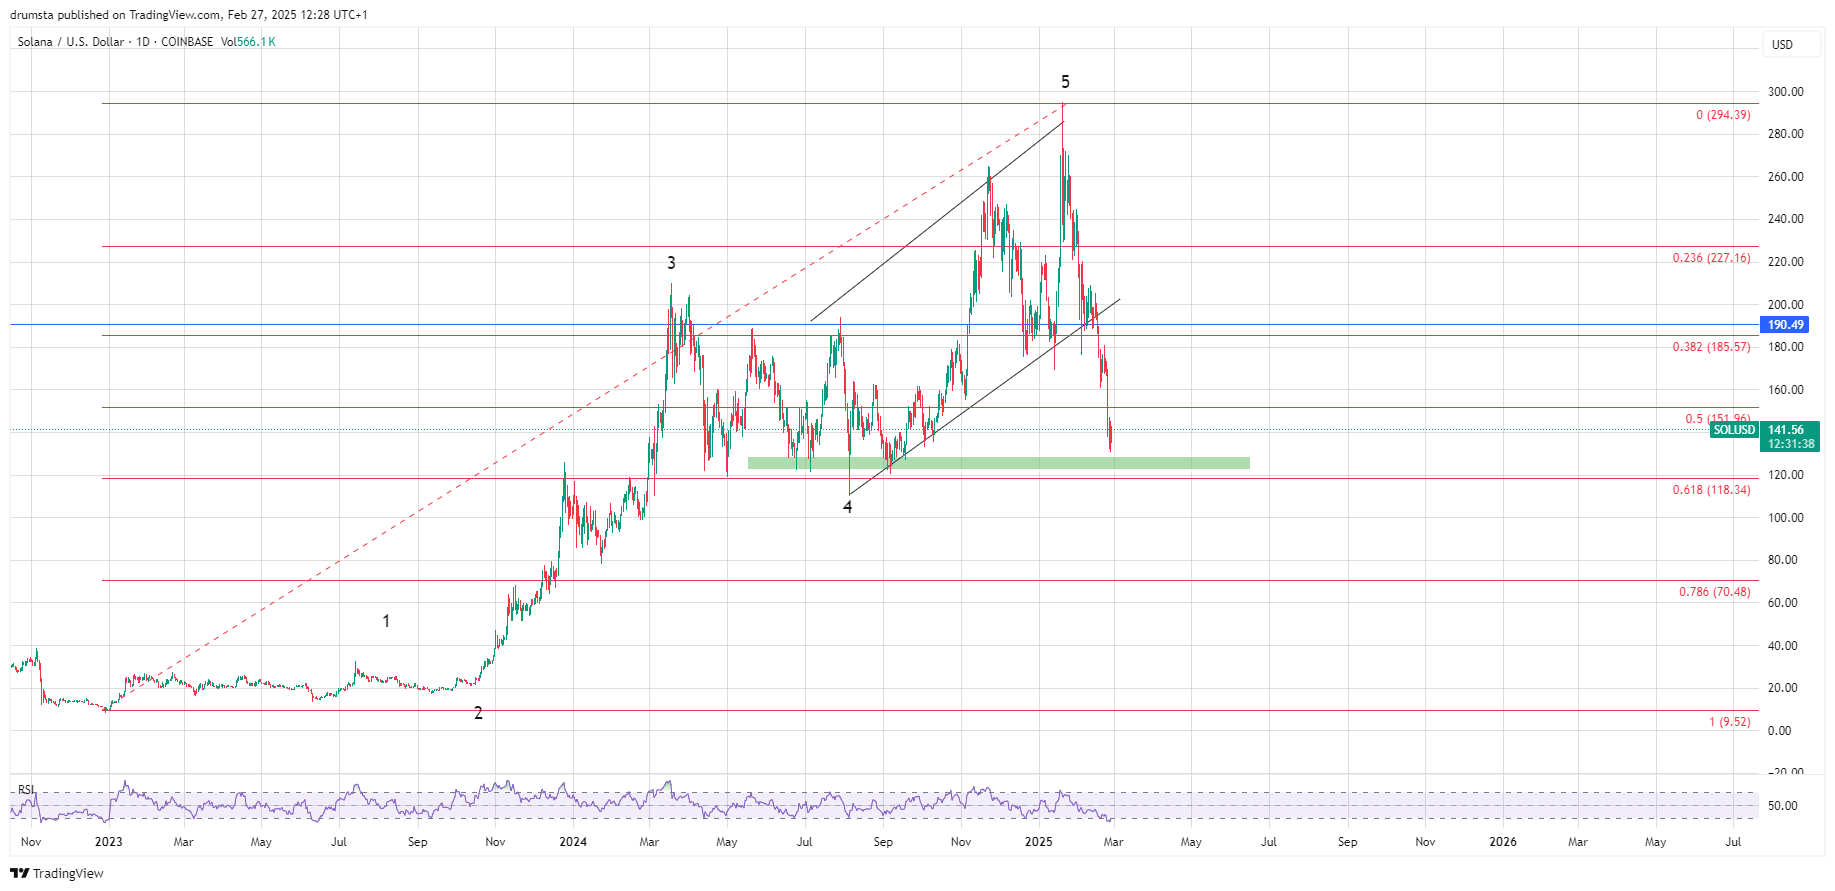
The Elliott Wave count suggests that SOL is currently in a larger-degree corrective wave, likely a Wave (C) of an ABC pattern, following the completion of a full five-wave impulsive structure. The recent breakdown from the rising channel pattern intensified the selling pressure, pushing SOL below the 0.5 Fibonacci retracement level ($151.96). The next major support lies at the 0.618 retracement level around $118.34.
The RSI on the daily chart is approaching oversold territory, indicating that selling momentum could be exhausting. However, the lack of a bullish divergence suggests that further downside remains possible before a reversal is confirmed. A strong recovery above $185 (0.382 Fibonacci level) would be the first signal of a potential trend shift.
SOL Price Prediction
On the 1-hour chart, SOL remains locked in a well-defined descending channel, with the current price action unfolding within a smaller-degree five-wave corrective structure. The latest wave count suggests that SOL is in Wave (v) of a final downward move, targeting the green support zone near $120.
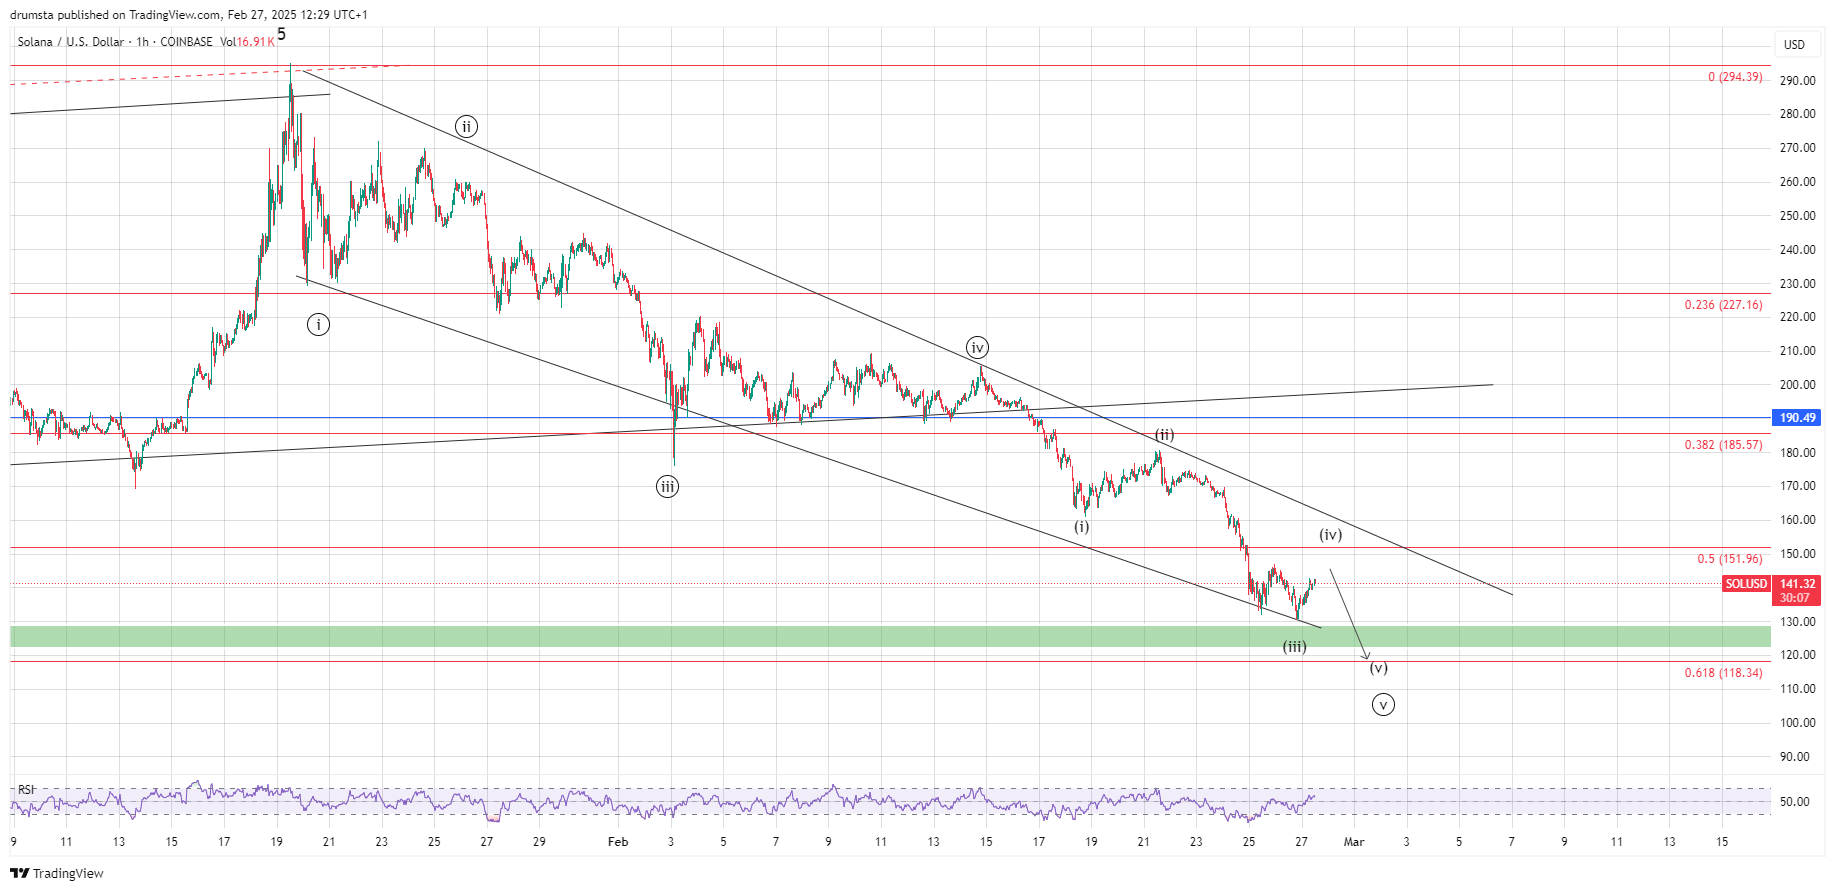
Short-term, we may see a minor retracement for Wave (iv) before the final leg lower. A corrective bounce could push SOL back toward resistance at $151 (0.5 Fibonacci retracement), but failure to break this level would confirm continuation to the downside. If Wave (v) completes near the projected support zone, we can anticipate a potential reversal, especially if bullish divergence appears on the RSI.
If a reversal occurs, the key upside target would be $185, aligning with the 0.382 Fibonacci retracement. Breaking above this level would open the path toward $227 (0.236 Fibonacci retracement), but until then, the trend remains bearish.
Key Levels to Watch
- Immediate Resistance: $151.96 (0.5 Fibonacci retracement)
- Major Resistance: $185.57 (0.382 Fibonacci retracement)
- Critical Resistance: $227.16 (0.236 Fibonacci retracement)
- Immediate Support: $130 (historical demand zone)
- Major Support: $118.34 (0.618 Fibonacci retracement)
About the Author
Bob MasonChief Crypto Boss
TEST 30 He has written extensively for a broader audience and his current focus is on developments relating to the financial markets including, but not limited to currencies, commodities, alternative asset classes, and global equities.
Latest news and analysis


Advertisement