
Advertisement
Advertisement
SUI, ETH Price Analysis: Bullish Technical Setups Hint at May Breakouts
By:
Key Points:
- SUI is consolidating inside a falling wedge pattern, aiming for a breakout toward $4.20
- Ethereum is forming a cup-and-handle pattern, targeting $2,500–$2,600 if confirmed.
- Both altcoins show bullish technical setups despite early May weakness.

Sui (SUI) and Ethereum (ETH) have kicked off May with dismissive performances. The former has dropped by over 8% so far in the month, while the latter is consolidating sideways, showing a growing indecisiveness among traders about its next potential direction.
However, if their technical patterns confirm, both altcoins look poised for potentially strong breakouts. Let’s examine:
SUI Paints a Falling Wedge, Eyes $4.20
SUI has delivered notable price action recently, skyrocketing from around $2.20 in late April to highs above $3.60 before entering a consolidation phase. As of May 6, the token is trading near $3.23, down over 5%, but its technical posture remains bullish.
The daily chart reveals a falling wedge pattern, characterized by descending trendlines converging toward a narrow point. This setup typically signals waning selling pressure and a likely breakout to the upside.
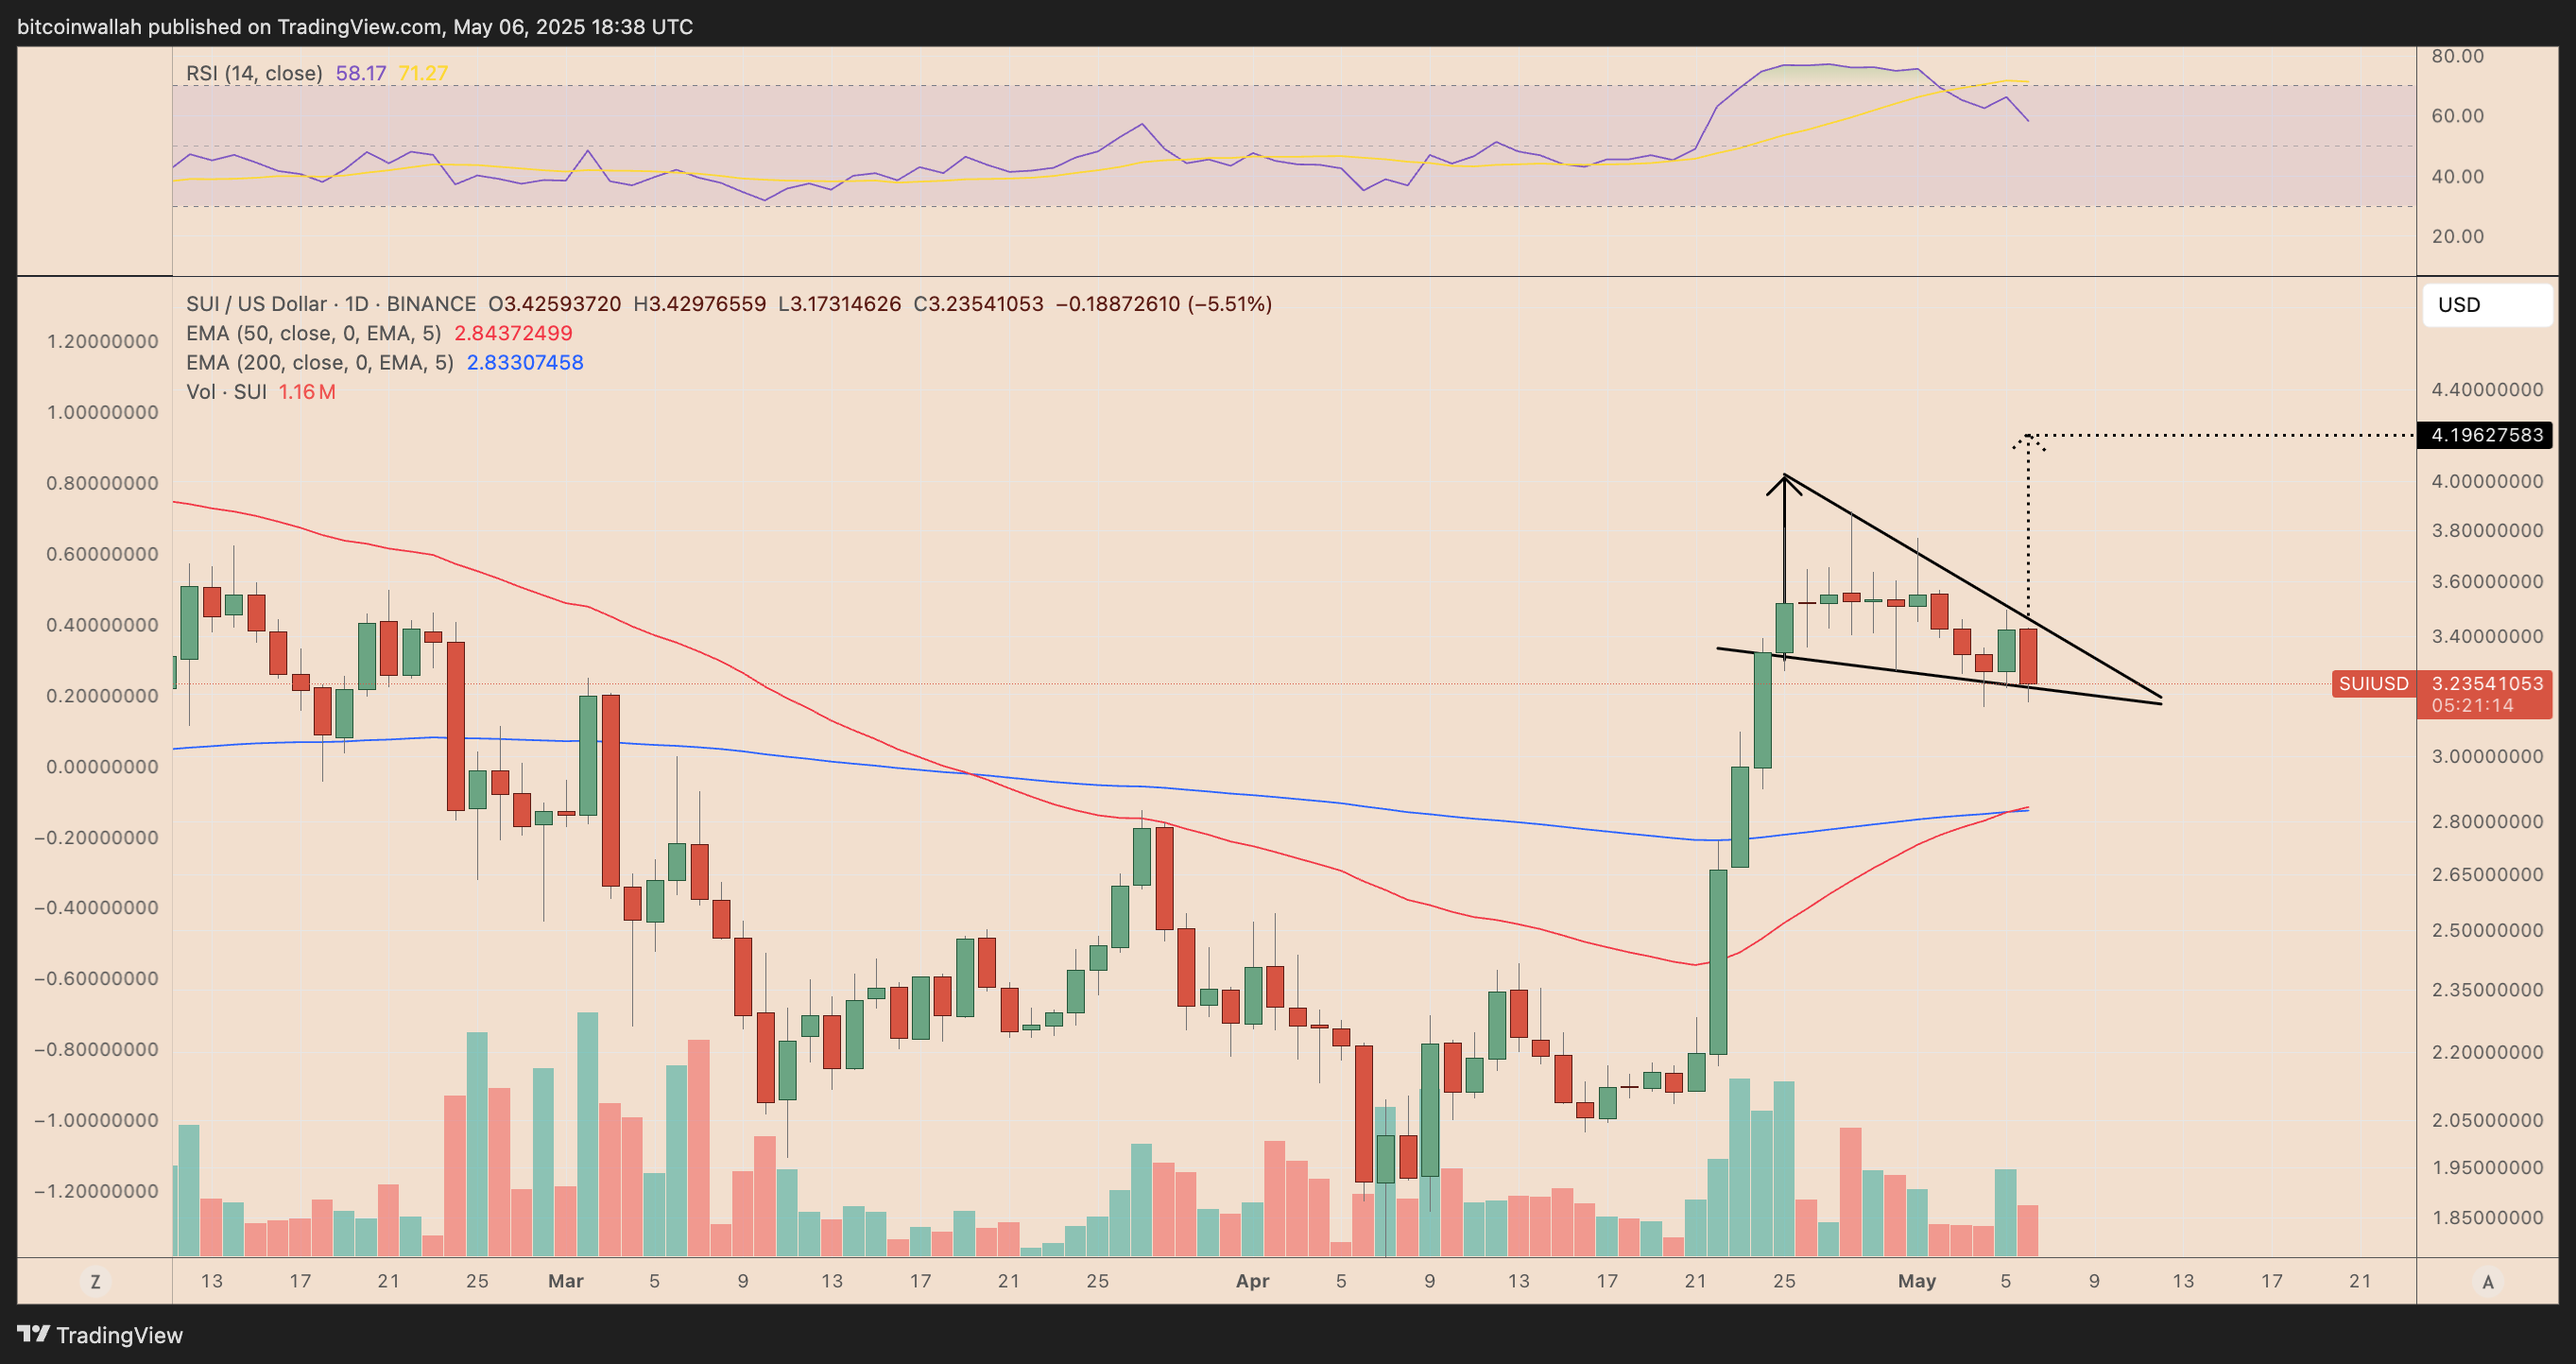
If SUI breaks above the wedge’s upper trendline with volume, the pattern projects an upside target near $4.20, based on the height of the wedge added to the breakout point. That would mark a roughly 30% rally from current levels, provided bulls maintain momentum and broader market sentiment remains supportive.
To support this case, SUI continues to hold above its key 50-day and 200-day exponential moving averages (EMAs), currently near $2.84 and $2.83, respectively—a sign that buyers are defending critical support levels.
Ethereum’s Cup and Handle Targets $2,500
Ethereum has been slower to impress in May, but its technical structure is shaping up for a potentially powerful breakout.
ETH is trading near $1,777, down about 2.4% on the day, but its recent price action has completed the ‘handle’ side of a classic cup-and-handle pattern. This formation typically signals a bullish continuation, especially after a prolonged downtrend.
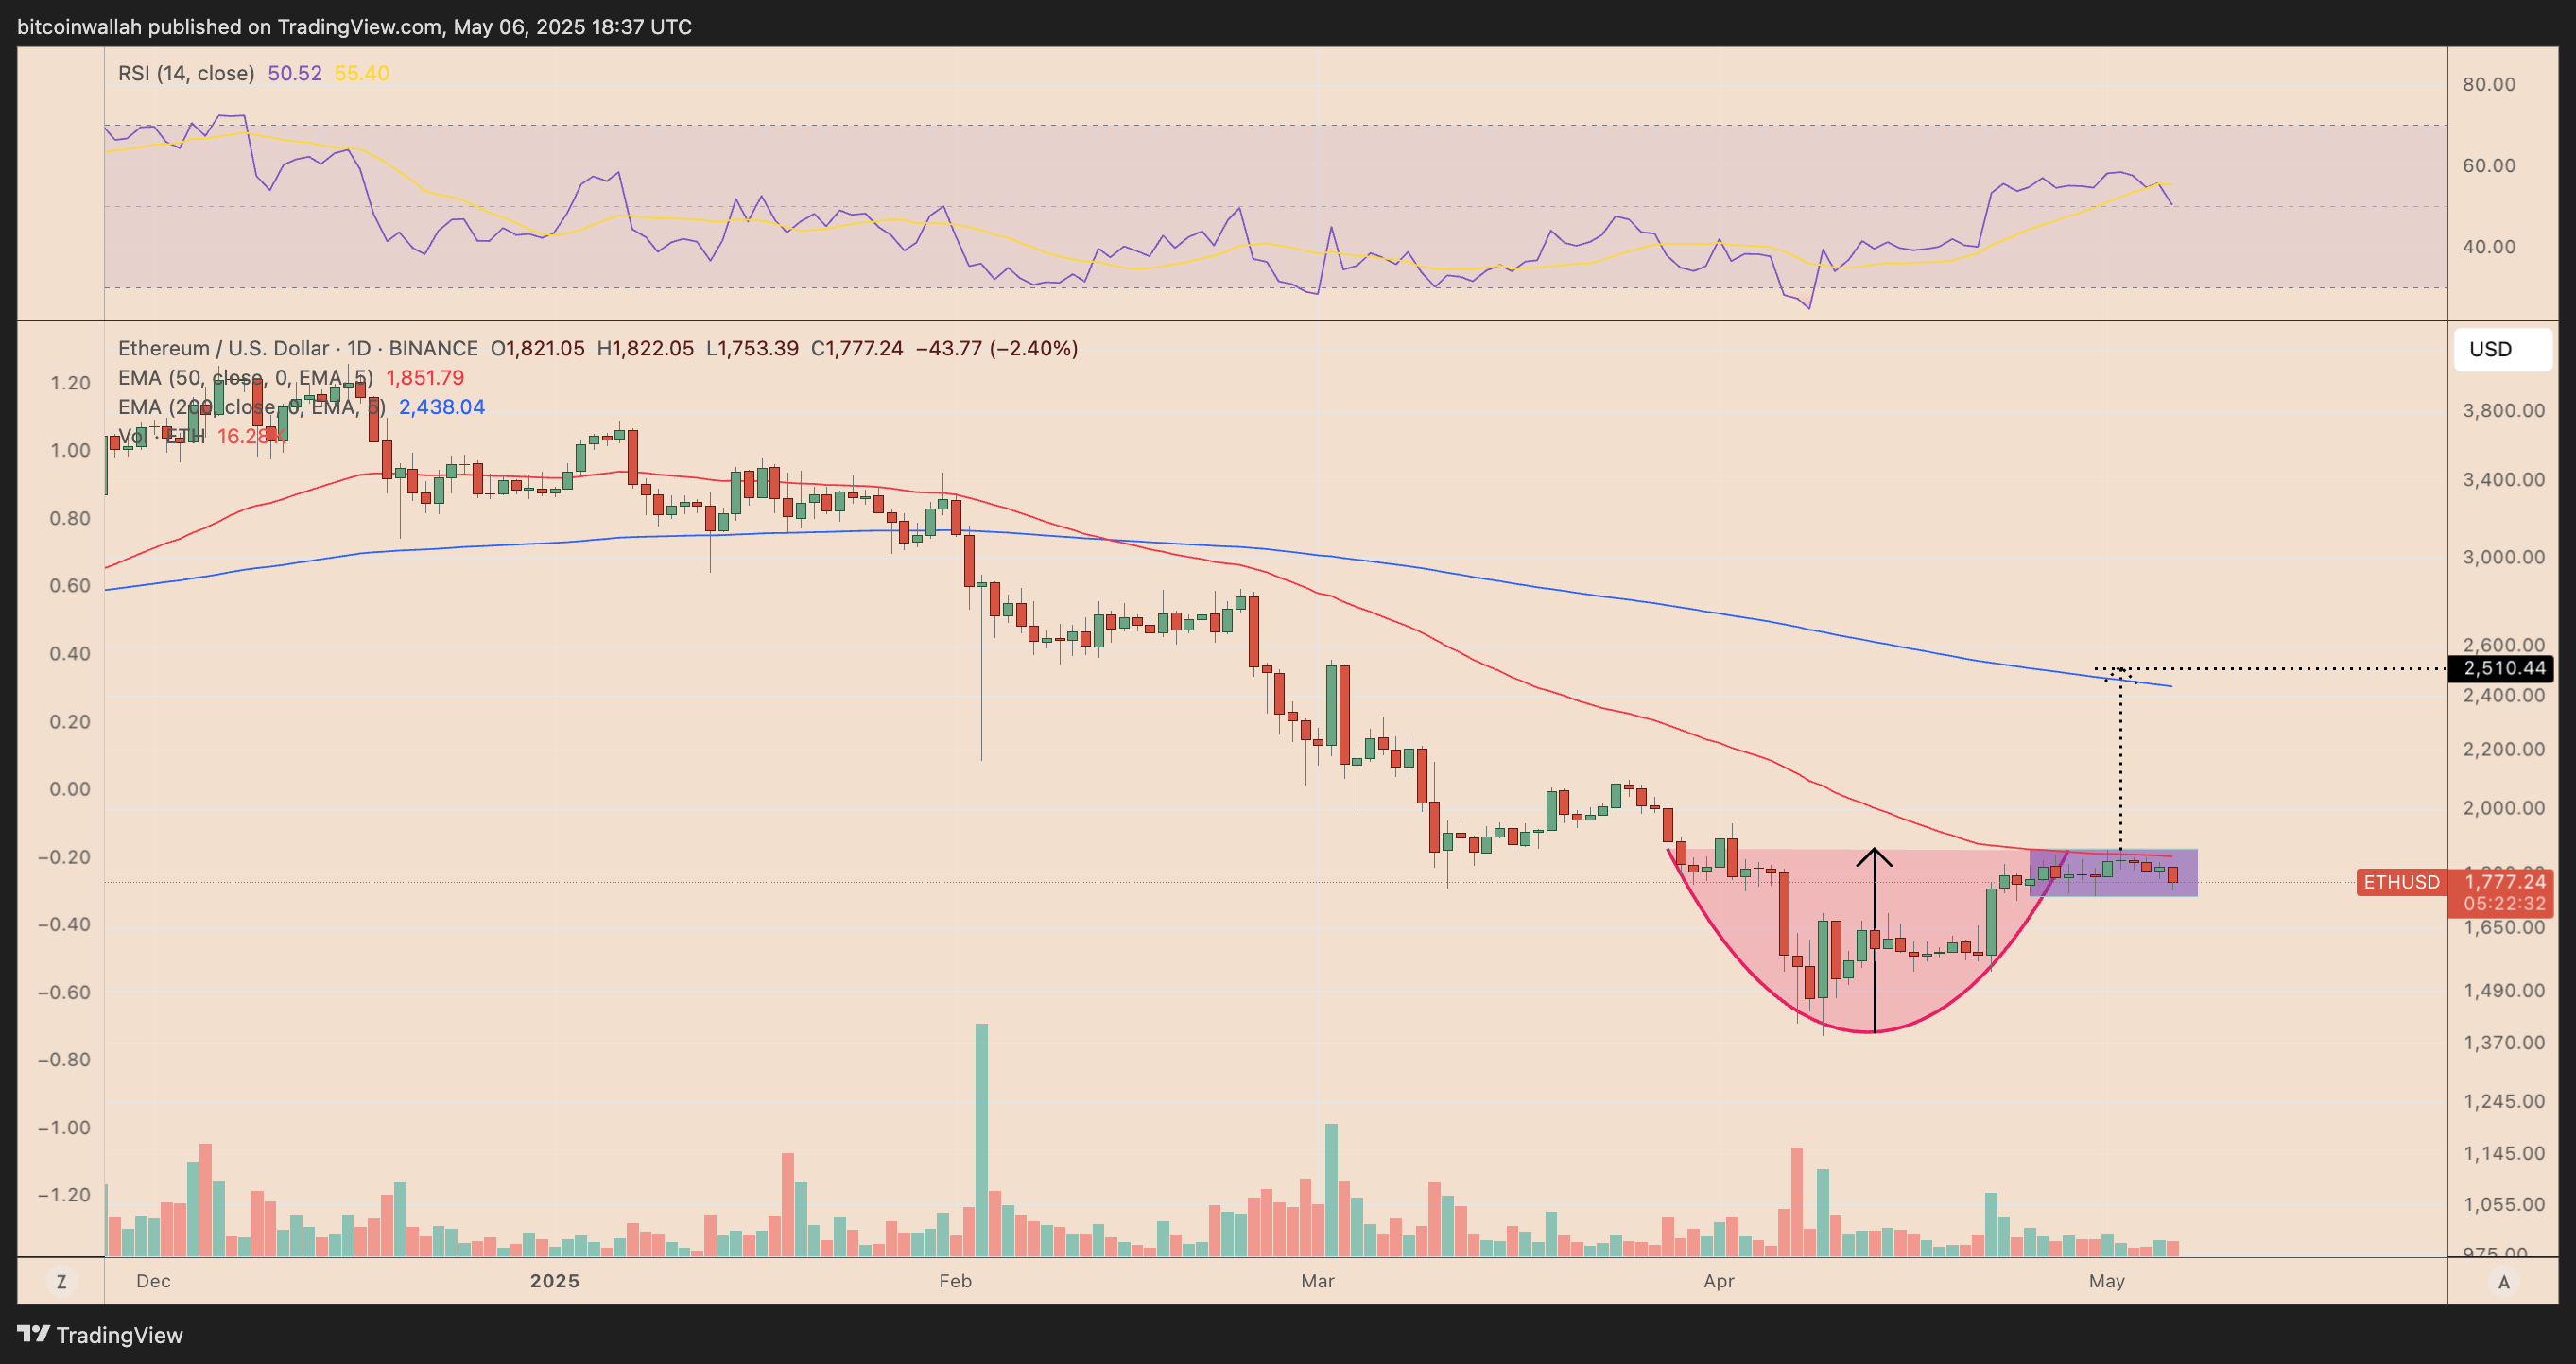
On the daily chart, ETH’s cup structure bottomed near $1,650, recovered to the neckline around $1,900, and is now forming a handle — a modest pullback that shakes out weak hands before a potential surge.
The projected breakout target from this pattern points to the $2,500–$2,600 area, representing a significant upside of roughly 40% from current prices.
Importantly, ETH must clear its 50-day EMA ($1,851) and challenge the 200-day EMA ($2,438) to confirm the pattern’s validity.
About the Author
Bob MasonChief Crypto Boss
123456789 30 He has written extensively for a broader audience and his current focus is on developments relating to the financial markets including, but not limited to currencies, commodities, alternative asset classes, and global equities.


Advertisement