
Advertisement
Advertisement
SUI, LTC, LINK Rebound Sharply — But Can They Recover Further Amid Trump Scare?
By:
Key Points:
- Sui (SUI) is forming an inverse cup-and-handle, with a breakdown below $2.80 potentially targeting $1.67.
- Litecoin (LTC) is consolidating inside a symmetrical triangle, with a possible decline toward $103-$105 if support at $111 fails.
- Chainlink (LINK) is testing a key accumulation range, with an RSI of 29.60 hinting at a potential short-term rebound toward $21.72.

Sui (SUI), Litecoin (LTC), and Chainlink (LINK) have rebounded the most in the past 24 hours, wiping some of the losses they incurred in the Donald Trump-led crypto market crash on Feb. 27.
Let’s examine if these gains can continue in the coming days.
Sui (SUI) Technical Analysis
Sui is forming an inverse cup-and-handle pattern, a bearish continuation setup, with the price struggling below key resistance at $3.60-$3.70. The rounded top developed between November 2024 and February 2025, with SUI breaking below the neckline near $3.00, confirming downside risks.
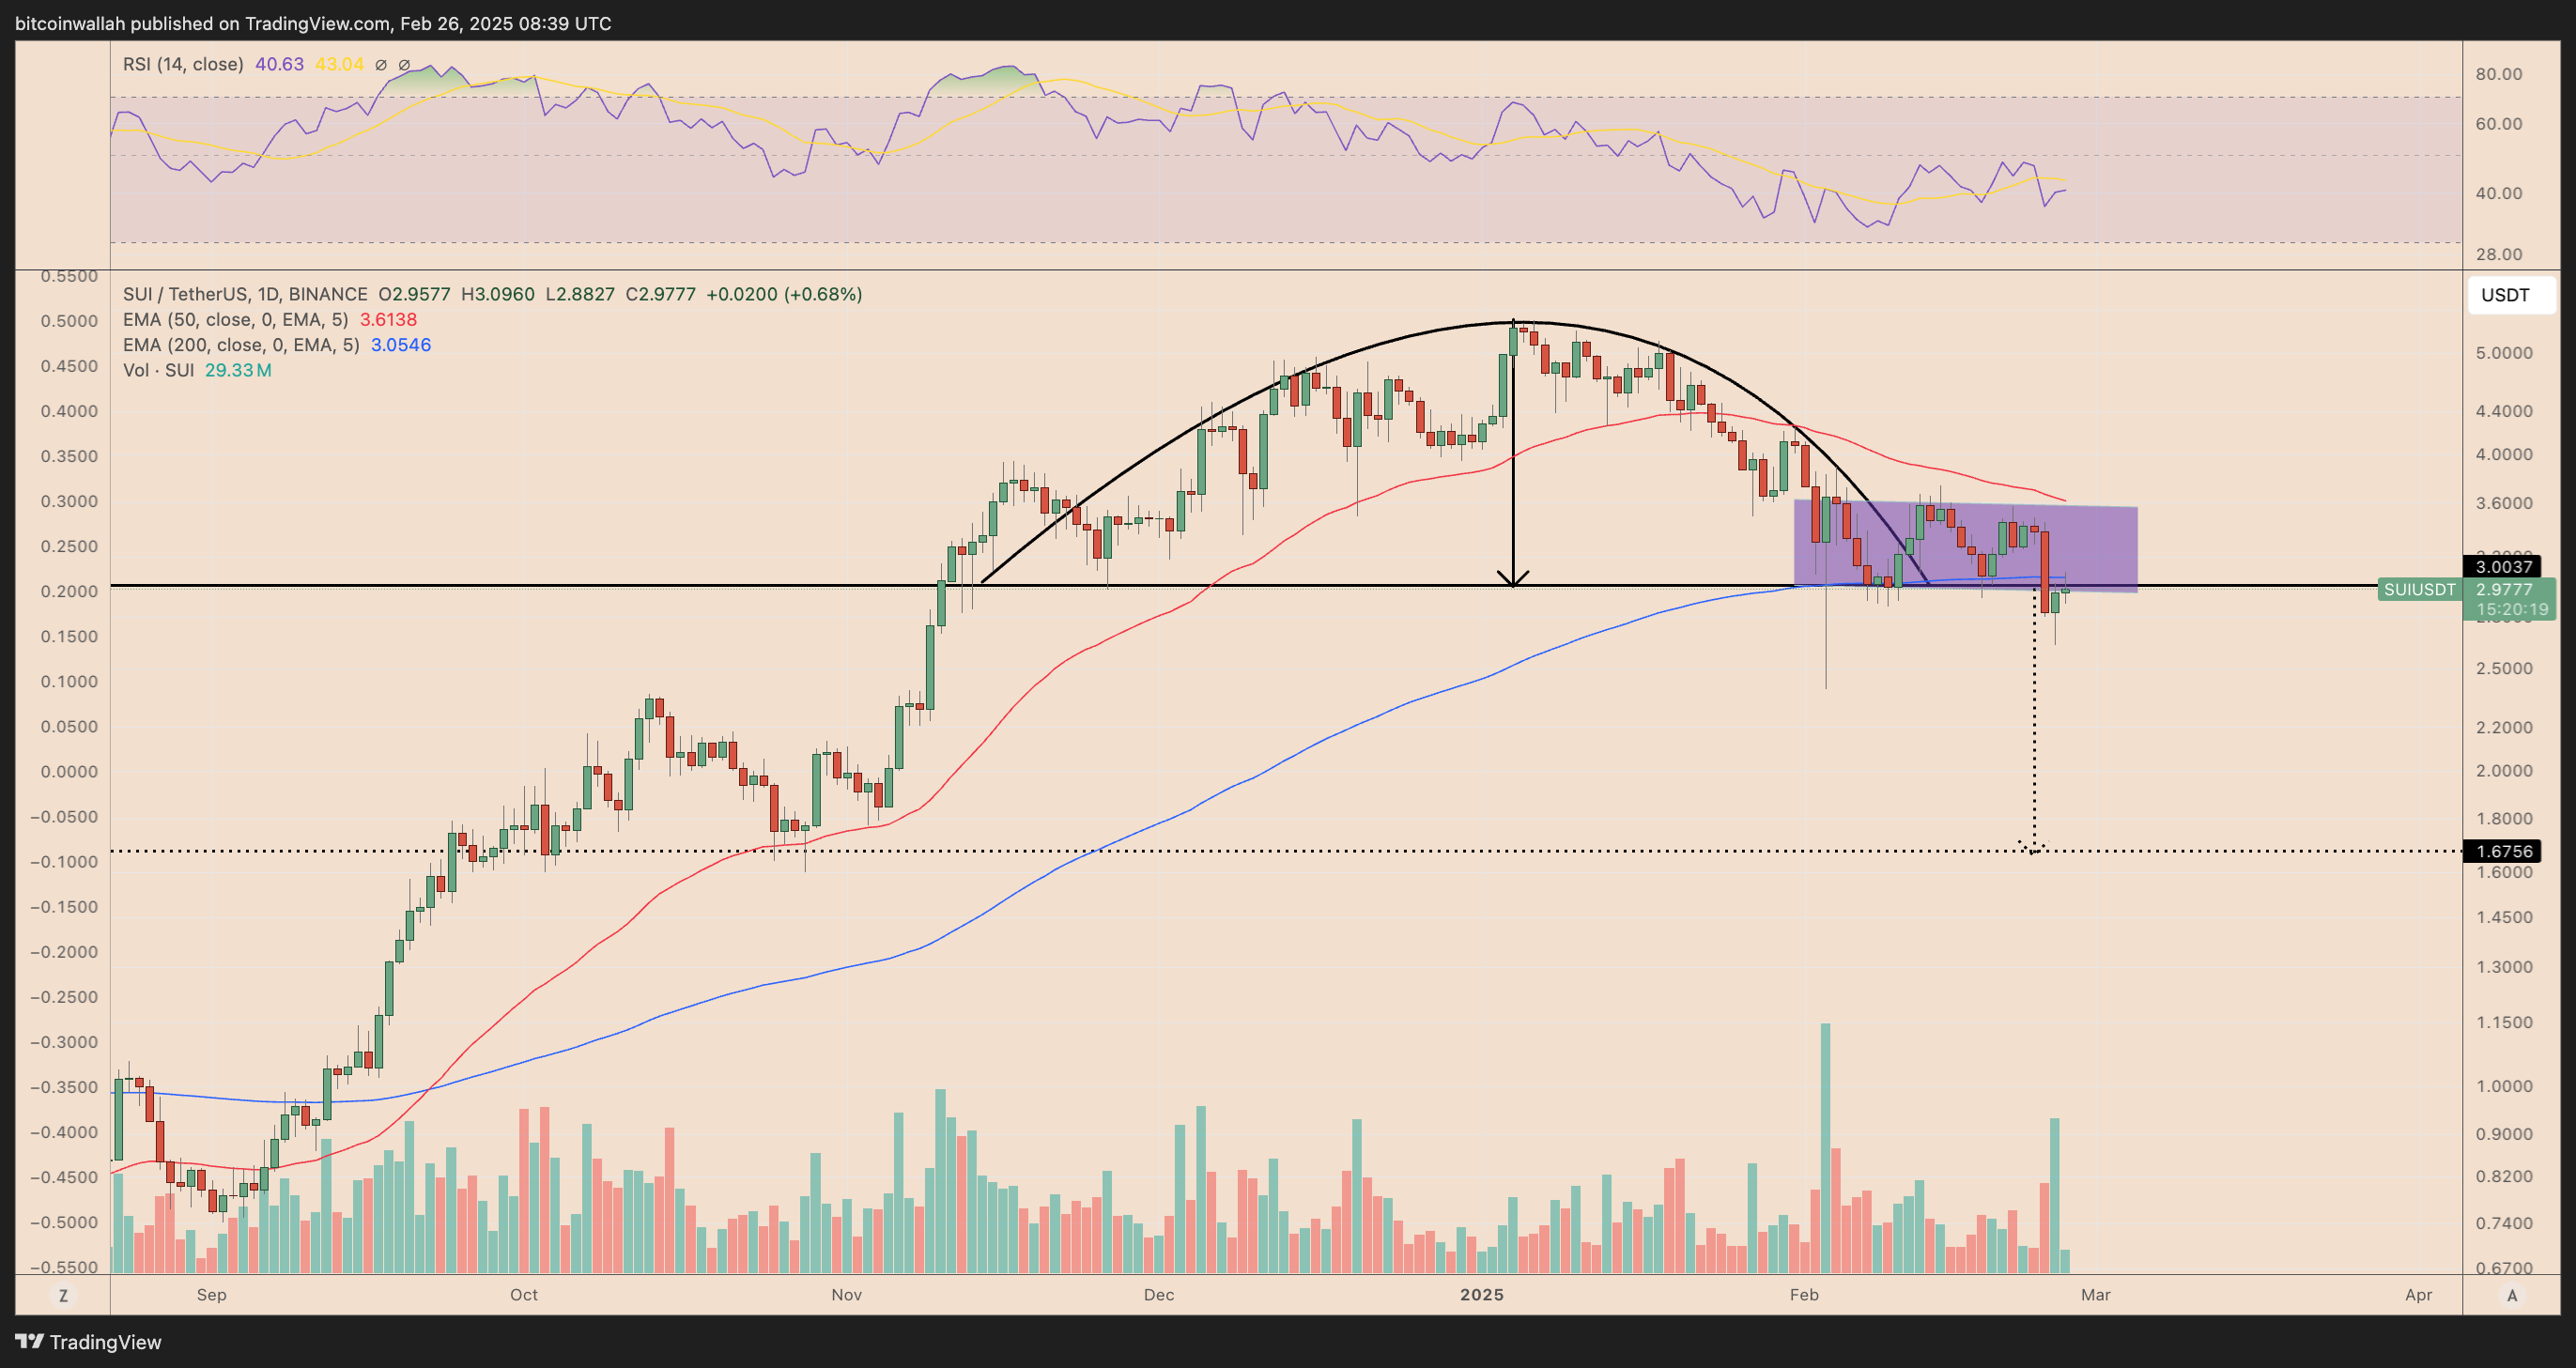
The handle is forming as SUI consolidates within the purple zone, retesting previous support as resistance. The 50-day EMA at $3.61 is reinforcing selling pressure, while the 200-day EMA at $3.05 is providing temporary support. A breakdown below $2.80 could validate the pattern, targeting $1.67 based on the height of the cup.
The RSI at 40.63 indicates weak momentum, with no clear signs of recovery. If SUI fails to reclaim $3.60, bears remain in control. A decisive drop below $2.80 could accelerate losses, confirming the bearish outlook.
Litecoin (LTC) Technical Analysis
Litecoin is trading within a symmetrical triangle pattern, indicating a period of consolidation before a potential breakout. The price is currently testing the mid-range, with support near $111-$113 and resistance near $135-$140.
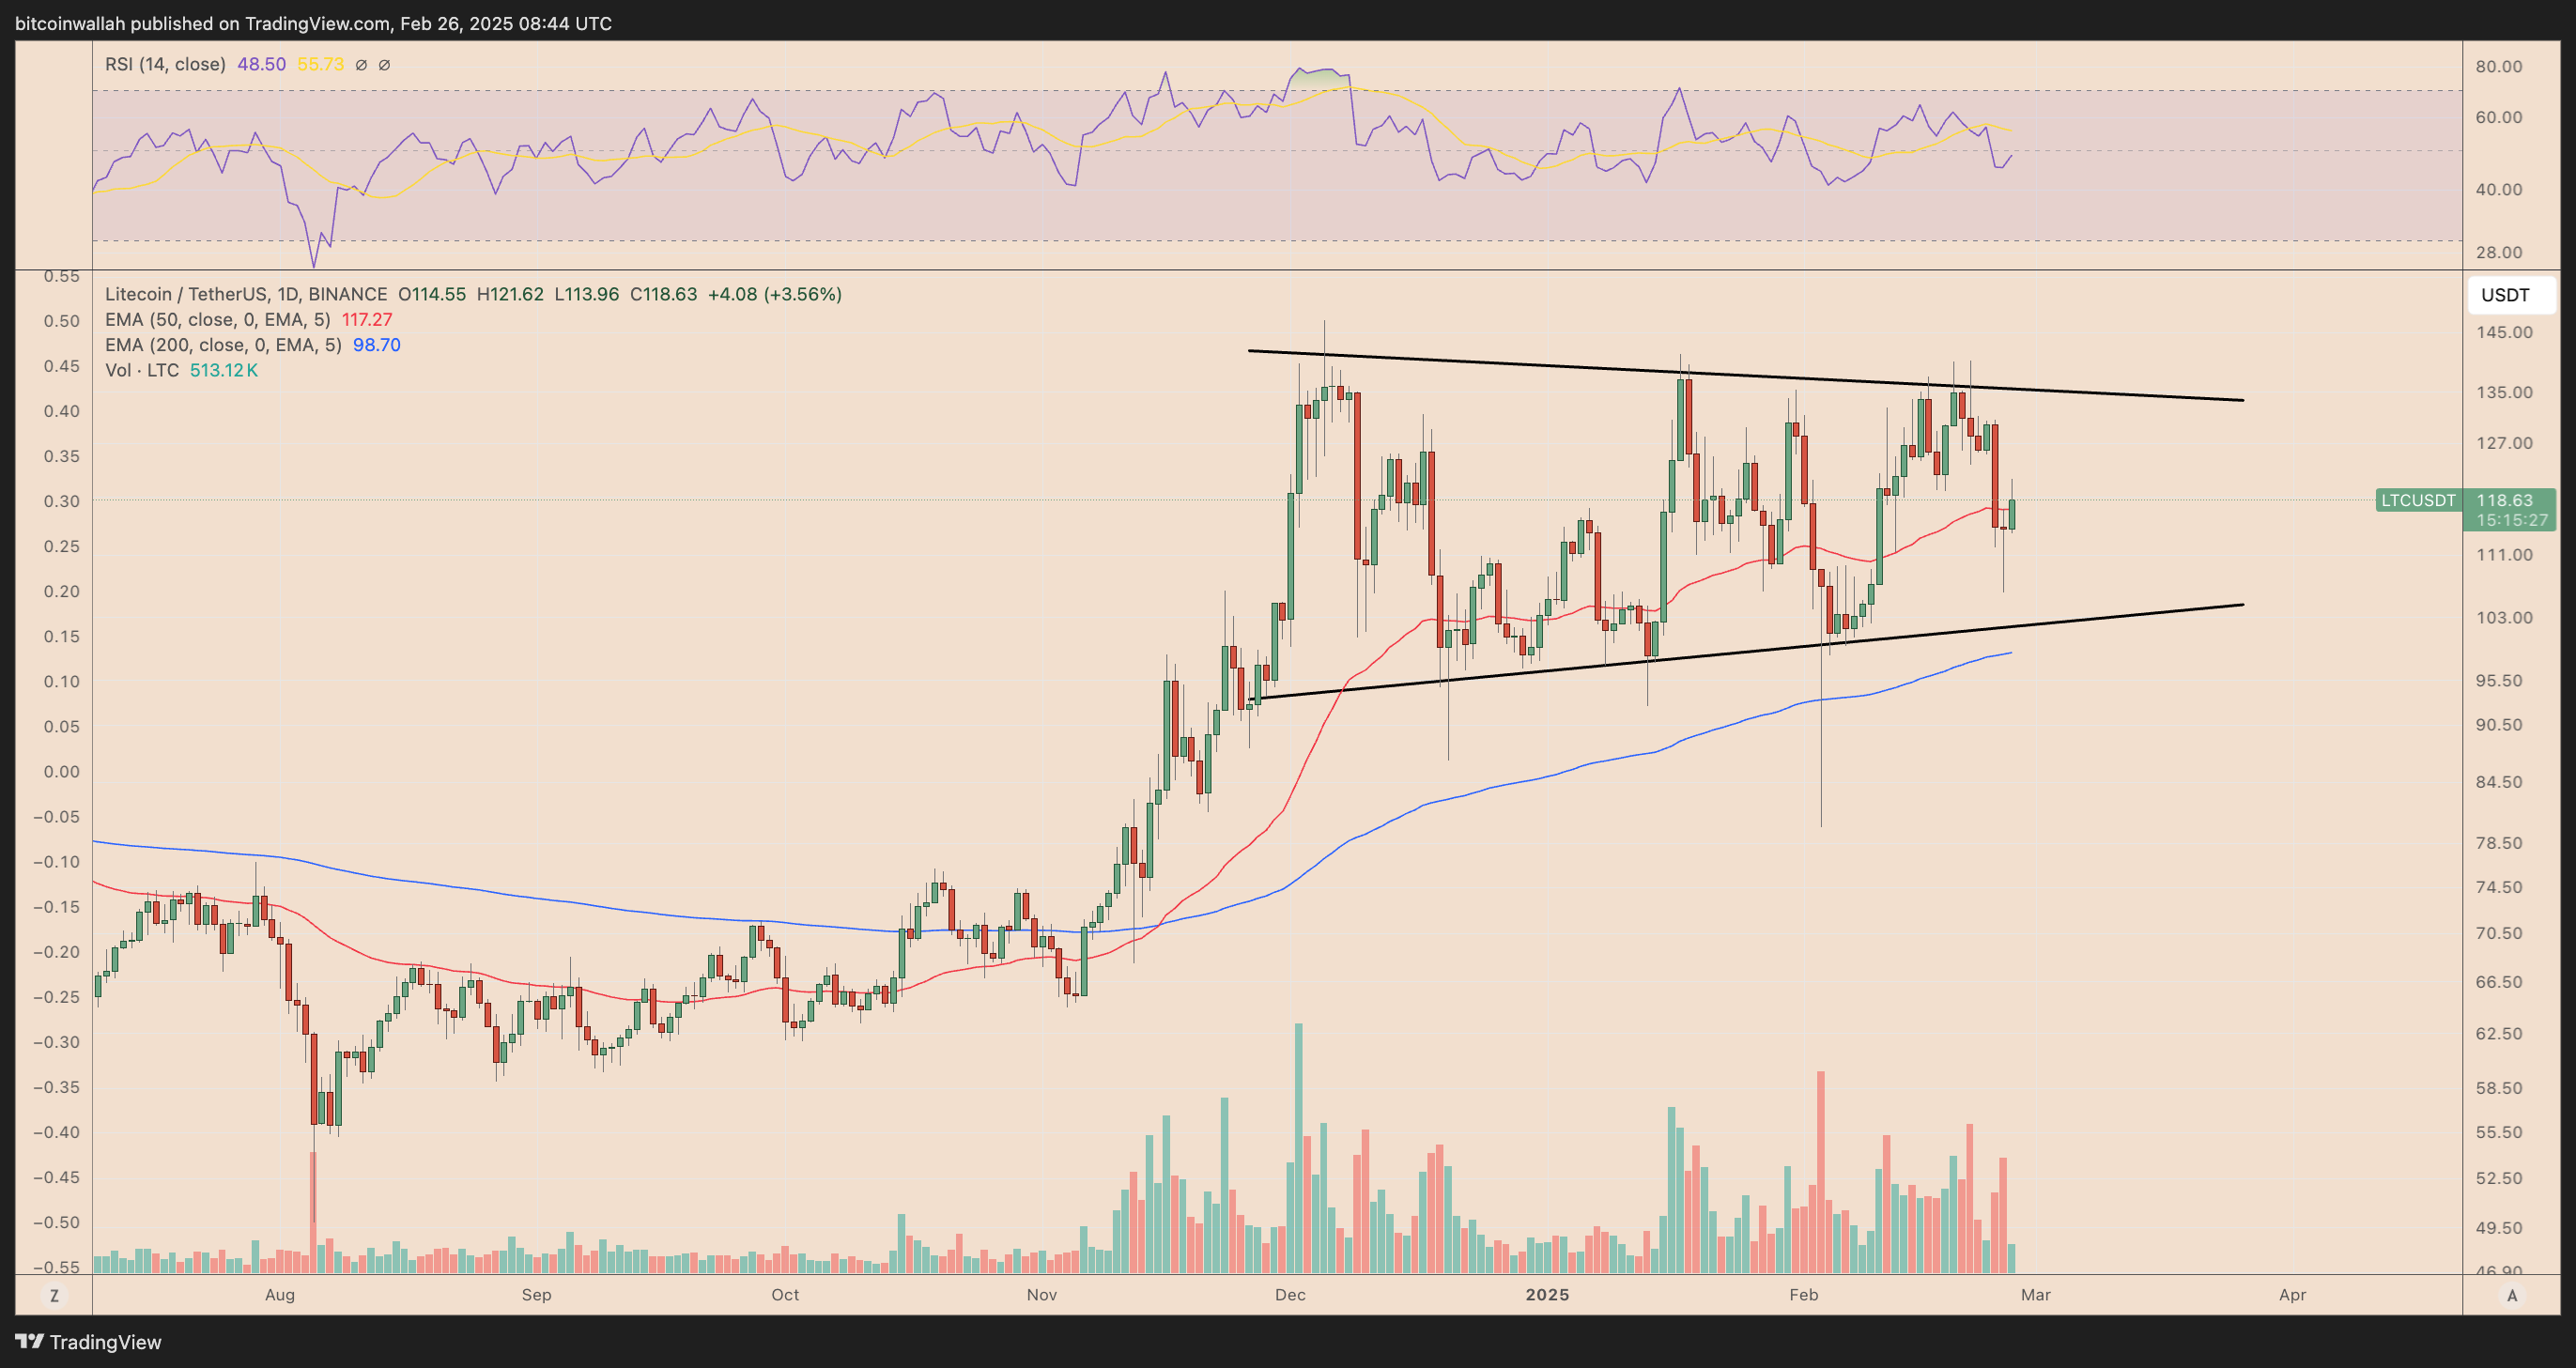
LTC has formed higher lows and lower highs, with the 50-day EMA at $117.27 acting as a dynamic resistance. The 200-day EMA at $98.70 aligns with the lower trendline, making it a key support zone.
The RSI at 48.50 is neutral, suggesting no strong momentum in either direction. If LTC fails to hold above $111, the price may decline toward the $103-$105 region, aligning with the triangle’s lower boundary.
Chainlink (LINK) Technical Analysis
Chainlink is testing a key accumulation range near $14.50-$15.50, a historically significant support zone.
The price briefly dipped below this level but has shown signs of stabilization, suggesting potential accumulation by buyers. The Relative Strength Index (RSI) at 29.60 indicates oversold conditions, supporting the possibility of a short-term rebound.
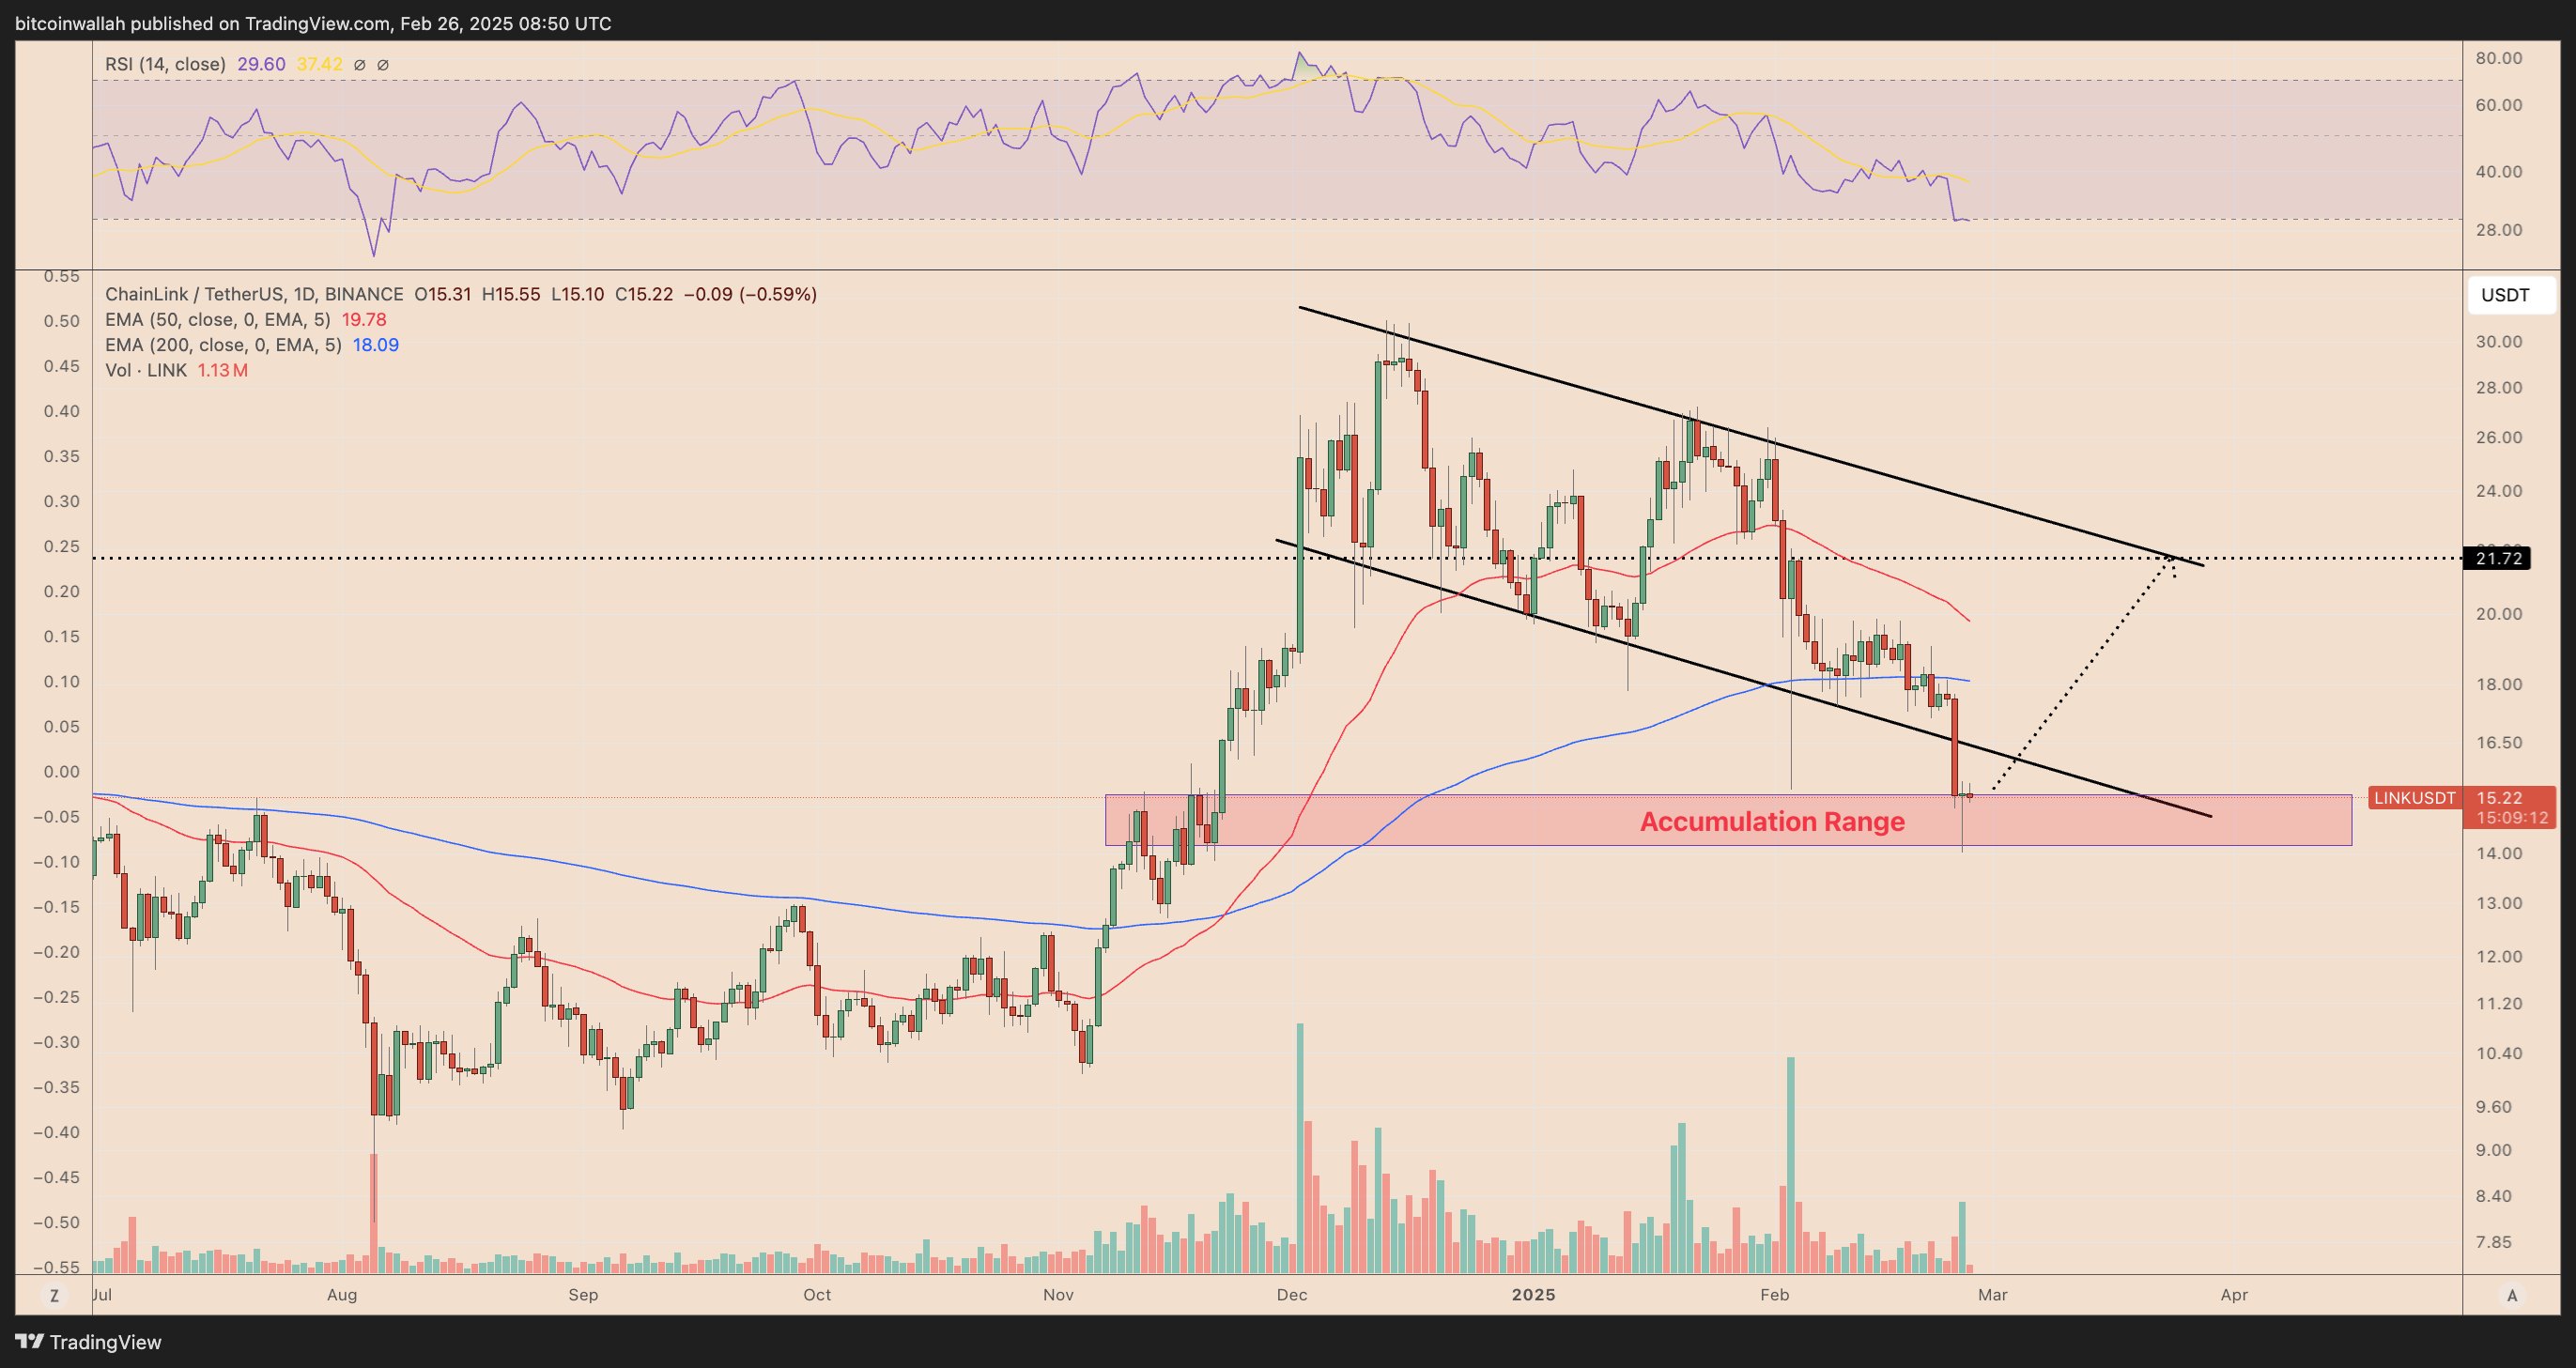
If LINK confirms a bounce from this range, it could re-enter the descending channel, with the next resistance levels near the 200-day EMA at $18.09 and the 50-day EMA at $19.78.
A sustained recovery may propel LINK toward the channel’s upper boundary near $21.72, aligning with previous supply zones.
Conversely, failure to hold above the accumulation range could trigger further downside, exposing LINK to lower support levels. Volume confirmation will be key in determining whether the current price action reverses or continues the downtrend.
About the Author
Bob MasonChief Crypto Boss
TEST 30 He has written extensively for a broader audience and his current focus is on developments relating to the financial markets including, but not limited to currencies, commodities, alternative asset classes, and global equities.
Latest news and analysis


Advertisement