
Advertisement
Advertisement
Tron (TRX) Breaks Major Descending Channel — New Bull Phase Ahead?
By:
Key Points:
- Descending channel breakout suggests bullish continuation.
- Elliott Wave count indicates an impulse wave forming.
- Fibonacci extension points to potential targets near $0.30.

Tron (TRX) has been trading within a descending corrective pattern following a sharp rally to a high. The breakout from this structure now signals potential bullish momentum. A detailed Elliott Wave and Fibonacci analysis suggests the possibility of an impulsive wave forming. Short-term targets are projected based on wave extensions.
TRX Price Analysis
The 4-hour TRX chart illustrates a prolonged correction within a descending channel structure after completing a five-wave impulse on Dec 3, to a high of $0.45. This corrective phase was characterized by a W-X-Y pattern, with the price bottoming out near the $0.22 (0.786 Fibonacci retracement) level on Feb. 3, before stabilizing.
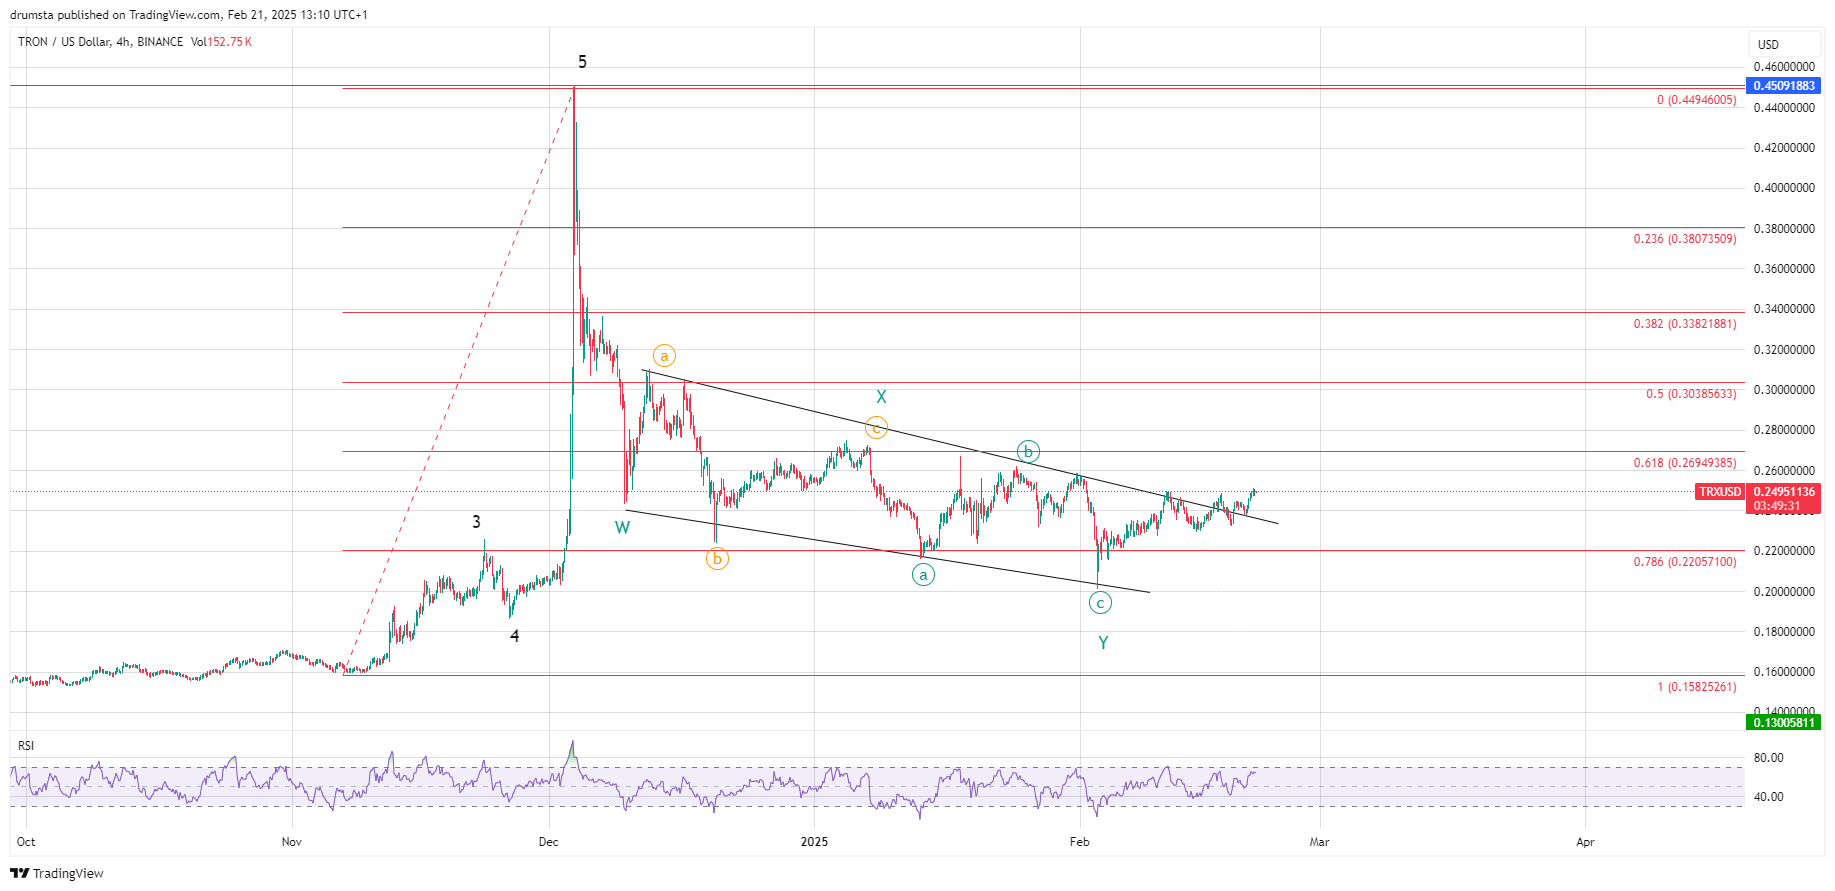
Currently, TRX has broken above the upper trendline of the descending channel at $0.24, indicating potential bullish momentum. This breakout aligns with Elliott Wave theory, suggesting the completion of the Y-wave and the beginning of a new impulsive cycle.
The 0.618 Fibonacci retracement at $0.269 represents a key level that TRX must reclaim to sustain its bullish trajectory.
The Relative Strength Index (RSI) on the 4-hour chart is recovering from neutral territory, signaling increasing momentum. However, it has yet to reach overbought conditions, meaning further upside remains possible before a correction.
If the price can hold above $0.24, it would confirm the strength of the breakout. Failure to sustain momentum could see a retest of lower support levels, with $0.22 (0.786 Fibonacci retracement) acting as the last line of defense before further downside potential emerges.
TRX Price Prediction
The 1-hour TRX chart provides a detailed view of the breakout structure and short-term wave projection. The price has initiated what appears to be Wave (iii) of a five-wave impulse, with a strong move above the former channel resistance.
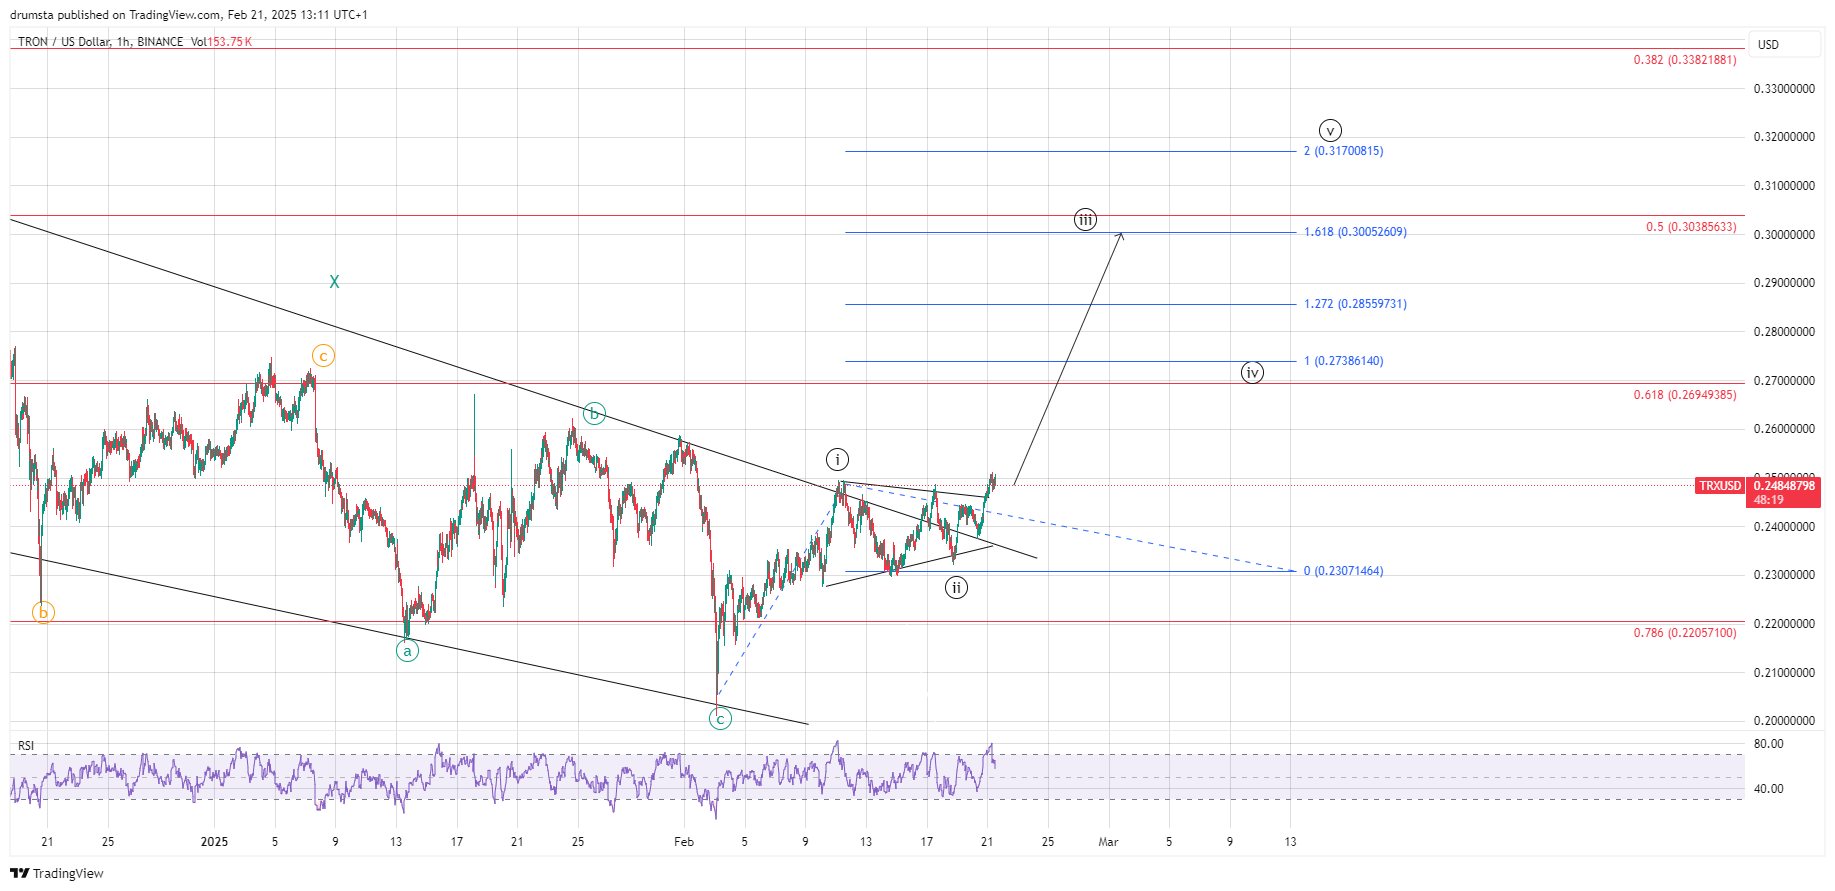
The projected 1.618 Fibonacci extension of Wave (iii) stands at $0.30, aligning with a key horizontal resistance zone. If momentum sustains, further upside toward $0.317 (2.0 Fibonacci extension) could be expected before a corrective Wave (iv) sets in.
However, the structure also presents a risk of Wave (ii) extending further downward, potentially retesting the $0.23 level before resuming upward momentum. If this scenario unfolds, it would allow for a stronger buildup before the next leg up.
The RSI on the 1-hour chart shows bullish divergence, indicating that buying pressure is increasing. Yet, overbought conditions may lead to short-term pullbacks before a continuation move toward $0.30 and beyond.
Confirmation of the bullish wave structure would come if TRX decisively closes above $0.273, turning former resistance into support. A failure to hold above $0.24 could invalidate the impulsive structure and shift bias back toward further downside consolidation.
On the other hand, if the price makes a sharp downturn this possibility would be invalidated. In that case, it could mean that from Feb. 18 low we saw another corrective rise still a part of a larger correction. Another lower low would be expected targeting values below $0.20 and prolonging the correction before the price can initiate a new bull phase.
Key Levels to Watch
- Immediate Resistance: $0.273 (1.0 Fibonacci extension)
- Major Resistance: $0.300 (1.618 Fibonacci extension)
- Critical Resistance: $0.317 (2.0 Fibonacci extension)
- Immediate Support: $0.24 (former breakout level)
- Key Support: $0.230 (0.786 Fibonacci retracement)
- Invalidation Zone: Below $0.220, signaling breakdown
About the Author
Bob MasonChief Crypto Boss
TEST 30 He has written extensively for a broader audience and his current focus is on developments relating to the financial markets including, but not limited to currencies, commodities, alternative asset classes, and global equities.
Latest news and analysis


Advertisement