
Advertisement
Advertisement
Trump Trade War Fuels Volatility Across DAX, Euro Stoxx, and S&P 500
By:
Key Points:
- DAX index found support at 23,400 and continues to trade higher.
- Euro Stoxx 50 index rebounded after Trump threatened a 50% tariff on European imports.
- S&P 500 shows strong volatility within an ascending broadening wedge pattern.

On Friday, US President Donald Trump threatened to impose a 50% tariff on European Union imports starting June 1. The announcement shook global markets and reignited fears of an escalating transatlantic trade war. However, on Sunday, Trump reversed course and agreed to delay the tariff decision until July 9 after a call with European Commission President Ursula von der Leyen. This extension offers a reprieve to financial markets and opens the door for renewed negotiations between Washington and Brussels.
The delay in tariffs brought short-term relief to equity markets, especially in Europe. The DAX index and Euro Stoxx 50 declined sharply after Friday’s announcement and rebounded higher as investors priced out the immediate threat. Moreover, the export-reliant sectors remain sensitive to trade headlines, particularly in Germany.
Meanwhile, the S&P 500 could benefit from improved risk sentiment in the short term. However, this relief is conditional. If no agreement is reached by July 9, markets could face renewed volatility and sharp downside risks, especially in industrial and multinational stocks exposed to EU–US trade flows.
Trump Trade War Adds to Global Economic Pressures and Recession Risks
The unstable global economy and tariff threats add more pressure to a fragile system. Rising Japanese bond yields suggest a looming capital shift away from US Treasuries. If Japanese investors repatriate funds, it could push US Treasury yields higher. The 10-year yield is currently hovering around 4.5%. A sustained move toward 5.0% would tighten financial conditions and further strain equities and corporate borrowing.
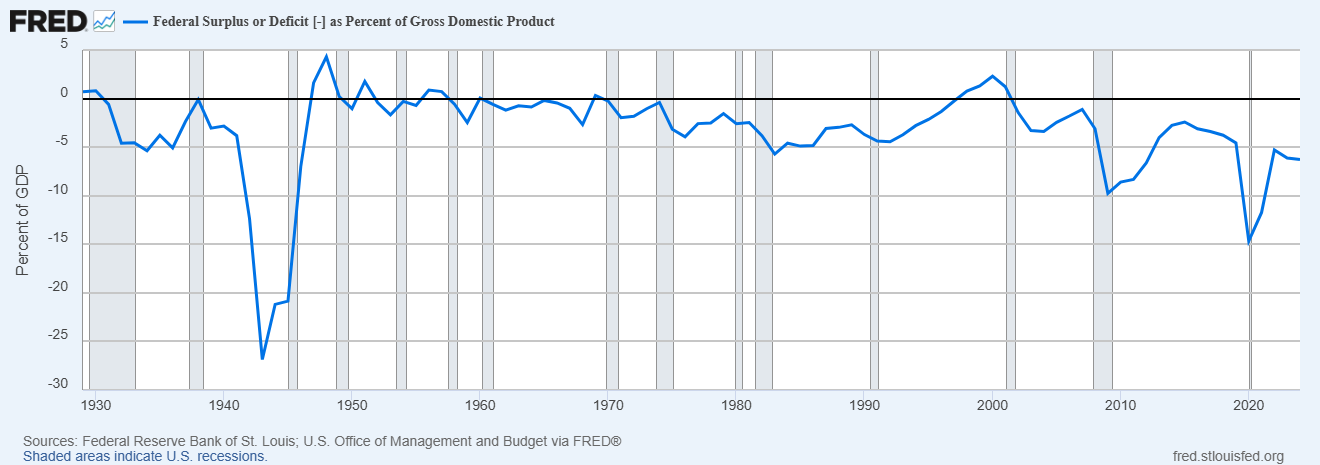
At the same time, the US faces growing fiscal risks. The federal deficit is nearing 6.5% of GDP, usually seen during recessions.
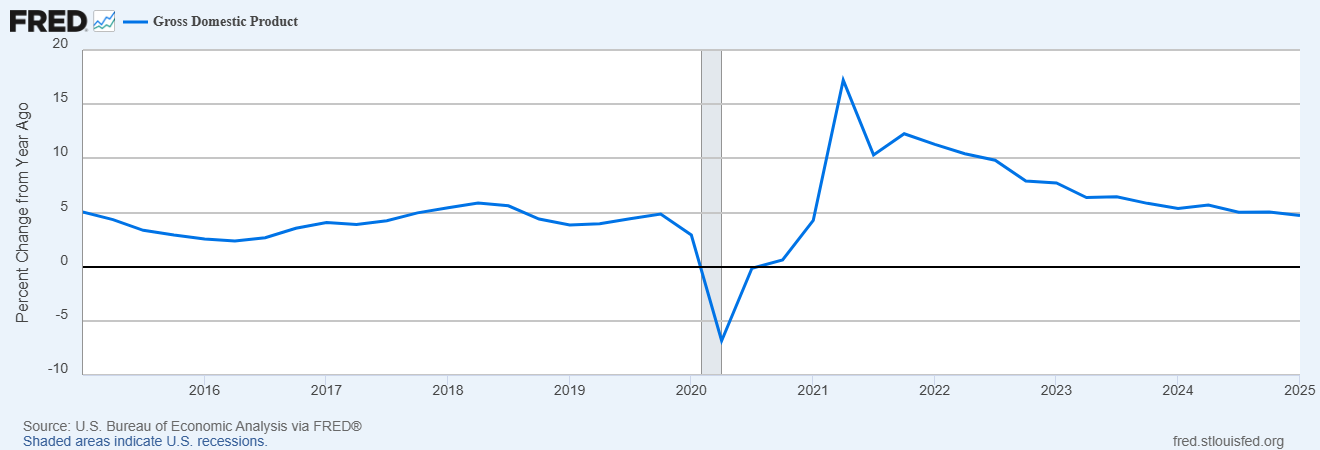
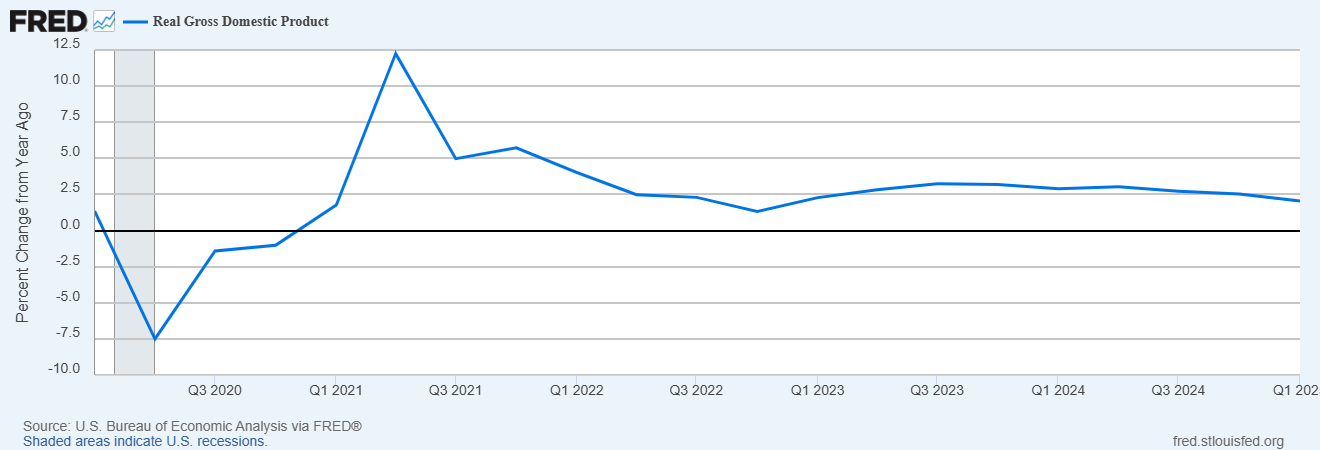
Moreover, the nominal GDP has dropped by nearly 4.7%, while real GDP growth is around 2.0%, as in the charts below. This mismatch worsens the debt-to-GDP ratio, already close to 130%.
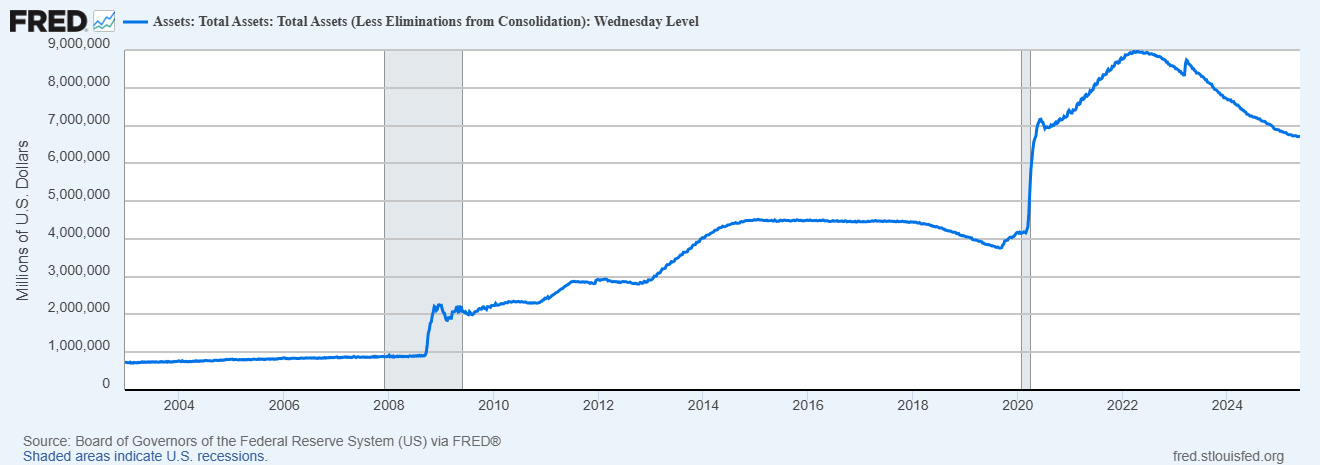
With the Fed constrained by its $7 trillion balance sheet and political tensions rising over Powell’s leadership, investor confidence may weaken. A full-scale tariff war would add inflationary pressure while slowing growth, potentially pushing the US and global economies into a stagflationary spiral.
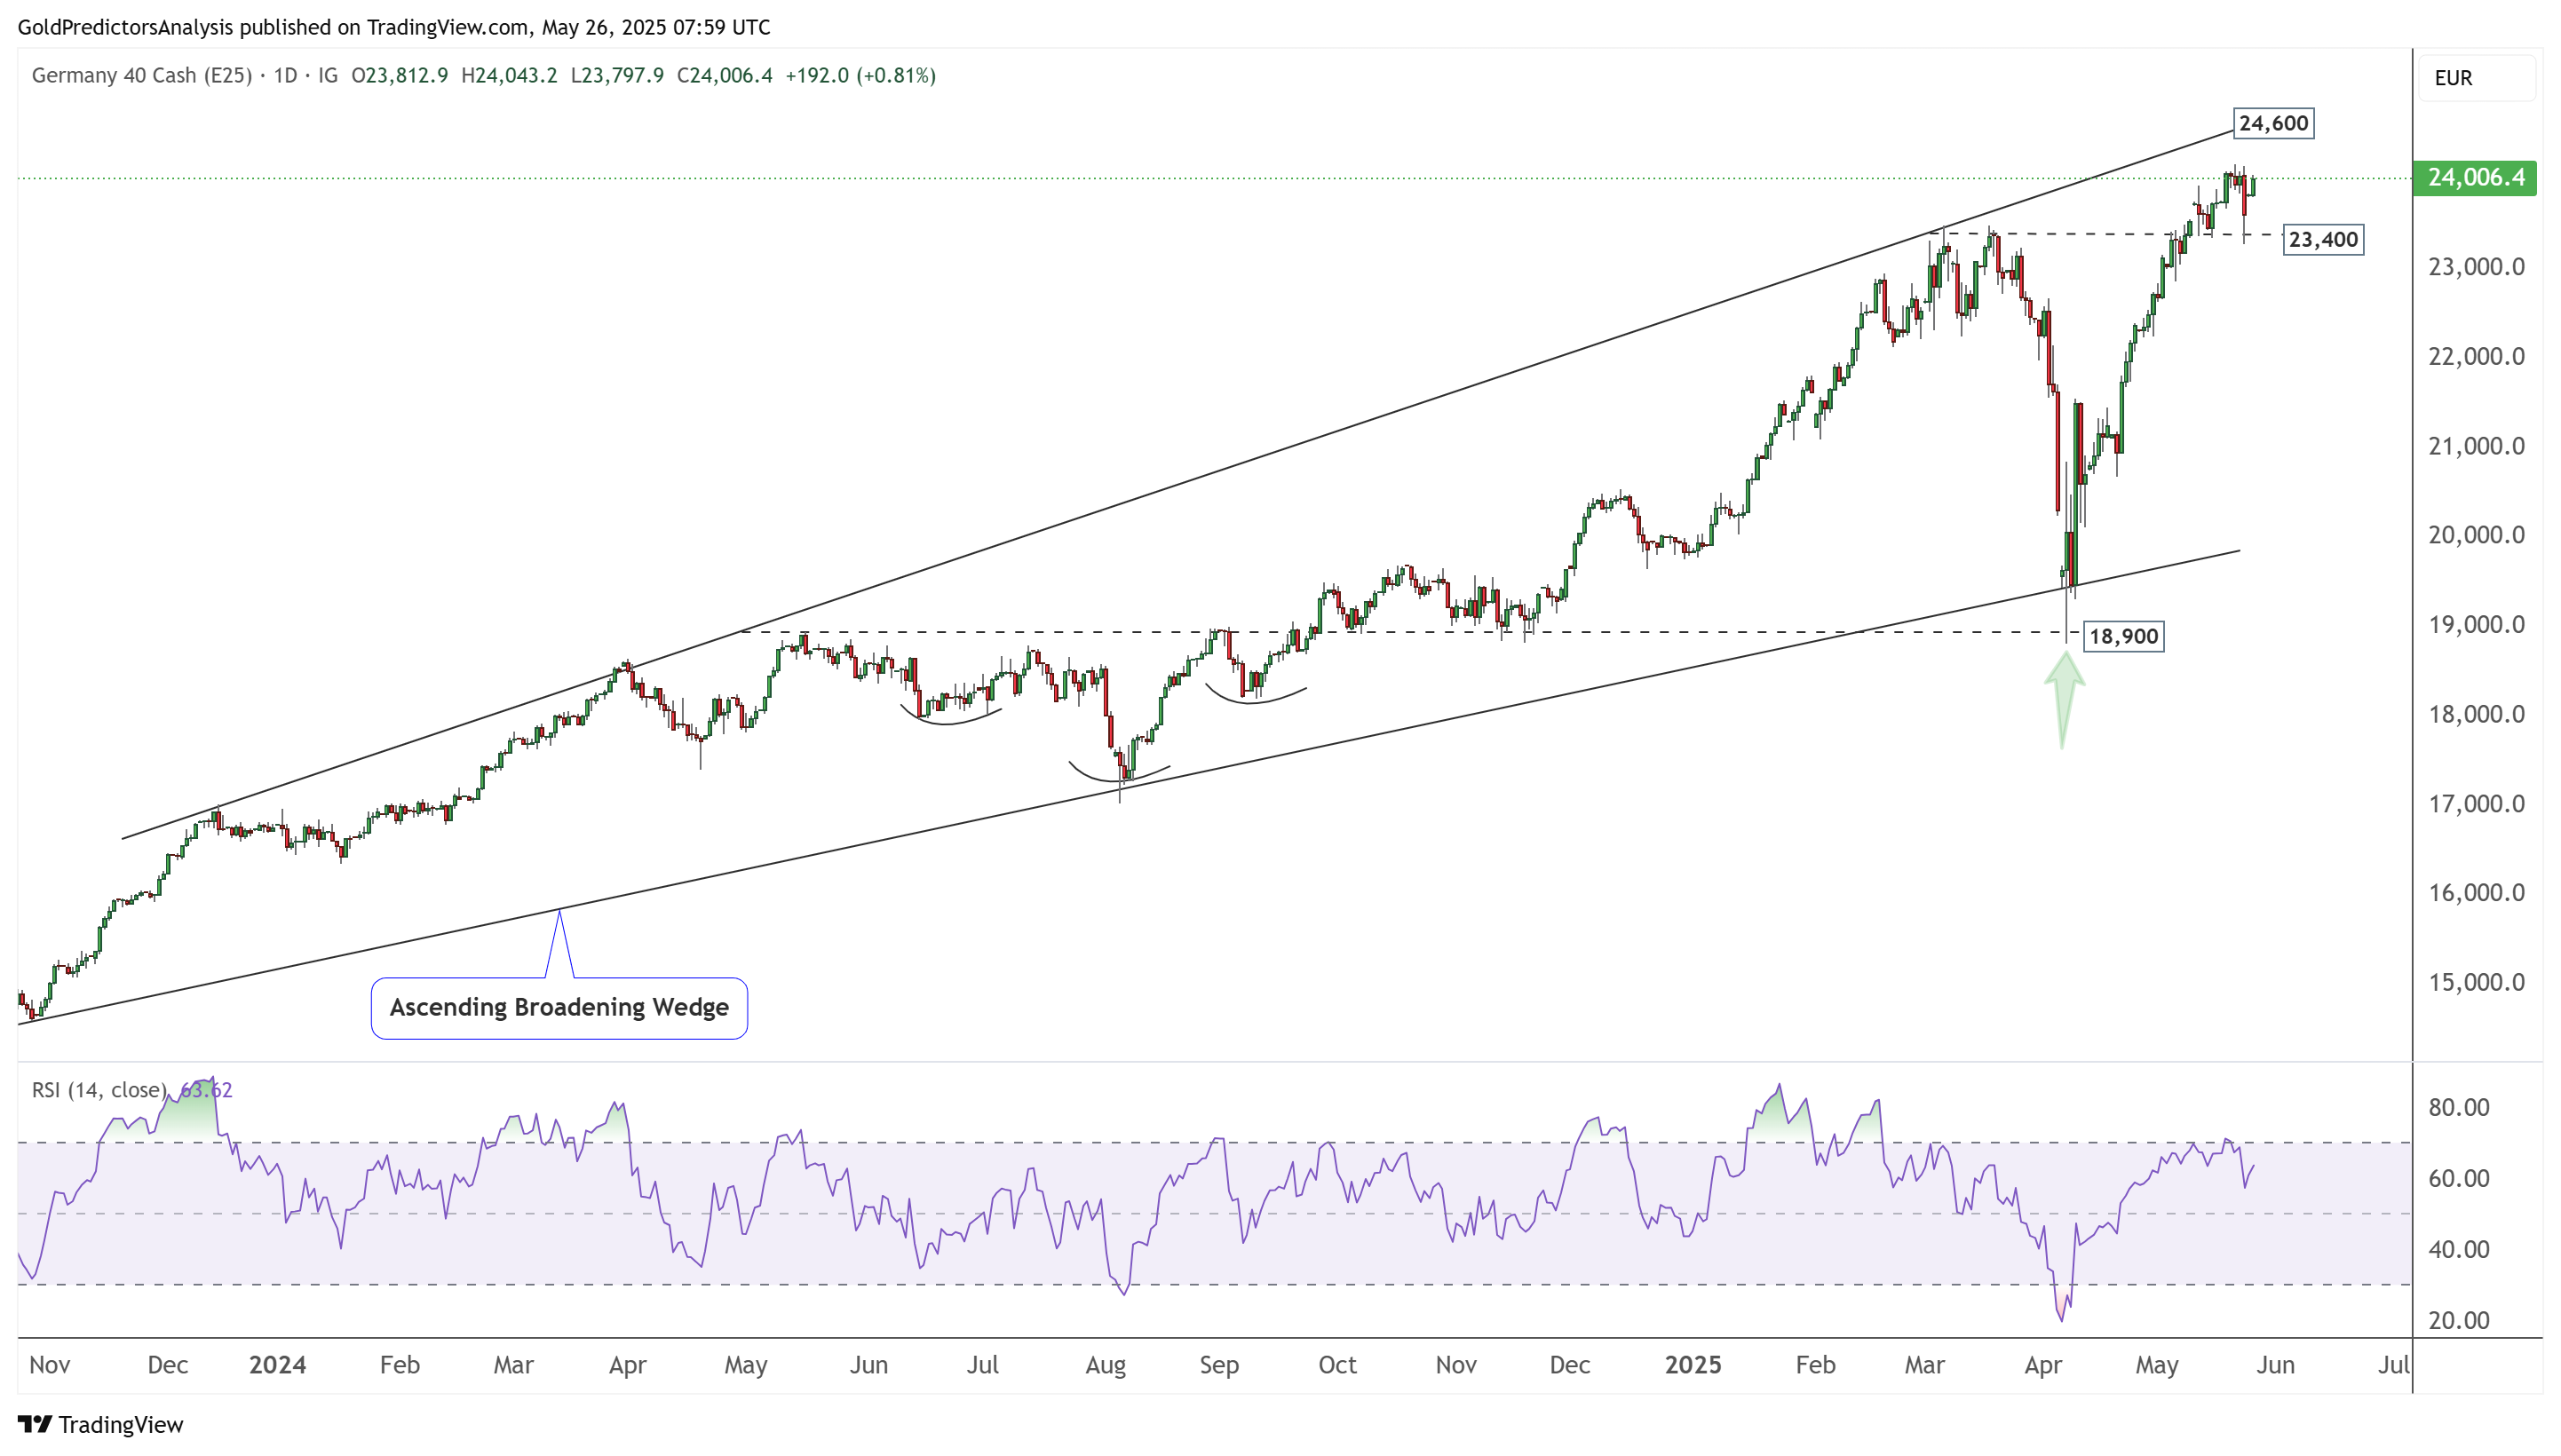
DAX Index Rebounds from Key Support After Tariff-Induced Drop
The DAX index has been trading within an ascending broadening wedge pattern since 2024. This pattern reflects strong volatility in the market. The index hit the upper resistance of the wedge in March and then corrected lower, forming a bottom on April 7, 2025.
After marking a low of around 18,900, the DAX recovered and surged to a record high above 23,400. Last Friday, the index returned to the 23,400 support level following Trump’s tariff threat. However, the DAX successfully rebounded after this dip. The immediate resistance now stands at 24,600, which aligns with the upper boundary of the ascending broadening wedge.
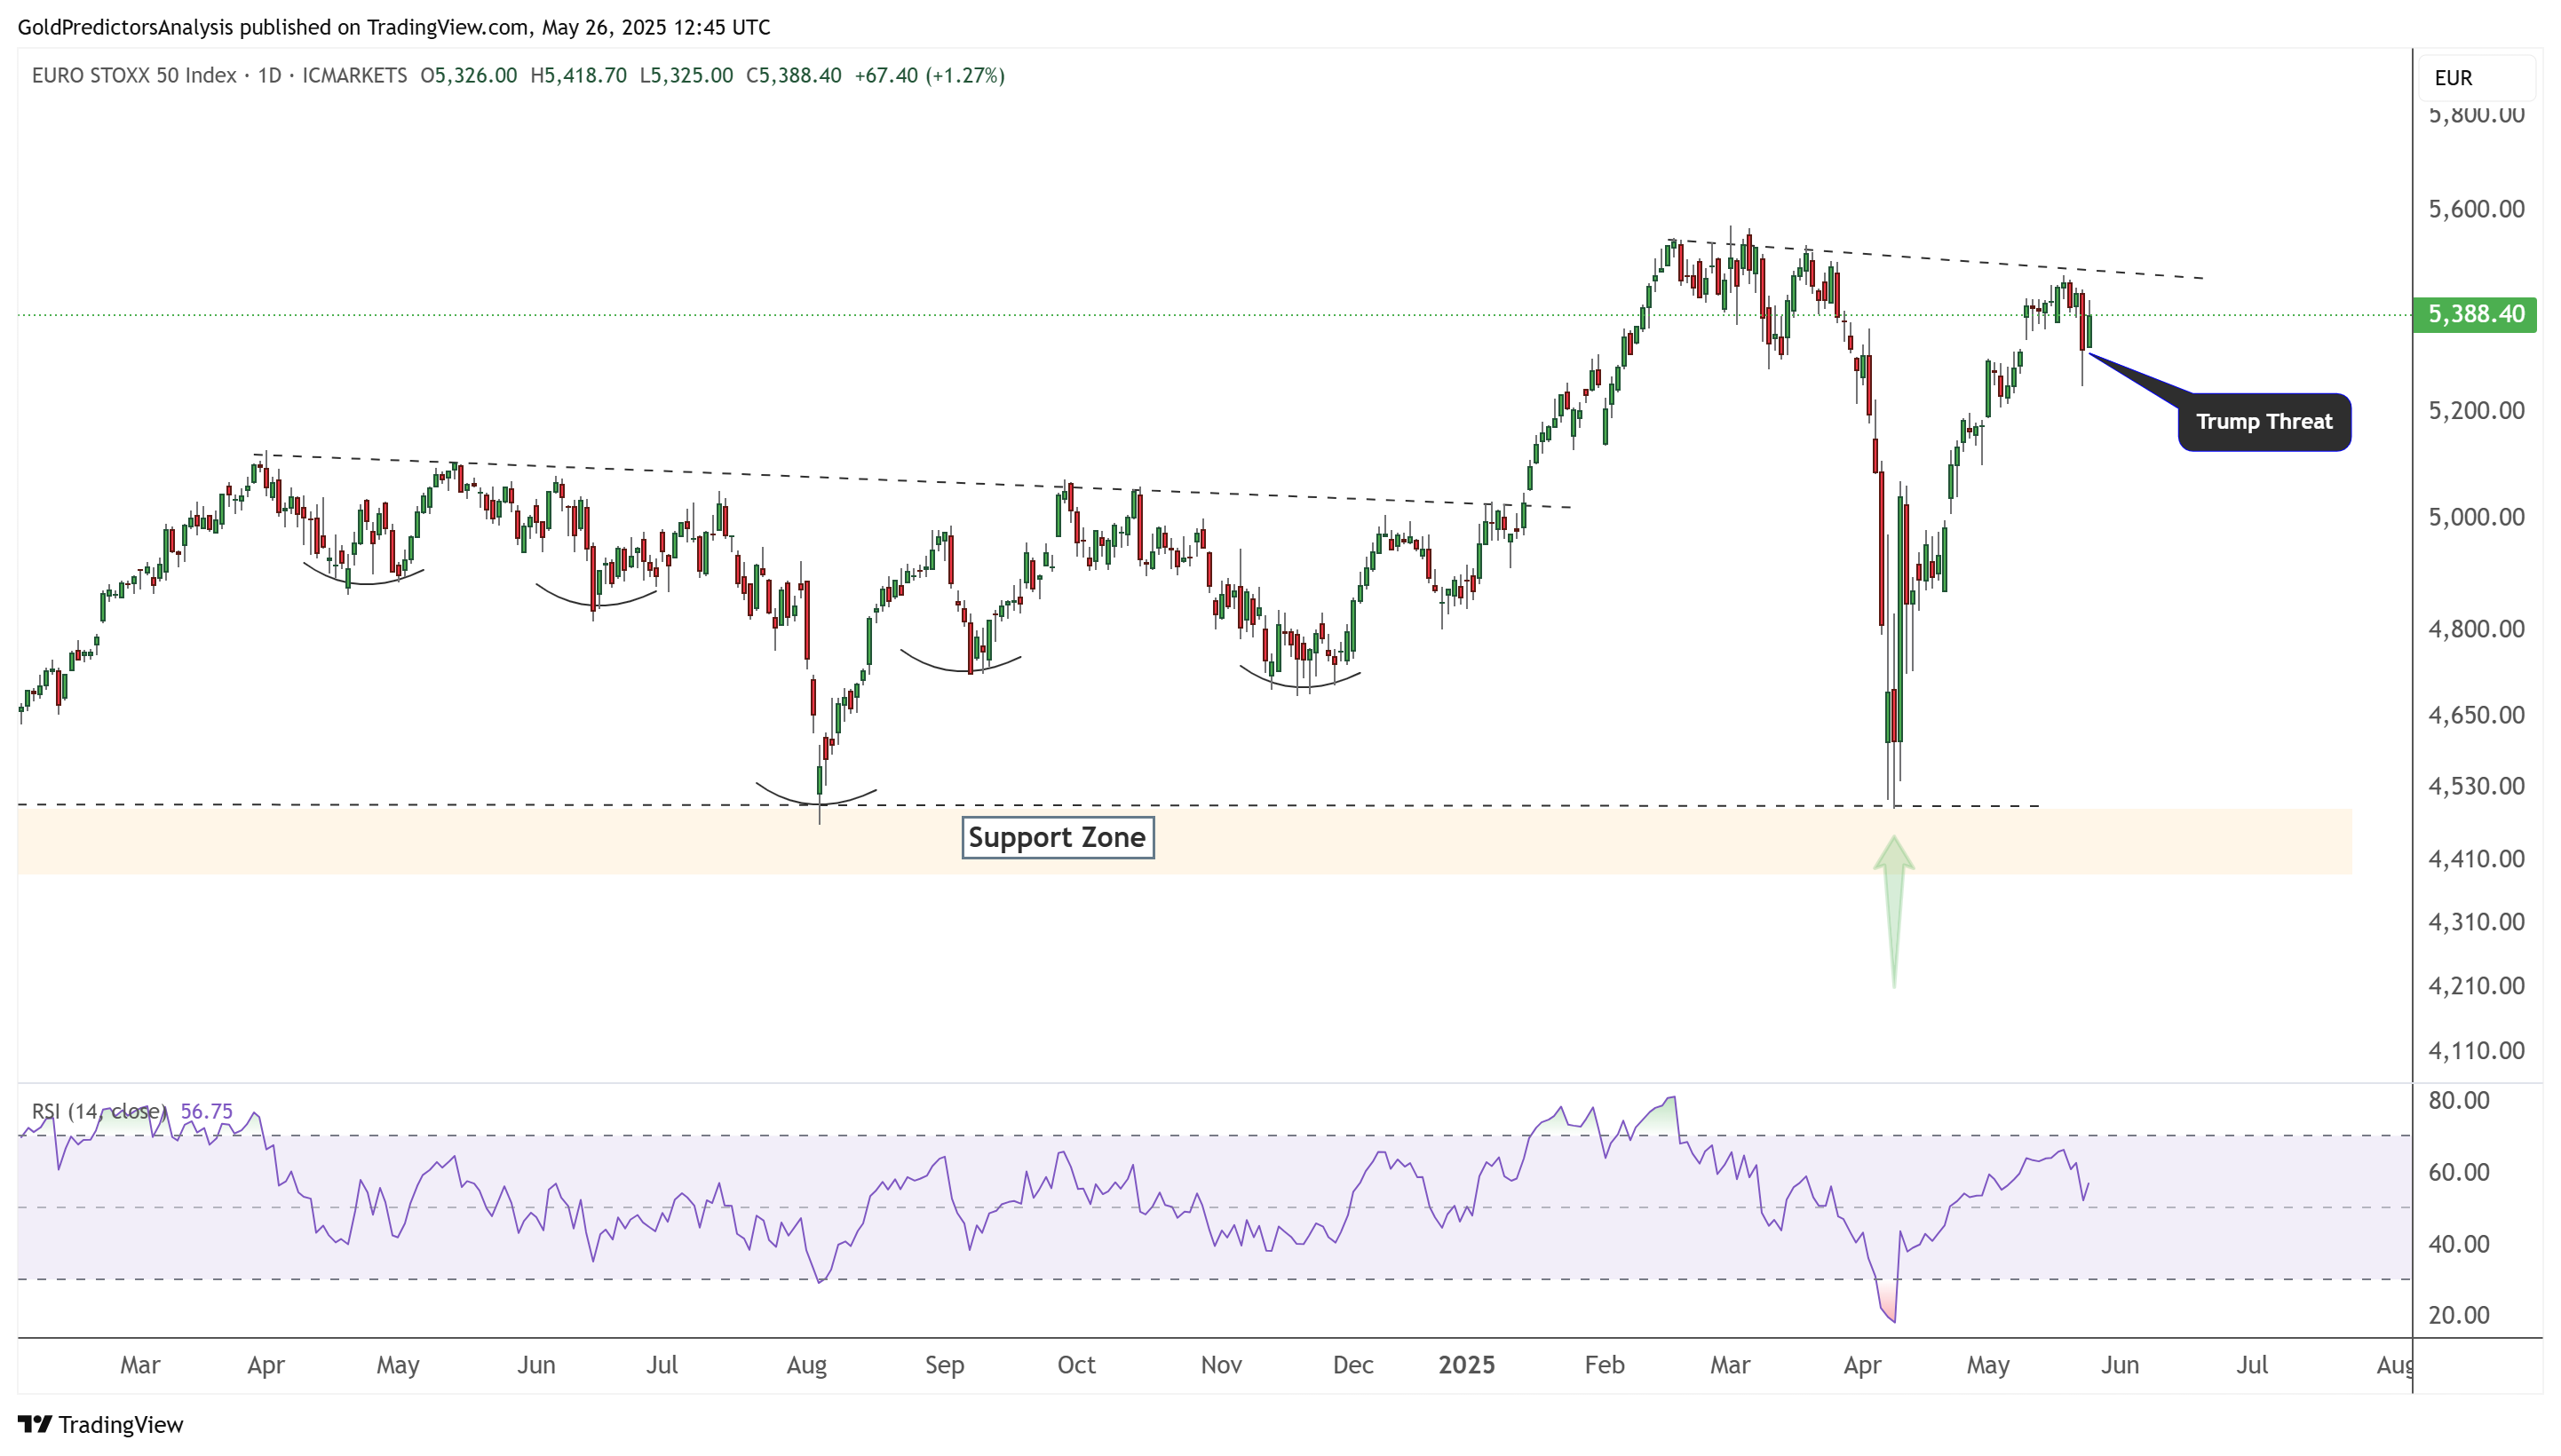
Euro Stoxx 50 Recovers from Tariff Sell-Off, Targets 5,500 Breakout
The daily chart for Euro Stoxx also shows bullish momentum. The index found support near the 4,500 region and rebounded higher. Last Friday, Trump’s threat of 50% tariffs on Europe caused a sharp drop in the Euro Stoxx, but the index quickly recovered from the bottom. It is now trading upward toward the black-dotted trend line. A break above 5,500 will confirm continued bullish momentum in Euro Stoxx.
S&P 500 Builds Bullish Momentum as Technical Patterns Strengthen
The long-term monthly chart for the SPX shows that it is trading within an ascending broadening wedge pattern. The formation of an inverted head and shoulders and a symmetrical broadening wedge highlights strong bullish momentum within this structure.
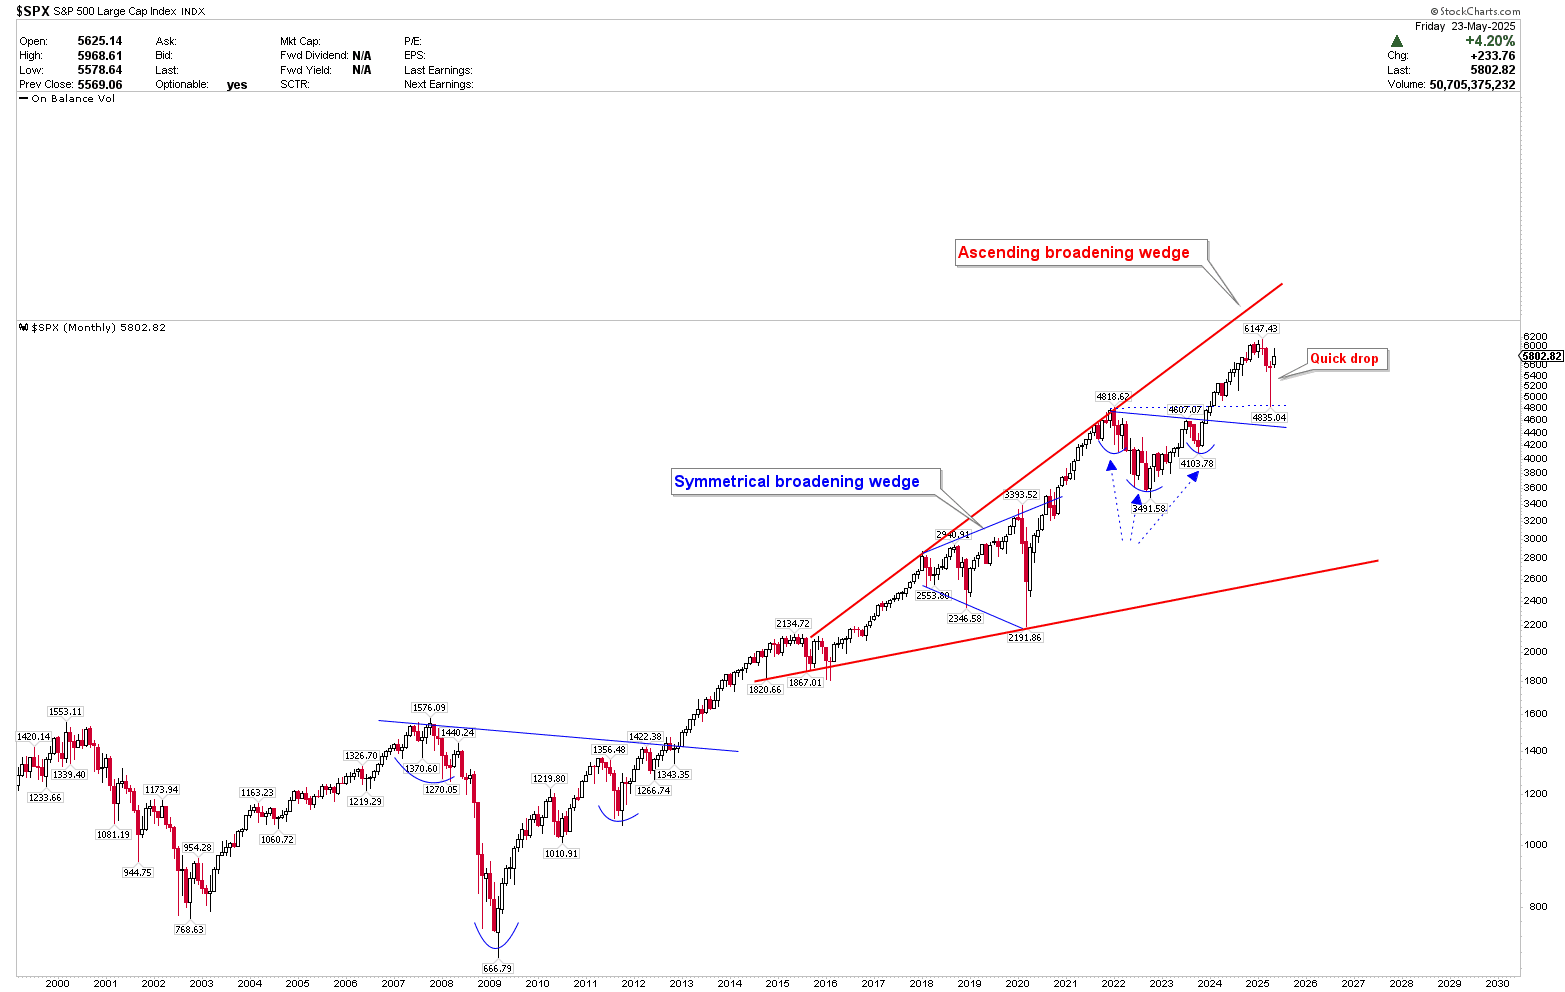
The sharp drop in April was followed by a strong recovery, which marked a bottom of around 4,835. This rebound in April and May suggests that the SPX will continue moving higher. A break above 6,147 would confirm the breakout and could trigger another rally toward new record levels.
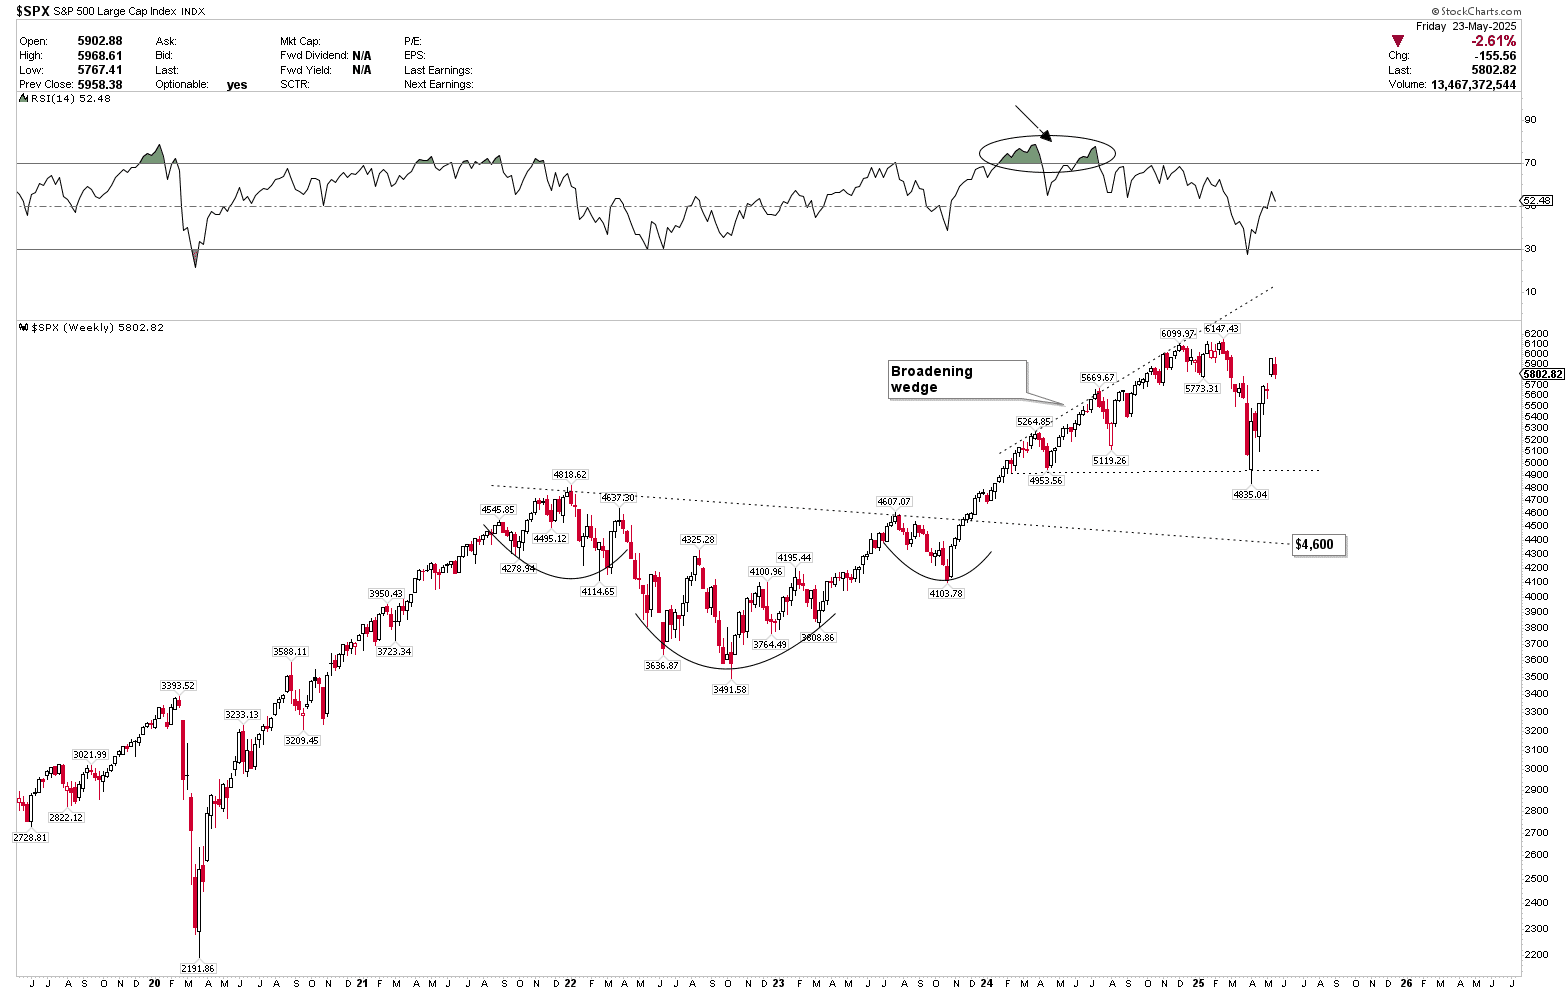
The weekly chart for SPX also shows strong bullish momentum and heightened volatility. The chart formed a broadening wedge pattern after breaking out from the 4,600 region. This pattern signals continued volatility and the potential for large price swings in both directions.
About the Author
Bob MasonChief Crypto Boss
123456789 30 He has written extensively for a broader audience and his current focus is on developments relating to the financial markets including, but not limited to currencies, commodities, alternative asset classes, and global equities.


Advertisement