
Advertisement
Advertisement
U.S. Dollar Struggles Below $99.50 As Tariff Worries Mount – Analysis For EUR/USD, GBP/USD
By:
Key Points:
- The U.S. Dollar Index (DXY) slips to $99.03 amid deficit worries, Moody’s downgrade, and trade tensions.
- The CBO projects a $3.8 billion deficit hike from “One Big Beautiful Bill,” sparking fiscal concerns.
- Moody’s downgrade to Aa1 cites U.S. debt set to reach 134% of GDP by 2035, shaking confidence.

Market Overview
During Tuesday’s Asian session, the US Dollar Index (DXY) continued its decline, dropping to around $99.03. The dollar faces pressure amid rising concerns over the growing US fiscal deficit, Moody’s recent credit downgrade, and persistent trade uncertainties.
Mounting Fiscal Deficit and Moody’s Downgrade Weigh on Confidence
The Congressional Budget Office (CBO) projects a $3.8 billion increase in the deficit from the proposed “One Big Beautiful Bill,” which includes tax breaks on tip income and car loans.
Senator Ron Johnson described the situation as “completely unacceptable,” emphasizing the need for spending cuts.
Moody’s downgraded the US credit rating to Aa1, citing a projected federal debt rise to 134% of GDP by 2035. This follows similar actions by Fitch and S&P.
Tariff Uncertainty and Fed Comments Shape Outlook
Fed officials remain cautious. Neel Kashkari warns that persistent tariffs could trigger stagflation.
Austan Goolsbee and Jeffrey Schmid suggest a wait-and-see approach, while Christopher Waller indicates potential rate cuts later this year if tariffs stabilize.
US Dollar Index (DXY) – Technical Analysis
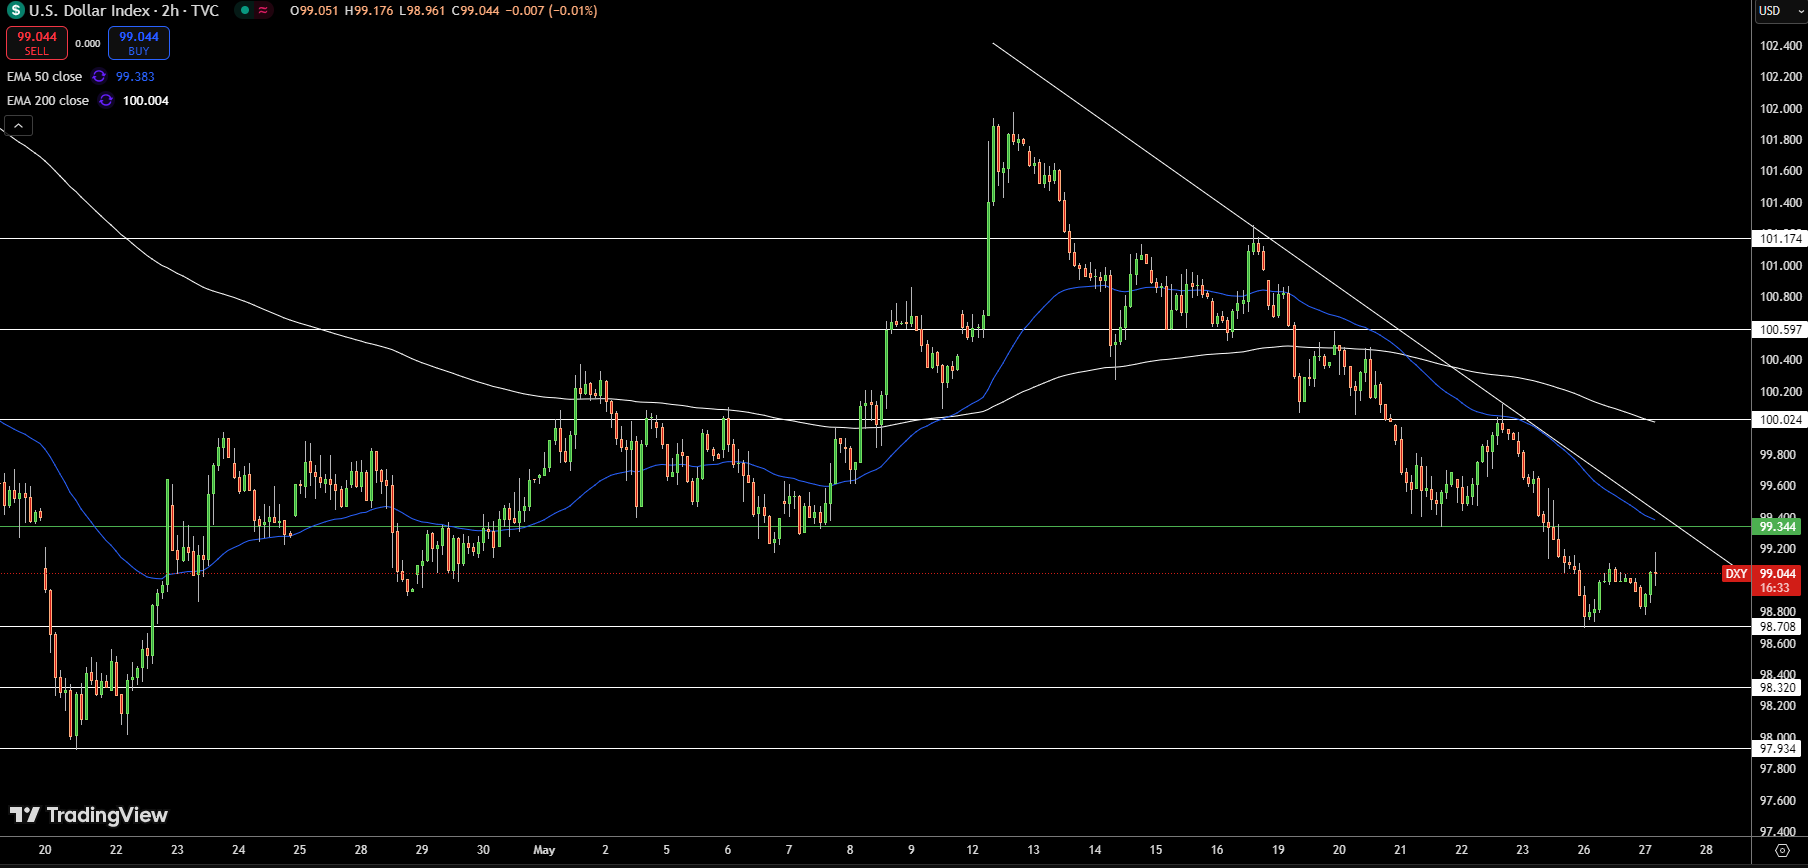
The U.S. Dollar Index (DXY) is struggling to reclaim momentum, trading near $99.03 with the 50-period EMA at $99.38 and the 200-period EMA at $100.00 acting as key resistance levels.
The price action highlights a descending trendline from May highs, with the index testing this trendline today but failing to break through.
Support levels lie around $98.80, while $99.34 serves as immediate resistance. A sustained break below $98.80 could deepen the decline, while a breakout above the descending trendline may suggest a reversal.
GBP/USD Technical Analysis
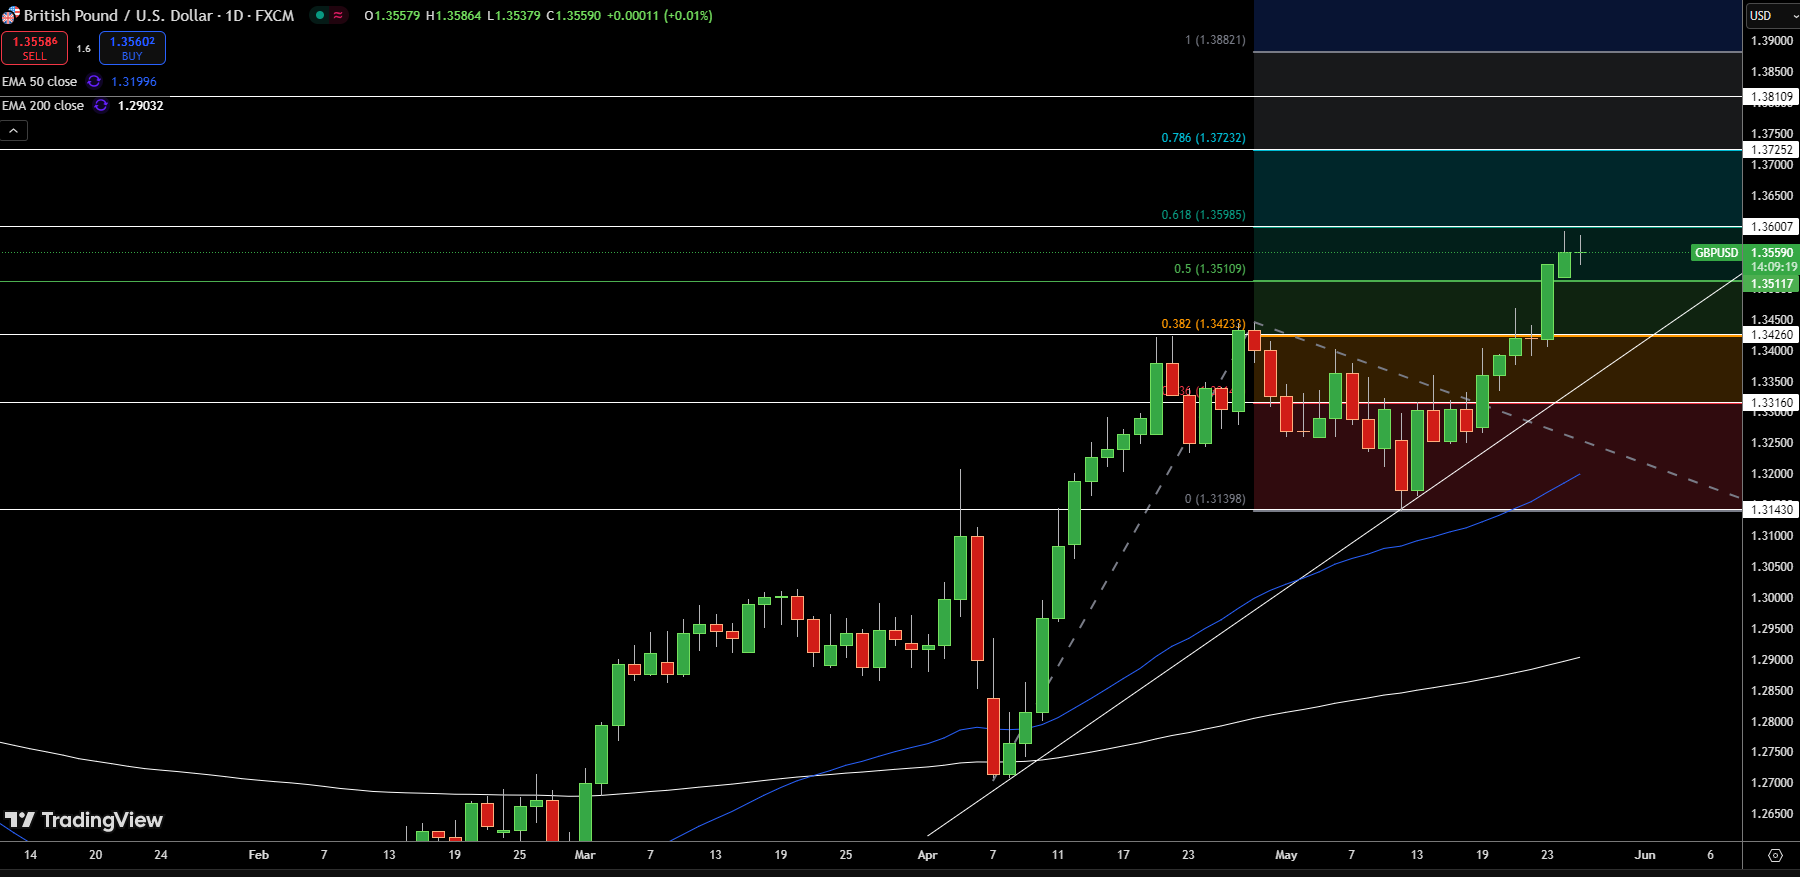
GBP/USD continues its rally, holding firm near $1.3560, supported by recent bullish momentum. The pair has broken above the $1.3511 Fibonacci 50% retracement and is targeting the $1.3598 level (61.8%). A strong break above this level could push prices towards $1.3723 (78.6%) or even $1.3882 (full retracement).
However, if the price fails to hold above $1.3511, a pullback toward $1.3423 or even the trendline around $1.3139 is possible. The overall structure remains bullish, with higher lows and a rising trendline adding to the upward momentum. Traders should monitor resistance at $1.3598 and $1.3723, with caution for a reversal if momentum weakens.
EUR/USD Technical Forecast
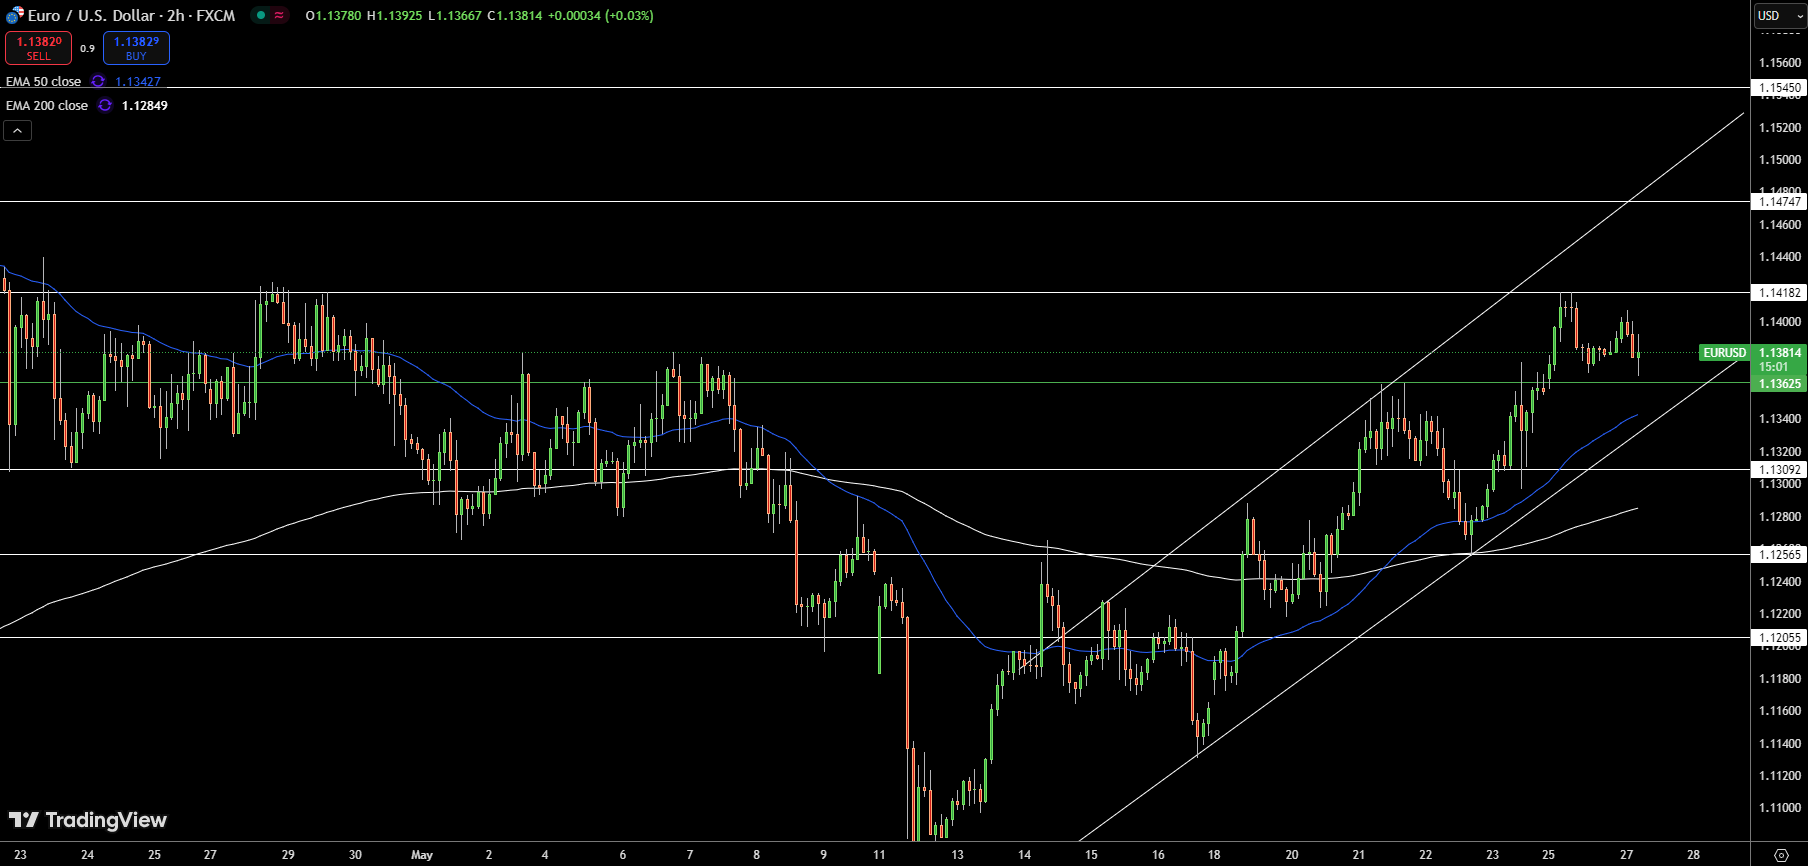
EUR/USD is showing signs of a potential pullback from recent highs, currently trading near $1.1381. The pair broke through resistance levels earlier this week, supported by bullish momentum and a rising trendline.
However, prices are testing the upper boundary of the channel with the 50-period EMA at $1.1343 acting as nearby support. If price action fails to hold above $1.1362, a retracement towards $1.1320 or even $1.1285 could follow.
On the upside, a breakout above $1.1418 could push EUR/USD towards $1.1475. For now, the pair remains range-bound with traders watching key levels and upcoming economic data for directional cues.
About the Author
Bob MasonChief Crypto Boss
123456789 30 He has written extensively for a broader audience and his current focus is on developments relating to the financial markets including, but not limited to currencies, commodities, alternative asset classes, and global equities.


Advertisement